VAL - Transocean Ltd.: The Most Recent Results Reveal A Fundamental Flaw In The Business
2023-11-02 00:01:08 ET
Summary
- Transocean reported a disappointing quarterly loss of $220 million, falling short of analysts' projections.
- The company's backlog increased to $9.4 billion, but its total fleet average rig utilization dropped to 49.4%.
- I recommend buying RIG between $6.50 and $6.15. Lower support might be found at $5.75.
Introduction
Transocean Ltd. (RIG) released its third quarter 2023 results on October 30, 2023.
Also, Transocean published its last fleet Status Report on October 18, 2023. The contract backlog was $9.4 billion as of October 18, 2023. During the conference call, the company offered the following comments about recent contracts:
In India, the Deepwater KG1 received a 60-day extension with its current customer Reliance at a rate of $348,000 per day. As well as a 21-month contract with ONGC at a rate of $347,500 per day, excluding a mobilization fee of $5 million.
in Brazil, the new build ultra-Deepwater drillship, Deepwater Aquila was awarded a three-year contract with Petrobras at a rate of $448,000 per day, excluding a mobilization fee of 90 times contract day rate.
Deepwater Invictus – Awarded a 20-day contract in the U.S. Gulf of Mexico at a rate of $440,000. The well has been completed.
Note: I have followed RIG quarterly since 2014. This new article updates my article published on June 14, 2023.
1: 3Q23 results snapshot and commentary
- Transocean reported a disappointing $220 million or $0.28 per share quarterly loss, which was greater than the $0.04 loss recorded a year earlier. Compared to a loss of $0.02 per share a year earlier, the adjusted loss was $0.36 per share . The outcomes fell short of the analysts' projections.
- The Ultra-Deepwater segment's lower performance this quarter was the cause of Transocean's poor performance. The quarter's revenue came in at $713 million (with a total adjusted revenue of $721 million ). It was down 2.2% QoQ.
- With $721 million in adjusted contract drilling revenues, adjusted EBITDA was $162 million , yielding an adjusted EBITDA margin of roughly 22.5%.
- In 3Q23, there was a $44 million loss from cash from operations, and the quarterly free cash flow is estimated to be negative $94 million .
- Operating and maintenance expenses were $524 million (below guidance), compared to $484 million in the prior period.
- Long-term debt, including current, was $7,386 million, and total debt, including liabilities, was $9,690 million, versus $9,644 million in 4Q22.
- The shares outstanding, both basic and diluted, increased to 774 million compared to 714 million in 3Q22. It is an increase of 8.4% YoY. Total cash dropped to $594 million from $821 million in 2Q23.
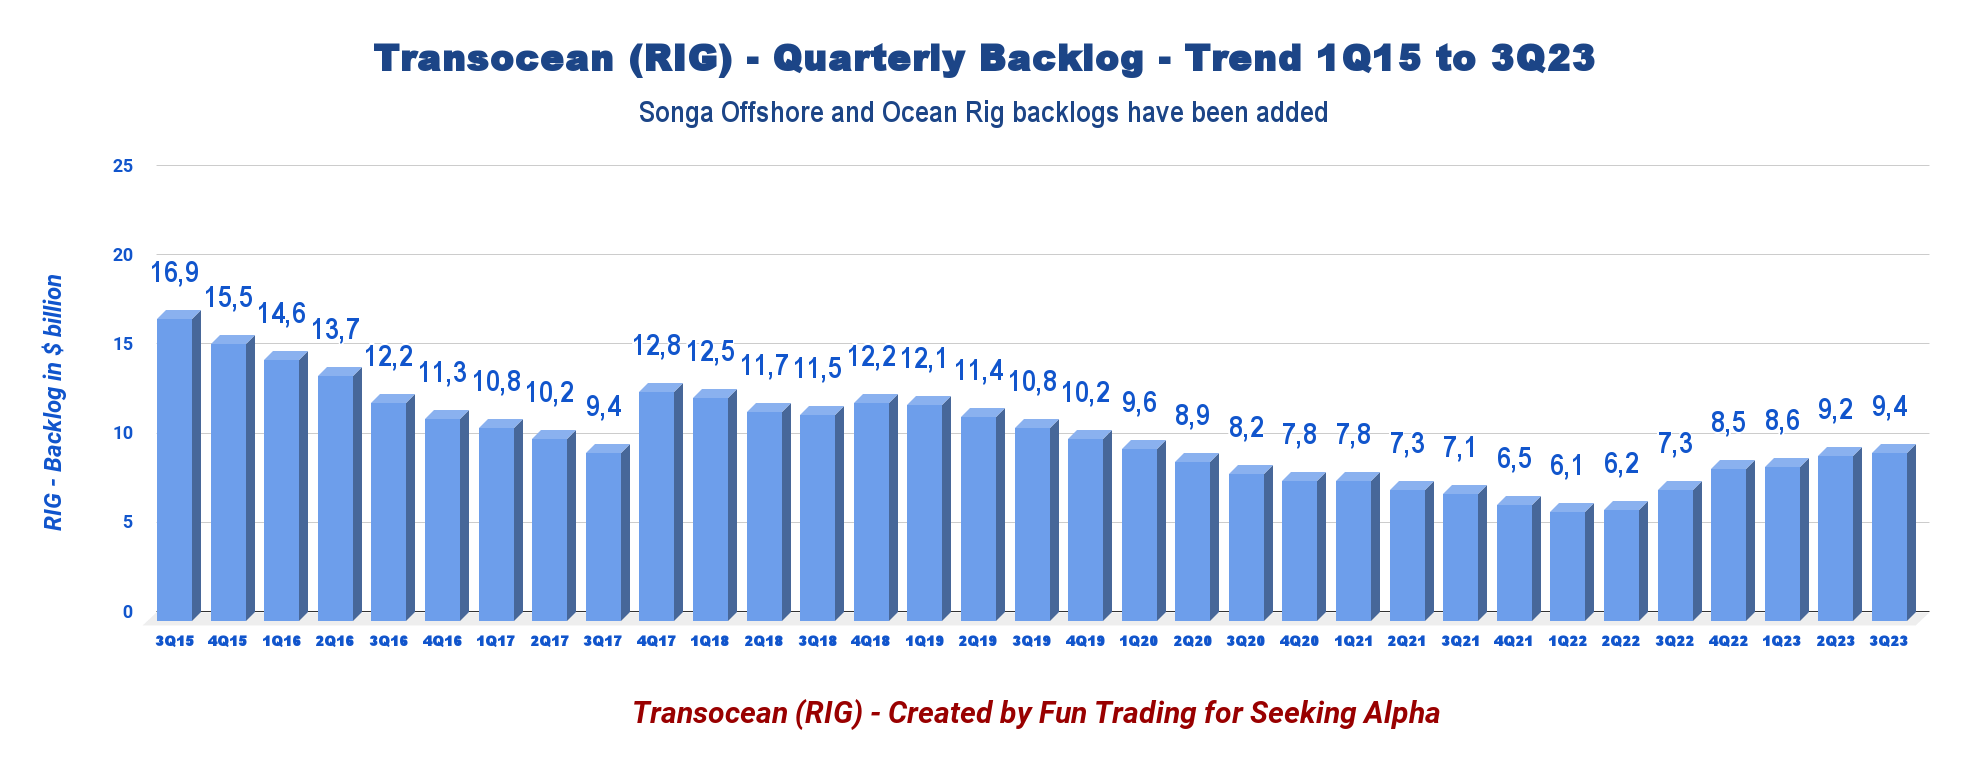
- On the positive side, the backlog has increased to $9.4 billion as of October 18, 2023.
The backlog history from 2015 is shown below.
RIG Quarterly Backlog History (Fun Trading)
Transocean has lost money for the twelfth consecutive quarter, according to the third quarter results, despite a notable increase in the average daily rate now at $391,300/day for its rigs and a sizable increase in backlog now over $9 billion. Unfortunately, the total fleet average rig utilization was 49.4% this quarter versus 54.7% in 2Q23.
Transocean's ultra-deepwater floater revenues represent 72.4% of contract drilling revenues, or $516 million.
The remaining 27.6%, or $197 million was made up of floaters related to harsh environments. This compares with the $536 million and $193 million reported figures from the previous quarter.
CEO Jeremy Thigpen said in the conference call:
since the fourth quarter of 2022, our ultra-deepwater fleet average day rate has increased by approximately 33% to $416,000 per day. By the third quarter of 2024 based upon current firm backlog, we expect this average rate to increase to $437,000 per day.
2: Investment thesis
I've been following Transocean on Seeking Alpha for almost ten years, and I've concluded that the company will never really succeed due to the costly and risky nature of the offshore industry. It is unfortunate but we have to face reality.
It is obvious that operating in this extremely specialized market has significant costs, which will have a detrimental effect on results. Because it would require higher daily rates, which are unrealizable, at least not for the next few years, this fundamental flaw cannot be fixed.
Please take nothing I say personally. Transocean is a decently well-managed company, but even with the recent substantial rise in business, it cannot produce enough cash flow. The proof is in the pudding.
This problem had been deeply rooted in the business model. Drillships, HE Semisubs, and HE Jackups are very expensive to build, have a limited operational lifespan, and require expensive maintenance and running costs (5-year SPS, for example, could go as high as $100 million).
Regarding the investment thesis, it is very difficult to suggest RIG as a long-term alternative. As far as I can recall, the company frequently ends up with negative free cash flow and is heavily indebted. In addition, Transocean isn't paying a dividend either.
As a result, RIG is only appropriate for a particular type of trader seeking high risk/reward potential and should not be included in the portfolio of savvy investors. However, you can earn good money, avoid sleepless nights, and grow a nice recurring gain with the proper trading LIFO strategy. You can then use this gain to build a long position without taking any risks.
As a result, I advise short-term trading LIFO, holding only a small long-term core position for a potential higher target, and trading 70%–80% of your RIG position.
3: Stock performance
Transocean has significantly outperformed Valaris Limited ( VAL ) and Noble (NE) on a one-year basis. RIG is now up a whopping 83% on a one-year basis.
4: Average day rates and utilization for 3Q23
The third quarter average day rate increased to $391.3k/d from the year-ago level of $343.4k/d, up 13.9%. Utilization dropped to 49.4% from 59.4% in the same quarter a year ago.
| Day rates |
| 1Q22 |
| 2Q22 |
| 3Q22 |
| 4Q22 |
| 1Q23 |
| 2Q23 |
| 3Q23 |
| The average daily rate is /d |
| 334.5 |
| 358.1 |
| 343.4 |
| 348.6 |
| 364.1 |
| 367.0 |
| 391.3 |
| Average Utilization |
| 52.7% |
| 58.2% |
| 59.4% |
| 49.4% |
| 51.9% |
| 54.7% |
| 49.4% |
Transocean 3Q23 and Selected Financial History: The Raw Numbers
| Transocean |
| 3Q22 |
| 4Q22 |
| 1Q23 |
| 2Q23 |
| 3Q23 |
| Total contract drilling in billions |
| 0.691 |
| 0.606 |
| 0.649 |
| 0.729 |
| 0.713 |
| Net Income in Millions |
| -28 |
| -350 |
| -465 |
| -165 |
| -220 |
| EBITDA $ Million |
| 284 |
| 153 |
| 35 |
| 192 |
| 157* |
| EPS diluted in $/share |
| -0.04 |
| -0.50 |
| -0.64 |
| -0.22 |
| -0.28 |
| Cash from operating activities in the millions |
| 230 |
| 178 |
| -47 |
| 157 |
| -44 |
| Capital Expenditure in Millions |
| 87 |
| 409 |
| 81 |
| 76 |
| 50 |
| Free Cash Flow in the Million |
| 143 |
| -231 |
| -128 |
| 81 |
| -94 |
| Cash and short-term investments: $ Billion |
| 0.954 |
| 0.683 |
| 0.747 |
| 0.821 |
| 0.594 |
| Long-term debt in $ Billion (including current) |
| 7.201 |
| 7.347 |
| 7.625 |
| 7.447 |
| 7.386 |
| Shares outstanding (diluted) in millions |
| 714 |
| 726 |
| 728 |
| 761 |
| 774 |
| Backlog |
| 3Q22 |
| 4Q22 |
| 1Q23 |
| 2Q23 |
| 3Q23 |
| RIG Backlog in $ billion |
| 7.3 |
| 8.5 |
| 8.6 |
| 9.2 |
| 9.4 |
Source: press release.
* Indicated by Transocean
Analysis: Revenues, Earnings Details, Free Cash Flow, and Net Debt
1: The company posted quarterly revenues of $713 million in 3Q23
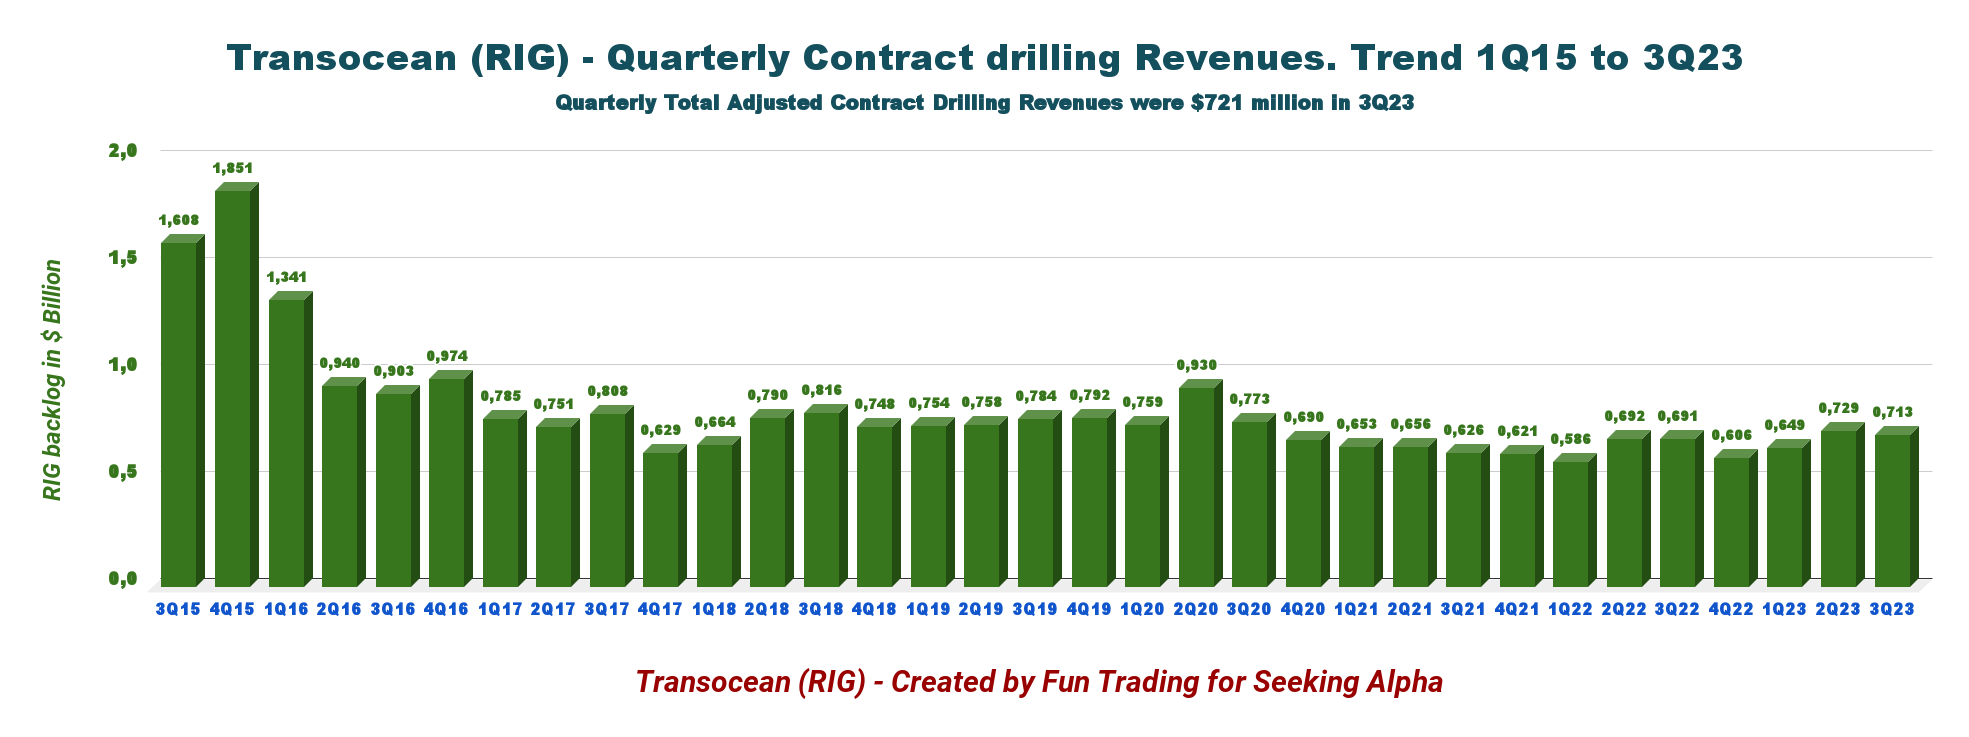
Note: The total adjusted contract drilling revenues declined to $721 million from $742 million in 2Q23. The difference between revenues is that RIG had $8 million in contract intangible asset amortization.
RIG Quarterly Revenue History (Fun Trading)
Transocean's revenues in 3Q23 were $713 million , up from $691 million in 3Q22, an increase of 3.2%. Total adjusted contract drilling revenues were $721 million in 3Q23. Revenue efficiency decreased sequentially this quarter to 95.4%, compared to 97.2% in the prior quarter.
The net loss in the third quarter of 2023 was $220 million, or $0.28 per diluted share (adjusted net loss of $280 million ). The adjusted EBITDA was $162 million this quarter, compared to $237 million the prior quarter.
To put it briefly, the quarter was disappointing, exhibiting unexpectedly low figures that deviated from the company's projections. It doesn't prevent
CEO Jeremy Thigpen said in the conference call:
The number of global floater opportunities continues to expand, reflecting very strong demand and further encouraging our view of a longer term sustainability of the cycle. Indeed, overall demand remains on the rise with 84 rig years of activity expected to be awarded for 77 discrete [ph] programs starting in 18 months.
2: Free cash flow was a loss of $128 million in 3Q23
RIG Quarterly Free Cash Flow History (Fun Trading)
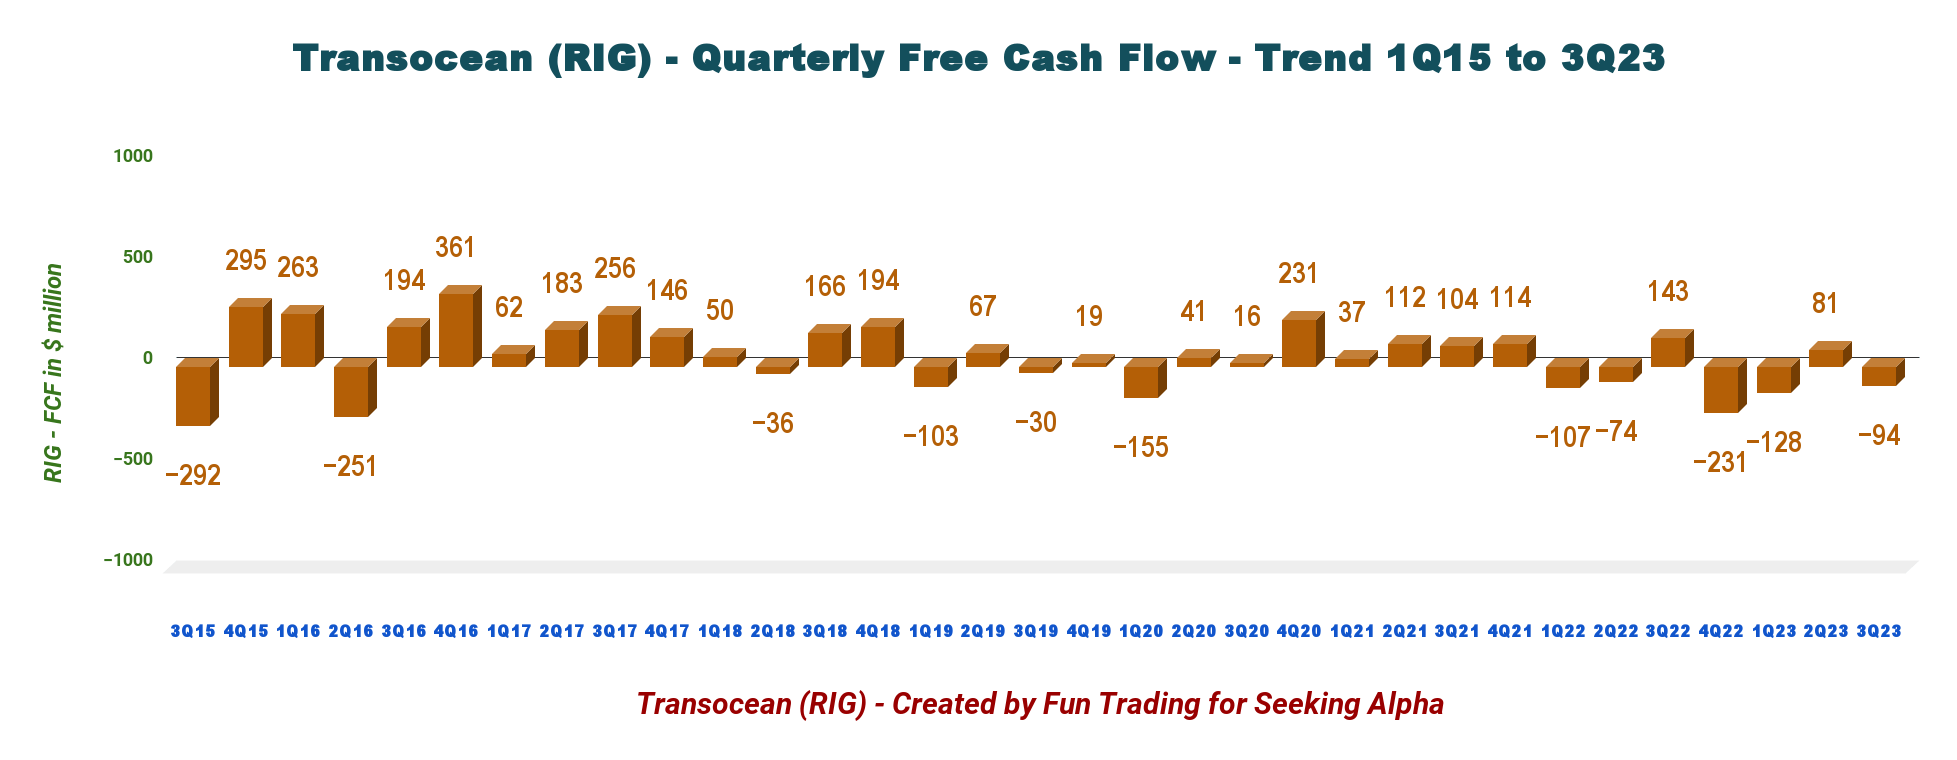
Important Note: The cash from operating activities less capital expenditures is the total free cash flow.
While CapEx decreased to $50 million from $76 million in the previous quarter, the cash from operations experienced a loss of $44 million in 3Q23. In 3Q23, RIG's free cash flow was minus $94 million . The free cash flow for the previous 12 months was minus $372 million.
CFO Mark Mey said in the conference call:
Operating cash flows were negative $44 million, primarily due to approximately $135 million of contract preparation and mobilization costs, affecting 7 rigs starting new contracts in late 2023 and 2024, including 2 rigs in Brazil, 2 rig that being prepared for Brazil, 2 rigs bound for Australia and 1 rig operating in the eastern Mediterranean.
3: Net debt (gross debt minus total cash) was $6.792 billion in 3Q23
RIG Quarterly Cash versus Debt History (Fun Trading)
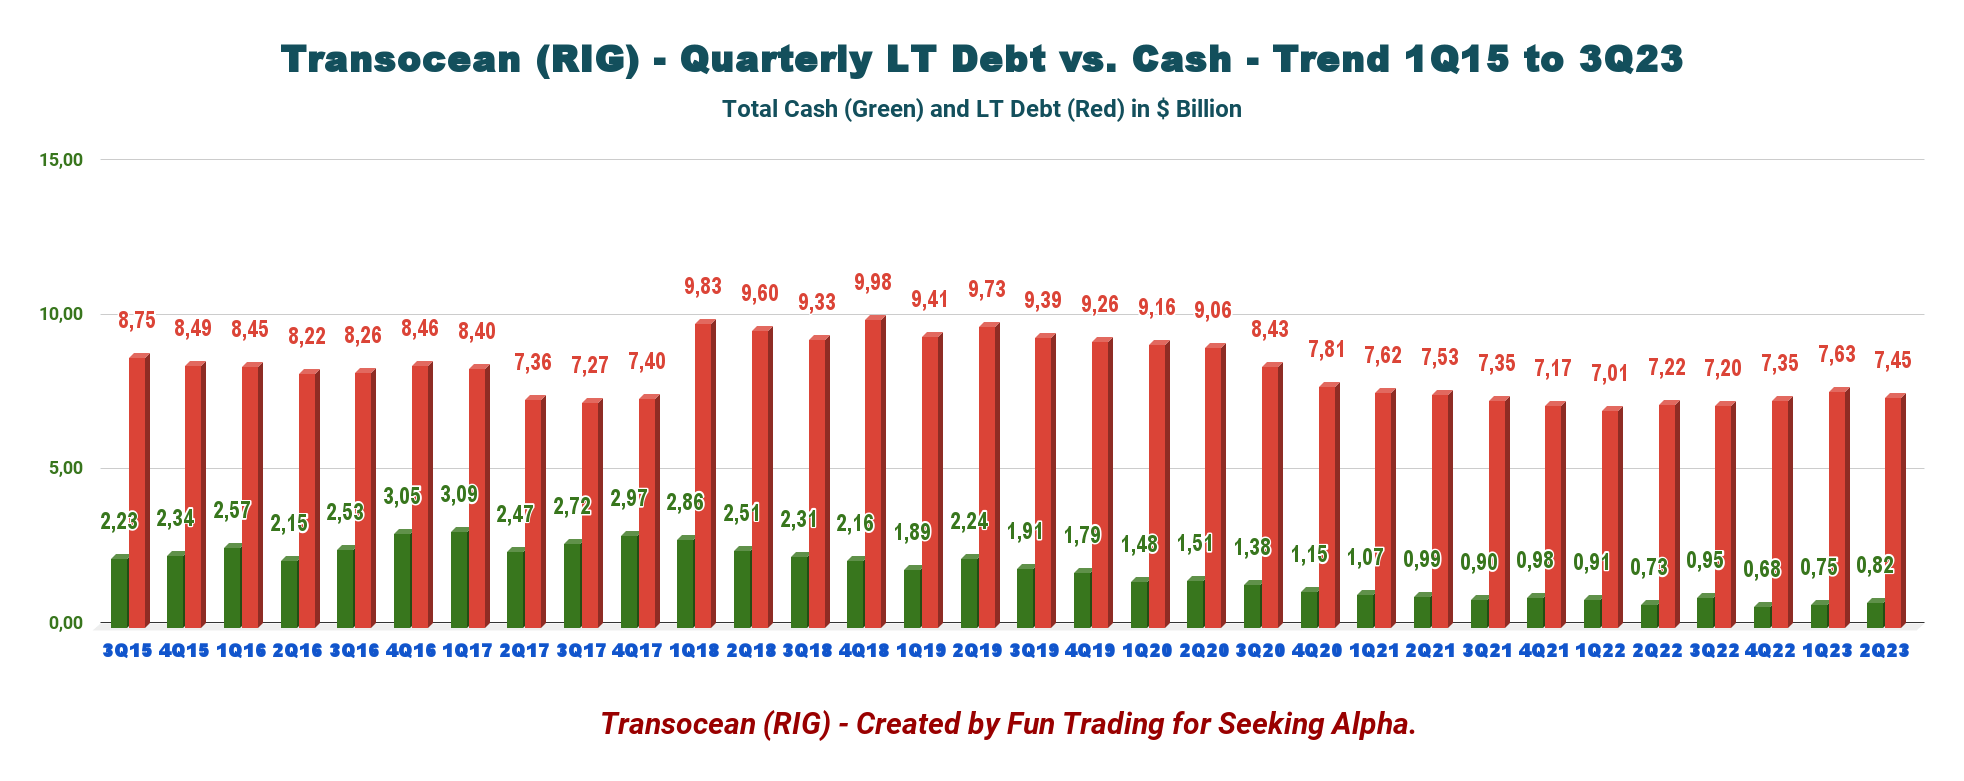
As of September 30, 2023, net debt was approximately $6.792 billion , up from $6.242 billion during the same period the previous year. September 2023's total liabilities, including current, were $9.69 billion , up from $9.64 billion in 4Q22. Liquidity was approximately $1.4 billion in 3Q23.
However, the total cash was $594 million , down sequentially (please see the chart above). The total cash dropped significantly this quarter and it is not a good sign.
Another unsettling issue is that the shares outstanding diluted for 3Q23 jumped to 774 million shares , up 8.4% on a one-year basis.
This exemplifies the main topic that I raised in my earlier post.
A company that has a massive level of debt is usually one that is struggling to produce enough free cash flow. As a result, the business continues to dilute the stock, increasing the number of outstanding shares at a rate of 8% to 9% annually, and pays over $125 million in net interest each quarter.
4: 4Q23 Guidance
- For the fourth quarter of 2023, Transocean expects adjusted contract drilling revenues of $760 million based on an average fleet-wide revenue efficiency of 96.5%. RIG expects fourth quarter O&M expense to be approximately $565 million from $524 million in 3Q23.
- RIG indicated net interest expenses for the fourth quarter of $127 million. G&A expense for the fourth quarter will be increasing to approximately $55 million.
- Finally, CapEx in 4Q23 is estimated at $270 million , which includes approximately $210 million related to the preparation of the Deepwater Aquila for 3-year contract with Petrobras in Brazil and $16 million with a Deepwater Atlas and Deepwater Titan. Another large loss in free cash flow for 4Q23. CapEx was $50 million in 3Q23.
- For FY23, the company forecasts O&M expenses of $1.9 billion and expects adjusted contract revenues between $2.8 and $2.9 billion.
Additionally, CFO Mark Mey provided a preliminary financial outlook for 2024. During the conference call, he stated:
We currently forecast adjusted contract revenue to be between $3.7 billion and $3.9 billion. This includes approximately $200 million of additional services and reimbursable expenses. We expect our full year O&M expense to be between $2.1 billion and $2.3 billion.
Finally, we anticipate G&A cost to be around $195 million . Our preliminary projected liquidity at the end of 2024 is $1.5 billion to $1.7 billion, reflecting our revenue and cost guidance and including the $600 million capacity of our undrawn revolving credit facility and restricted cash of approximately $340 million, most of which is reserved for debt service.
This liquidity forecast includes 2024 CapEx expectations of $195 million , of which approximately $105 million is related to the Deepwater Aquila and approximately $90 million for sustaining and contract preparation CapEx.
Technical Analysis and Commentary
RIG TA Chart (Fun Trading StockCharts)
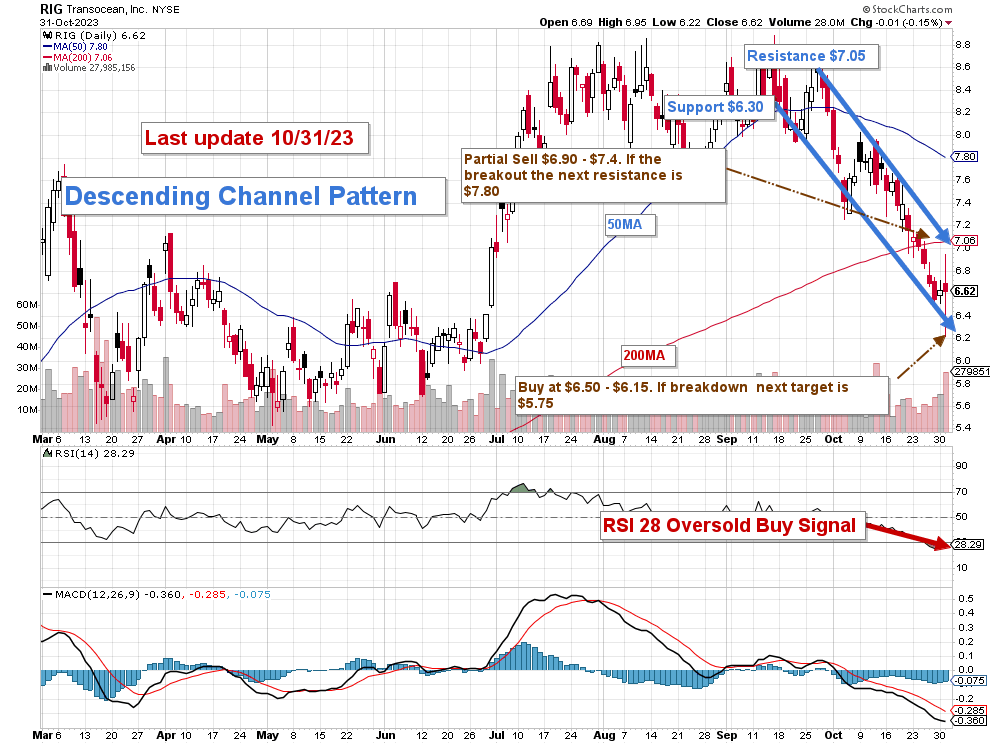
RIG forms a steep descending channel pattern , with resistance at $7.05 and support at $6.30. The RSI is 28 and flashing a buy signal.
Descending channel patterns are short-term bearish in that a stock moves lower within a descending channel, but they often form within longer-term uptrends as continuation patterns. Higher prices usually follow The descending channel pattern but only after an upside penetration of the upper trend line.
I would advise you to hold a small, long-term position in Transocean Ltd. and to trade LIFO with 80–85% of your holdings while you wait for a higher final price target of $7.50 to $8.50 for your core position.
My recommendation is to sell 40% between $6.90 and $7.40 and sell an extra 40% above $7.80 . In the event that support fails, I advise holding off on adding until a retracement occurs between $6.50 and $6.15. Lower support might be found at $5.75 .
Warning: The TA chart must be updated frequently to be relevant. It is what I am doing in my stock tracker. The chart above has a possible validity of about a week. Remember, the TA chart is a tool only to help you adopt the right strategy. It is not a way to foresee the future. No one and nothing can.
For further details see:
Transocean Ltd.: The Most Recent Results Reveal A Fundamental Flaw In The Business