TREX - Trex Company Is Still Full Of Value
Summary
- Trex Company, Inc. has benefited from the stay-at-home trend during the pandemic that boosted revenue for home improvement products like composite decking.
- Trex has produced impressive revenue growth over the past ten years.
- Despite increases in share prices, Trex shares may be slightly undervalued.
- This article tells what investors could likely make in the future with Trex and what the real value is versus the current share price.
While Trex Company, Inc. ( TREX ) has reported stellar results in recent quarters, its most recent guidance for the remainder of 2022 signaled a “sudden reduction” in demand as companies that utilize Trex products slow purchases to right-size inventories for an expected economic slowdown. Trex says it expects a “significant reduction of revenues” in the second half of the year. Nonetheless, Trex is confident in the long-term viability of its products and is moving forward with construction of a new manufacturing facility in Arkansas and launched a new product line earlier this year.
Trex is also expanding its NexTrex Recycling Initiative which provides revenue to companies that serve as plastic recycling drop-off facilities. Trex provides each location, in its network of more than 32,000 grocery stores and other retailers, with equipment to collect and bundle recyclable plastic. When the facility collects enough material, Trex sends trucks to pick up the material and utilizes it to make its composite decking. The expansion of the program will include cities, universities and other non-profits that didn’t meet earlier volume thresholds to participate.
Trex’s focus on funding recycling sources and the utilization of recycled materials resulted in the company being named as the greenest decking company by Green Builder Magazine. It’s the 12th consecutive year Trex earned this accolade.
When considering these current stories about Trex, we need to determine which news topics will have a long-term and ongoing effect on the company and its share price. While the drop in demand is a worrisome development, the company is adamant that it’s a short-term hinderance. Conversely, Trex’s manufacturing expansion and growing product line will provide long-term benefits. In addition, its econ-friendly recycling initiative will continue to keep manufacturing costs lower and help to promote the company.
While current news stories, good or bad, can sway our opinion about investing in a company, it's good to analyze the fundamentals of the company and to see where it's been in the past and in which direction it's heading.
This article will focus on the long-term fundamentals of the company, which tend to give us a better picture of the company as a viable investment. I also analyze the value of the company versus the price and help you to determine if TREX is currently trading at a bargain price. I provide various situations which help estimate the company's future returns. In closing, I will tell you my personal opinion about whether I'm interested in taking a position in this company and why.
Snapshot of the Company
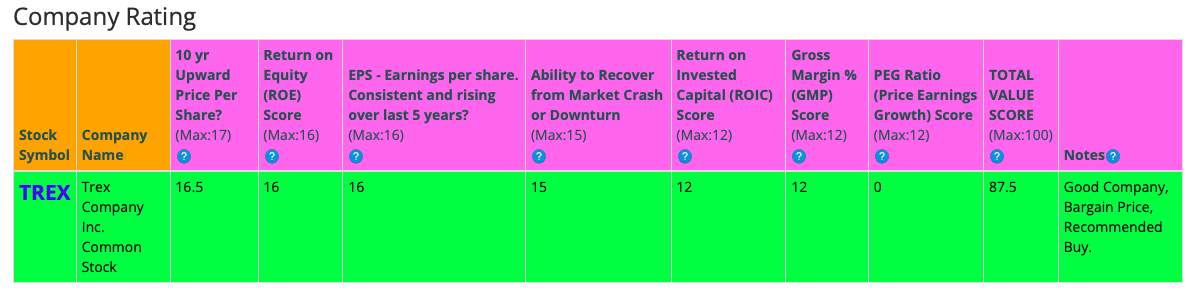
A fast way for me to get an overall understanding of the condition of the business is to use the BTMA Stock Analyzer’s company rating score. TREX has high scores for 10 Year Price Per Share, ROE, Earnings per share, Ability to Recover from a Market Crash or Downturn, ROIC, and Gross Margin Percent. It has low scores for PEG Ratio. A low PEG Ratio score indicates that the company may not be experiencing high growth consistently over the past 5 years. In summary, these findings show us that TREX seems to have above average fundamentals since all but one of categories produce good scores.
Before jumping to conclusions, we’ll have to look closer into individual categories to see what’s going on.
(Source: BTMA Stock Analyzer )
Fundamentals
Let’s examine the price per share history first. In the chart below, we can see that price per share has been mostly consistent at increasing over the last 10 years, with only one year where share price declined. It is worth noting that decline in 2022 came after a nearly 70% surge in 2021. Overall, share price average has grown by about 984.20% over the past 10 years or a Compound Annual Growth Rate of 30.32%. This is a very good return.
BTMA Stock Analyzer
(Source: BTMA Stock Analyzer – Price Per Share History)
Earnings
Looking closer at earnings history, we see that earnings have consistently grown over the past 10 years, with not a single year of earnings declines. This is not an easy feat to achieve.
Trex is the world’s largest manufacturer of composite decking and railing products, and its earnings story mirrors that of companies who benefited from COVID-19 lockdowns and the benefits of consumers spending more time at home. Home improvement was one category that outperformed during the pandemic as people invested more in their homes and outdoor spaces. The impacts of COVID-19 also coincided with a longer-term trend of composite building materials taking over more market share from traditional wood products used to manufacture decks. While the two trends had positive lift for Trex, as the pandemic wanes it is expected that home improvement spending will decline. A secondary threat faces Trex as increasing mortgage interest rates could slow new home sales.
Consistent earnings make it easier to accurately estimate the future growth and value of the company. So, in this regard, TREX is a good example of a stock to accurately estimate future growth or current value.
BTMA Stock Analyzer
(Source: BTMA Stock Analyzer – EPS History)
Since earnings and price per share don’t always give the whole picture, it’s good to look at other factors like the gross margins, return on equity, and return on invested capital.
Return on Equity
The return on equity has consistently decreased in the period from 2017 to 2021. While ROE has decreased by more nearly 40% in the span of five years, average ROE is still far above expectations at around 40.22%. For return on equity ((ROE)), I look for a 5-year average of 16% or more. So, TREX easily meet my requirements.
BTMA Stock Analyzer
(Source: BTMA Stock Analyzer – ROE History)
Let’s compare the ROE of this company to its industry. The average ROE of 44 Building Products companies is 31.26%.
Therefore, TREX ’s 5-year average of 40.22% is well above average, and current ROE of 31.78 is average.
Return on Invested Capital
The return on invested capital has also been a consistent decliner from 2017 to 2021. ROIC fell nearly 28% during the period, but the five-year average ROIC is above expectations at around 38.74%. For return on invested capital ((ROIC)), I also look for a 5-year average of 16% or more. So, TREX passes this test as well.
BTMA Stock Analyzer
(Source: BTMA Stock Analyzer – Return on Invested Capital History)
Gross Margin Percent
The gross margin percent ((GMP)) has mostly decreased over the last five years. GMP grew in 2018, but then fell 2019, 2020, and 2021. Even with the declines, overall gross margin percent is at very high levels. Five-year GMP is good at around 41.32%. I typically look for companies with gross margin percent consistently above 30%. So, TREX has proven that it has the ability to maintain acceptable margins over a long period.
BTMA Stock Analyzer
(Source: BTMA Stock Analyzer – Gross Margin Percent History)
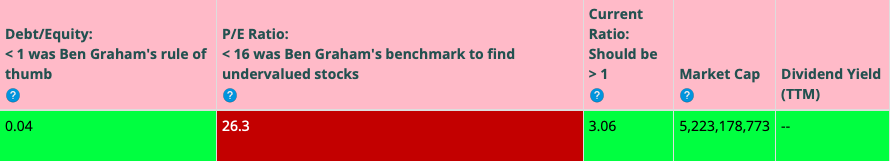
Looking at other fundamentals involving the balance sheet , we can see that the debt-to-equity is less than 1. This is a positive indicator, telling us that the company owns more than it owes.
TREX’s Current Ratio of 3.06 is satisfactory, indicating it has an adequate ability to use its assets to pay its short-term debt.
Ideally, we’d want to see a Current Ratio of more than 1, so TREX exceeds this amount.
According to the balance sheet, the company appears to be in good financial health. In the long term, the company has more than enough assets to cover its debts. In the short-term the company is generating enough cash flow, to fulfill its obligations.
The Price-Earnings Ratio of 26.3 indicates that TREX might be selling at a high price when comparing TREX’s P/E Ratio to a long-term market average P/E Ratio of 15. The 5-year average P/E Ratio of TREX has typically been about 29.8, so this indicates that TREX could be currently trading at a low price when comparing to TREX’s average historical P/E Ratio range.
TREX does not currently pay a regular dividend.
(Source: BTMA Stock Analyzer – Misc. Fundamentals)
This analysis wouldn’t be complete without considering the value of the company vs. share price.
Value Vs. Price
For valuation purposes, I will be using a conservative diluted EPS of 1.80. I’ve used various past averages of growth rates and P/E Ratios to calculate different scenarios of valuation ranges from low to average values. The valuations compare growth rates of EPS, Book Value, and Total Equity.
In the table below, you can see the different scenarios, and in the chart, you will see vertical valuation lines that correspond to the table valuation ranges. The dots on the lines represent the current stock price. If the dot is towards the bottom of the valuation range, this would indicate that the stock is undervalued. If the dot is near the top of the valuation line, this would show an overvalued stock.
BTMA Wealth Builders Club BTMA Wealth Builders Club
(Source: BTMA Wealth Builders Club )
According to this valuation analysis, TREX is undervalued.
- If TREX continues with a growth average similar to its past 10 years earnings growth, then the stock is overpriced at this time.
- If TREX continues with a growth average similar to its past 5 years earnings growth, then the stock is undervalued at this time.
- If TREX continues with a growth average similar to its past 10 years book value growth, then the stock is overpriced at this time.
- If TREX continues with a growth average similar to its past 5 years book value growth, then the stock is undervalued at this time.
- If TREX continues with a growth average similar to its past 5 years total equity growth, then the stock is undervalued at this time.
- According to TREX’s typical P/E ratio relation to the S&P 500's P/E Ratio, TREX is undervalued.
- If TREX continues with a growth average as forecasted by analysts, then the stock is overpriced.
This analysis shows an average valuation of around $49 per share versus its current price of about $47.50, this would indicate that Trex Company is slightly undervalued.
Summarizing the Fundamentals
According to the facts, Trex Company is financially healthy in a long-term sense in having enough equity as compared with debt, and in the short-term because the current ratio indicates that it has plenty of cash to cover current liabilities.
This company has an impressive earnings record, which shows consistent and improving earnings over a 10-year period.
Other fundamentals are at excellent levels, including ROE, ROIC, and Gross Margins. The only downside of the fundamentals is that ROE, ROIC, and Gross Margins have been decreasing over the past 5 years. One reason could be a result of building materials becoming more expensive and cutting into margins. Another consideration is that Trex composite decking material has become more popular and the company has grown its market share over the years. Therefore, as more of the newer homes over the past decade have been built with composite decking material, there is less need for these households to replace the decking. Also, many older homes with traditional wood decking have already been replaced with Trex or other composite decking material. This may have also reduced the need of deck replacement frequency. In terms of replacement frequency, traditional wood decking usually needs replaced every 10 to 15 years, whereas Trex decking can last for 25 to 30 years.
In terms of valuation, my analysis shows that the stock is slightly undervalued.
Now, let’s see how TREX compares versus the U.S. stock market benchmark S&P 500 over the past 10 years. From the chart below, we can see that TREX has easily outperformed the general market. TREX is clearly a high growth stock that continues to be in a growing industry (home improvement). After the surge from COVID, Trex stock has fallen back to more normalized levels, but it seems like it’s back on trajectory to continue growth moving forward.
Forward-Looking Conclusion
Over the next five years, the analysts that follow this company are expecting it to grow earnings at an average annual rate of 17.7%. In addition, the average one-year price target for this stock is at $63.62, which is about a 34% increase in a year.
If you invest today, with analysts’ forecasts, you might expect about 10% (low growth) to 17.7% (average growth) per year.
Here is an alternative scenario based on TREX’s past earnings growth. During the past 10 and 5-year periods, the average EPS growth rate was about 21% and 17%, respectively.
But when considering cash flow growth over the past 10 and 5 years, the average growth has been 13% and 16 %, respectively. Therefore, when considering all of these return possibilities, our average annual return could likely be around 15%-17%.
If considering actual past results of Trex Company, the story is a bit different. Here are the actual 10 and 5-year return results.
______________
10 Year Return Results if Invested in TREX:
Initial Investment Date: 8/31/2012
End Date: 8/31/2022
Cost per Share: $3.75
End Date Price: $47.43
Total Return: 1164.80%
Compound Annualized Growth Rate: 29%
_______________
5 Year Return Results if Invested in TREX:
Initial Investment Date: 8/31/2017
End Date: 8/31/2022
Cost per Share: $19.28
End Date Price: $47.43
Total Return: 146.01%
Compound Annualized Growth Rate: 20%
_________________
From these scenarios, we have produced results from 20% to 29%. I feel that if you’re a long-term patient investor and believer in TREX, and its existing products (composite building materials), you could expect TREX to provide you with around at least 15-17% annual return over the long haul. But for the short-term swing trader or impatient investor, the near future of Trex, might show some volatility as inflation, supply bottlenecks, and rising interest rates could affect the housing and home improvement industries.
As a comparison, the S&P 500’s average return from 1928 – 2014 is about 10%. So, in a typical scenario with TREX, you could expect to earn a much higher long-term return as compared with an S&P 500 index fund. The individual Trex stock obviously doesn’t offer the diversification that the index fund does, but Trex has proven that it is a consistent performer over the long run.
For me, the choice is certain. I would take an objective look at this company and realize that Trex Company is a chance to own a solid company with excellent long-term fundamentals. The company is within an ever-popular industry, since Americans are seemingly obsessed with home improvements and especially with adding more outdoor space to their properties. I don’t see this trend ending anytime soon.
Additionally, the company’s products provide real value with customers since their composite building materials tend to last 1.5 to 2 times longer than traditional wood materials.
If I can buy Trex stock at a bargain price (which it’s at now), then I’d be glad to own this high-growth, fundamentally sound company that continues to build on American’s love of home improvement.
For further details see:
Trex Company Is Still Full Of Value