VICI - Trick Or Treat My Favorite REITs
2023-10-19 07:00:00 ET
Summary
- REITs are down right now. I get how that would spook so many of you.
- We believe that real estate investment trusts are undervalued. We present three REITs that are potential investment opportunities.
- The recommended REITs include Realty Income, Agree Realty, and VICI Properties, all of which have strong financials and attractive dividend yields.
“We’ve got spirits. Yes, we do,” declares a Condé Nast piece from Oct. 5, prompting a resounding:
“iREIT’s got spirits! How ‘bout you?” from me.
By that, I mean I’ve got definite treats to tell you about today. Though I know Condé Nast means something very different considering its title: “ These Are the Most Haunted Places in the U.S. ”
Whauuuuuuuuuh! Whooooooooooh!
“We know the United States as the land of spacious skies and amber waves of grain, but it’s also the land of ghosts. In the most haunted places in America, lingering spirits roam through the halls of hotels, abandoned asylums, Broadway theaters, and even a city zoo.
If you want to get up close and personal with the paranormal, many of these sites offer guided tours through the spookiest of spaces – as well as overnight stays in the most haunted rooms in some of these hotels. (That’s one way to capitalize on spirits stuck on our plane of existence, at least.)
“If ghosts aren’t your go-to travel buddies, fear not. Many of the below sites and the destinations where they are found offer enough culture, history, architectural wonders, and beautiful scenery to keep you firmly planted in this realm. Just be sure not to provoke the spirits as you go about your journeys.”
Personally, I think I fit into that latter category, not because I have anything against a good scare or two. It’s more that I don’t have time for them.
Not when there are so many real estate investment trusts, or REITs, ripe for the picking!
Some of the Scariest Places the U.S. Apparently Has to Offer
Before we get to those tasty, tasty, treats, let’s talk about the list of tricks – some of which I’m sure you already know about.
It’s a pretty long article, so I don’t know how many places are listed. I do know it’s not one per state though. A quick search through it shows no results for either North Dakota or South Dakota, but two for Pennsylvania:
- The Gettysburg Battlefield, the site of one of America’s bloodiest military clashes. Around 50,000 men died from the three-day fight… so many that many were never properly buried. Some of their ghosts are said to roam the place ever since.
- Eastern State Penitentiary in Philadelphia, a “castle-like” prison-turned-tourist-attraction built in 1829 that “took solitary confinement to new levels.” Prisoners apparently “lived alone, exercised alone, and ate alone; when an inmate left his cell, a guard would cover his head with a hood so he couldn’t see or be seen.”
Can’t imagine why either place would be haunted.
There’s also two in Massachusetts:
- The House of the Seven Gables in Salem. Yup. That Salem. “Aside from being the site of those famous witch trials,” it “also happens to be the birthplace of Nathaniel Hawthorne, who used this 17th Century house as inspiration for his famous 1851 novel, The House of the Seven Gables .” Staff members swear it’s filled with ghosts and other paranormal activity.
- The Lizzie Borden Bed & Breakfast in Fall River, where the woman who inspired the lodging was accused of murdering her father and stepmother in 1892. While she was later acquitted of the axe-wielding accusations, her story inspired quite a lot of activity afterward, from town gossip to alleged apparitions to what I’m sure is a very lucrative business being run to this day.
Some people just love the macabre.
Not So Scary After All (at Least in Comparison)
Did I freak you out with those descriptions?
Probably not.
I didn’t give nearly enough details to make for a proper Halloween-style fright.
Besides, there’s just too much in-your-physical-face stuff to be concerned and even terrified of these days.
I won’t go into detail about the worst of them. I’m sure you know what I’m talking about without me having to get specific. I’ll stick with the stock market stuff since this is a stock market resource that I – believe it or not – work very hard to keep as straight-forward and apolitical as possible.
I have my opinions, of course. But I want the best for my followers regardless. That’s why I work so hard to move past the noise and present the most well-researched facts I can.
Look, I get that REITs are down right now. I also get how that would spook so many of you. I’ve read your comments, and I don’t blame you for feeling the way you do.
I just can’t share in that scared assessment.
If you’ve read any number of my recent articles, you know I believe REITs are exceptionally undervalued this year. Between misconceptions about their relationship with interest rates…
Misconceptions about how similar they are with bonds (they’re not nearly as similar as some say they are)…
And unfortunate examples of distress in the larger commercial real estate world…
Their share prices have been hammered.
In a few cases, yeah, I get it. It’s deserved. I’m sure I’ll address them in another soon-to-be holiday-themed article.
But overall?
Overall, the REIT field is ripe for the picking. Think about the best ever Halloween haul you ever had as a kid.
That’s what I’m seeing today, starting with the following three sweet-treat REITs.
No Tricks - Just Dividend Treats
Realty Income ( O )
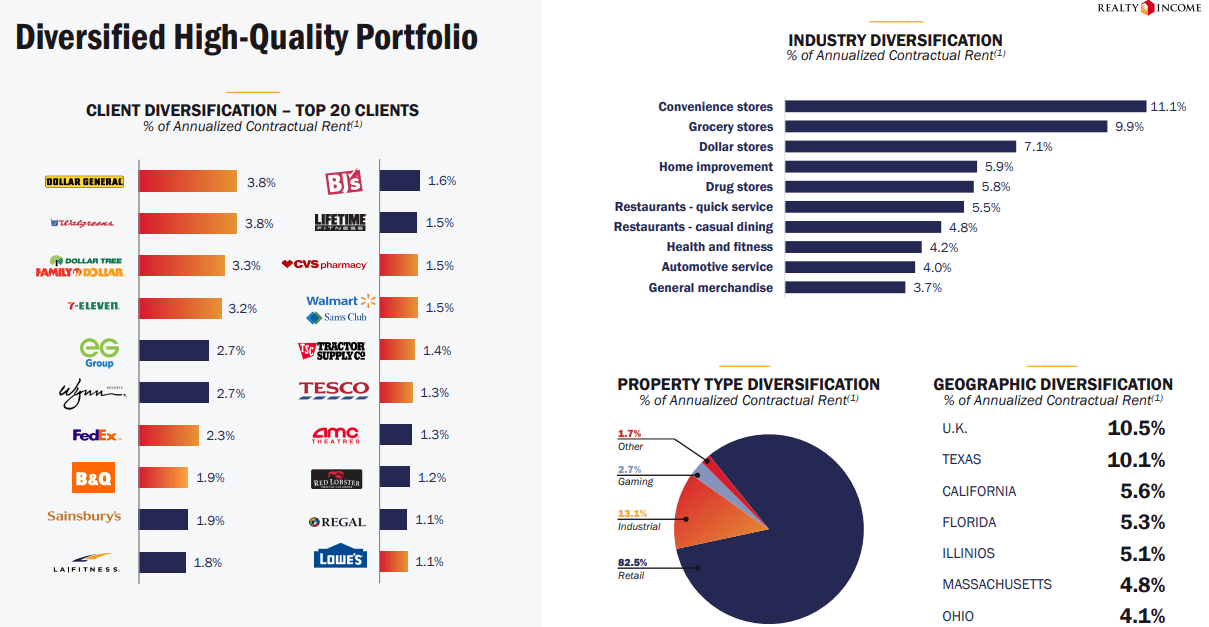
Realty Income has a diverse revenue stream with a portfolio of more than 13,000 commercial properties that are primarily single-tenant, free-standing buildings which are leased on a long term, triple-net basis to over 1,300 tenants operating in 85 industries.
Realty Income primarily targets commercial retail properties that make up 82.5% of their portfolio, followed by industrial properties that make up 13.1%, and gaming properties that make up 2.7% of their portfolio as of the end of the second quarter.
Gaming properties as an overall percentage of their portfolio will increase as the company acquired a 21.9% indirect interest in the Bellagio Las Vegas through a joint venture with Blackstone Real Estate Income Trust (“BREIT”) subsequent to the end of the second quarter.
While the majority of their portfolio consists of retail properties, Realty Income focuses on retail industries that are insulated from the threat of e-commerce such as convenience stores, grocery stores, and dollar stores.
As of the end of the second quarter, Realty Income’s properties had a weighted average remaining lease term of roughly 9.6 years and a portfolio occupancy of 99.0%.
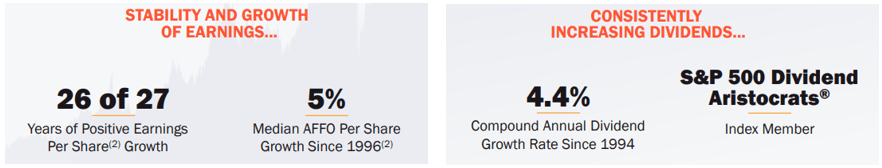
Realty Income is the epitome of consistency with 26 out of 27 years of positive adjusted funds from operations (“AFFO”) growth and a 5% median AFFO per share growth rate since 1996.
Additionally they're a S&P 500 Dividend Aristocrats member with 29 consecutive years of dividend increases and have delivered a 4.4% compound annual dividend growth rate since 1994.
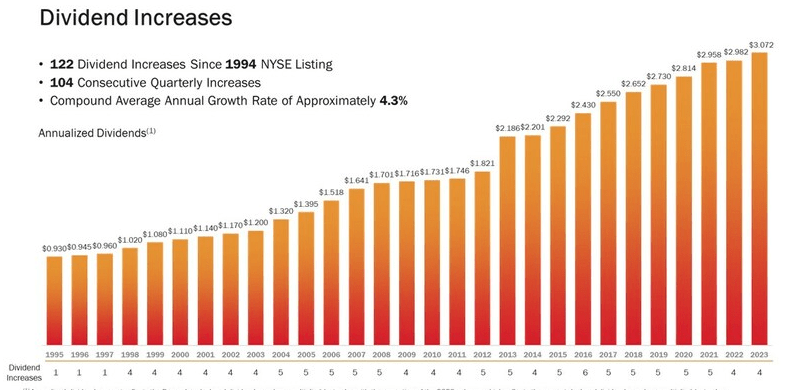
On Sept. 12 the company issued its 122nd monthly dividend increase since their public listing in 1994, and on Oct. 10, the company declared their 640th consecutive monthly dividend.
Along with their diverse revenue stream, Realty Income’s monthly dividend is supported by their investment-grade balance sheet and conservative AFFO dividend payout ratio.
The company has an A- credit rating from S&P Global and solid debt metrics, including a net debt to pro forma adjusted EBITDAre of 5.3x, a long-term debt to capital ratio of 40.64%, and a fixed charge coverage ratio of 4.6x.
Additionally, their dividend is well covered with a 2022 year-end AFFO payout ratio of 75.69% and an expected 2023 AFFO payout ratio of approximately 76%.
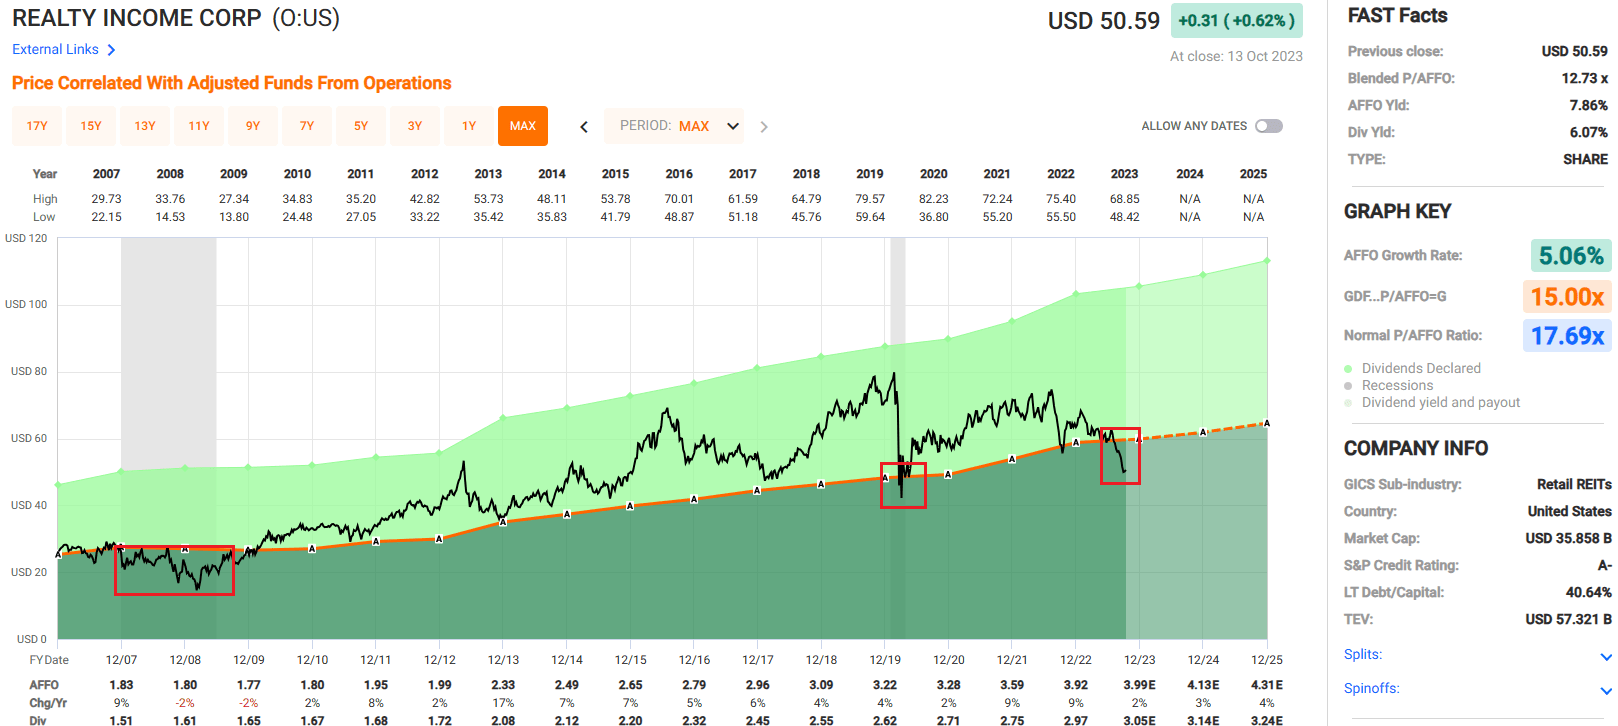
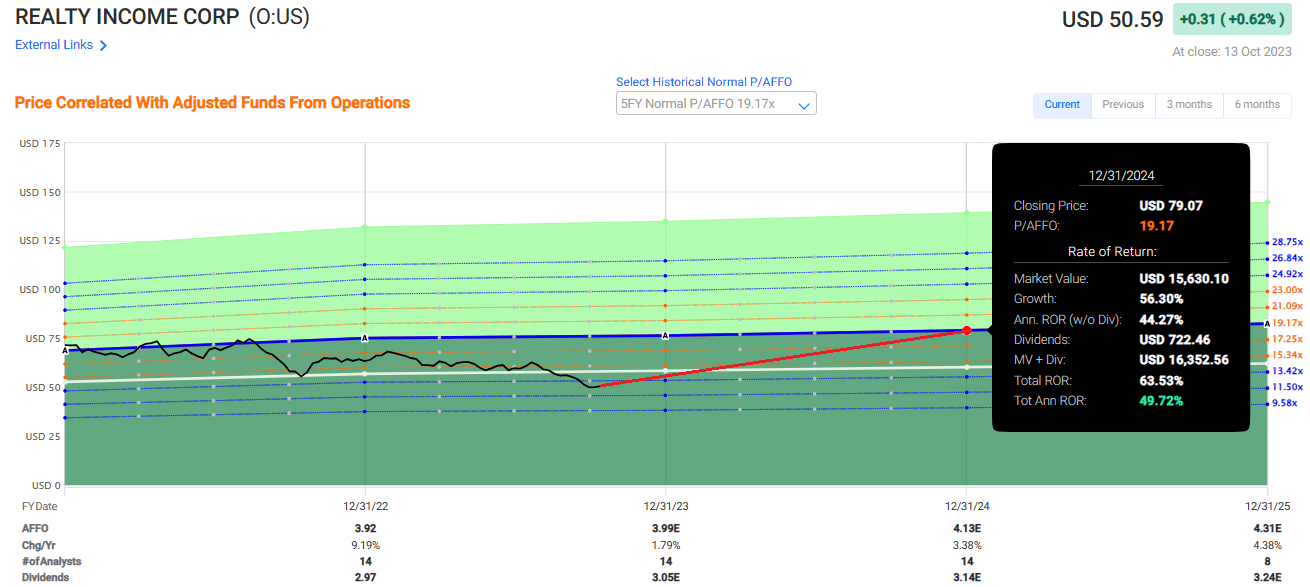
Since 2007 there has only been a couple of times when Realty Income’s stock has traded under 15 times their AFFO - the Great Financial Crisis of 2007-2009, the COVID crash in March of 2020, and right now. Currently the stock is trading at a P/AFFO of 12.73x which is a significant discount to their average AFFO multiple of 17.69x going all the way back to 2007.
While Realty Income has steadily increased their earnings and dividend per share the stock has sold off by almost 21% year-to-date.
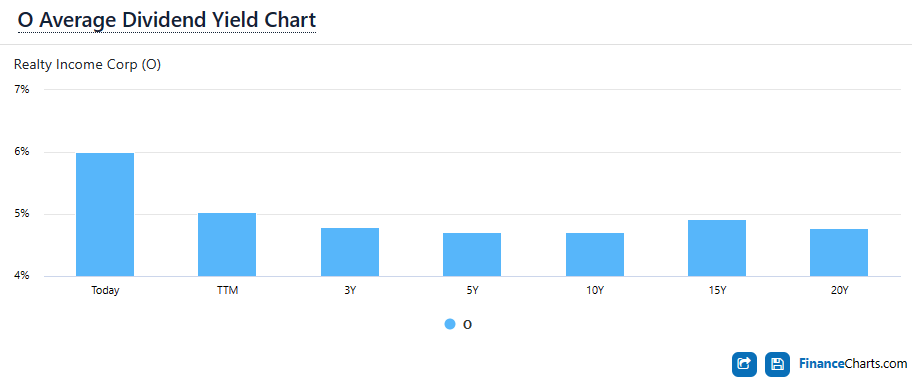
The sell-off, along with the REITs growing dividends, has pushed the stock’s dividend yield over 6.0%. The dividend now exceeds their three-year average of 4.79%, their five-year average of 4.70% and their 10-year average of 4.71%.
The stock price as it relates to their cash flow (AFFO) and their dividend yield is at a historically low valuation, which presents an attractive buying opportunity.
If Realty Income trades back up to an AFFO multiple of 15x by the end of 2024 it would result in a total annual rate of return of 23.65%, and if the stock trades back up to their five-year average AFFO multiple of 19.17x it would result in a total annual rate of return of 49.72% by the end of 2024.
We rate Realty Income a Strong Buy.
Agree Realty ( ADC )
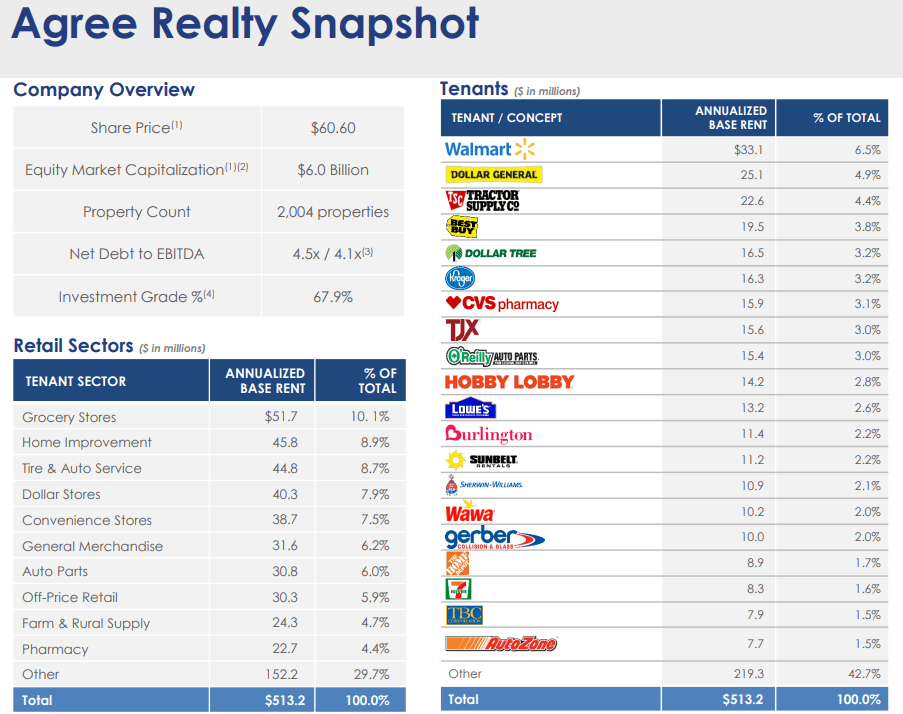
Agree Realty is a net-lease real estate investment trust (“REIT”) that was founded in 1971 and went public in 1994. The company specializes in the ownership, development, acquisition, and management of net-leased commercial retail properties. The portfolio includes more than 2,000 commercial properties located in 49 states that total approximately 41.7 million square feet of gross leasable space.
Almost 68% of ADC’s annualized base rent comes from investment-grade tenants or tenants with parent companies that are investment grade.
They have a very strong tenant roster with names like Walmart, Kroger, Tractor Supply, Lowe’s, Sherwin-Williams, and Home Depot listed among their top 20 tenants, and they target retail properties in industries that are resistant to e-commerce such as grocery stores, home improvement stores, and convenience stores.
As of the end of the second quarter, ADC’s portfolio was 99.7% leased with a weighted average remaining lease term of almost nine years.
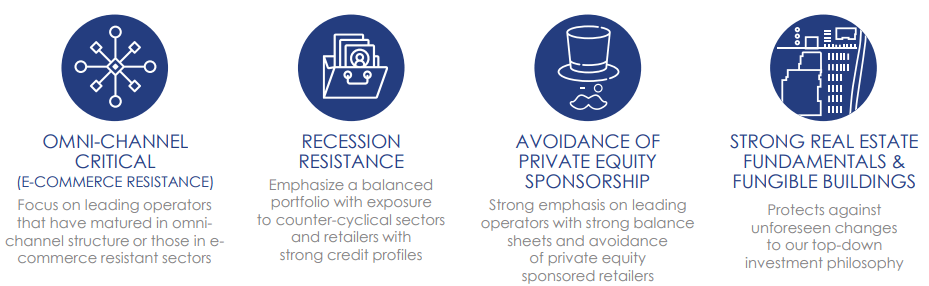
Agree Realty’s investment criteria focuses on four core principles including retail industries that are e-commerce resistant such as retailers with a mature omni-channel structure in place. They also attempt to balance the portfolio with properties used in counter-cyclical industries in order to mitigate the impact of a recession.
Additionally, ADC avoids private equity sponsored retailers and places a high emphasis on fungible property types. This last point is critical and runs contrary to some other net-lease REITs such as EPR Properties ( EPR ) which invests in many non-fungible properties such as eat and play facilities (TopGolf), ski resorts, amusement parks, and movie theaters.
To complement their four core investment principles, ADC is very selective in the properties they acquire. They have reviewed approximately $63 billion in opportunities since 2018 while only acquiring $6.2 billion over that time frame.
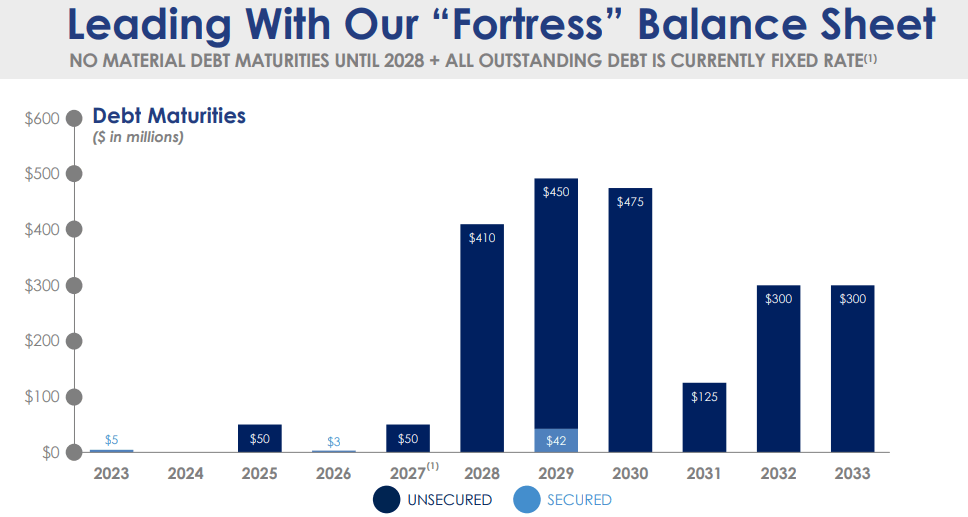
Agree Realty has an investment-grade balance sheet with a BBB credit rating and strong debt metrics including a net debt to recurring EBITDA of 4.5x, a long-term debt to capital ratio of 30.64%, and a fixed charge coverage ratio of 5.1x.
Additionally, all of the debt is fixed rate and they have no significant debt maturities until 2028.
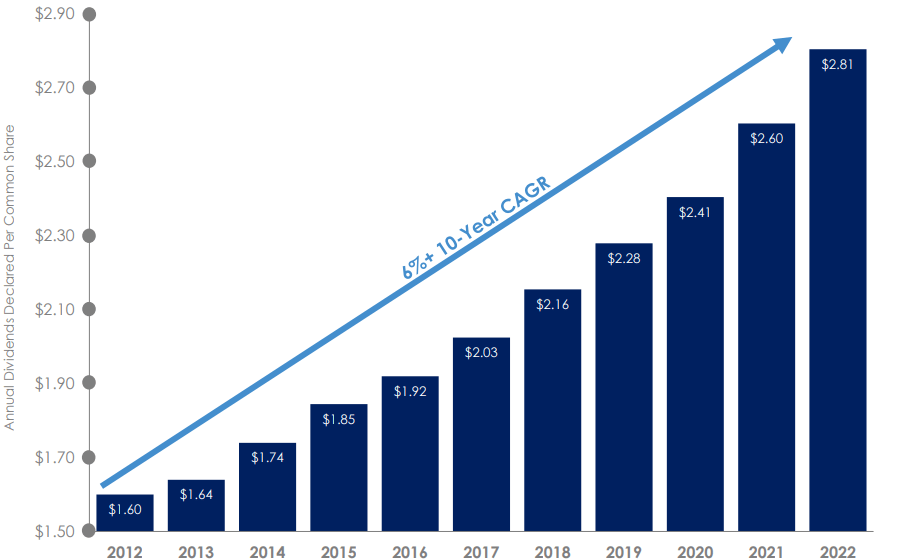
Agree Realty changed its dividend schedule in 2021 to move from a quarterly to a monthly dividend. From 1994 to 2020 they paid 107 consecutive quarterly dividends and have paid 33 consecutive monthly dividends since changing their dividend policy to a monthly payout.
ADC has increased its dividend each year since 2013 and has an average dividend growth rate of 5.79% over that time. Additionally, the dividend is safe with an average AFFO payout ratio of 76% over the last 10 years, a 2022 year-end AFFO payout ratio of 73.24%, and an expected 2023 AFFO payout ratio of approximately 74%.
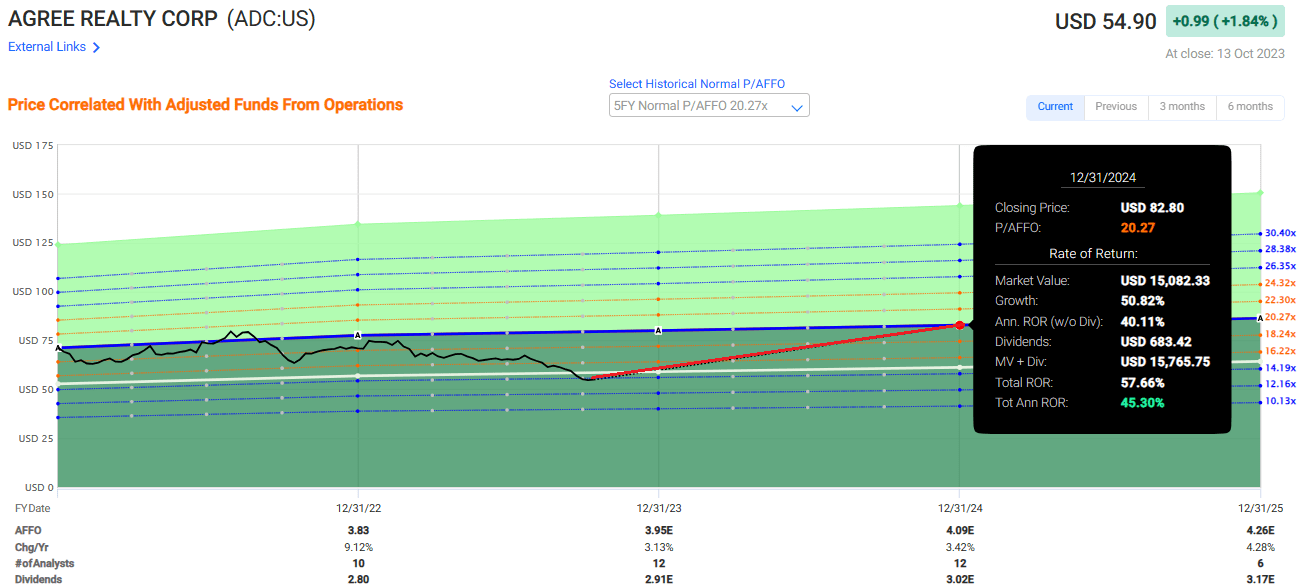
It’s been a while since we’ve seen ADC trade under 15 times the AFFO per share.
For the most part, the stock traded under 15 times between 2013 and 2015, but since 2015 the stock has traded well above an AFFO multiple of 15x. In fact, since 2013 ADC’s average AFFO multiple is 17.76x whereas it is currently trading at a P/AFFO of 13.99x.
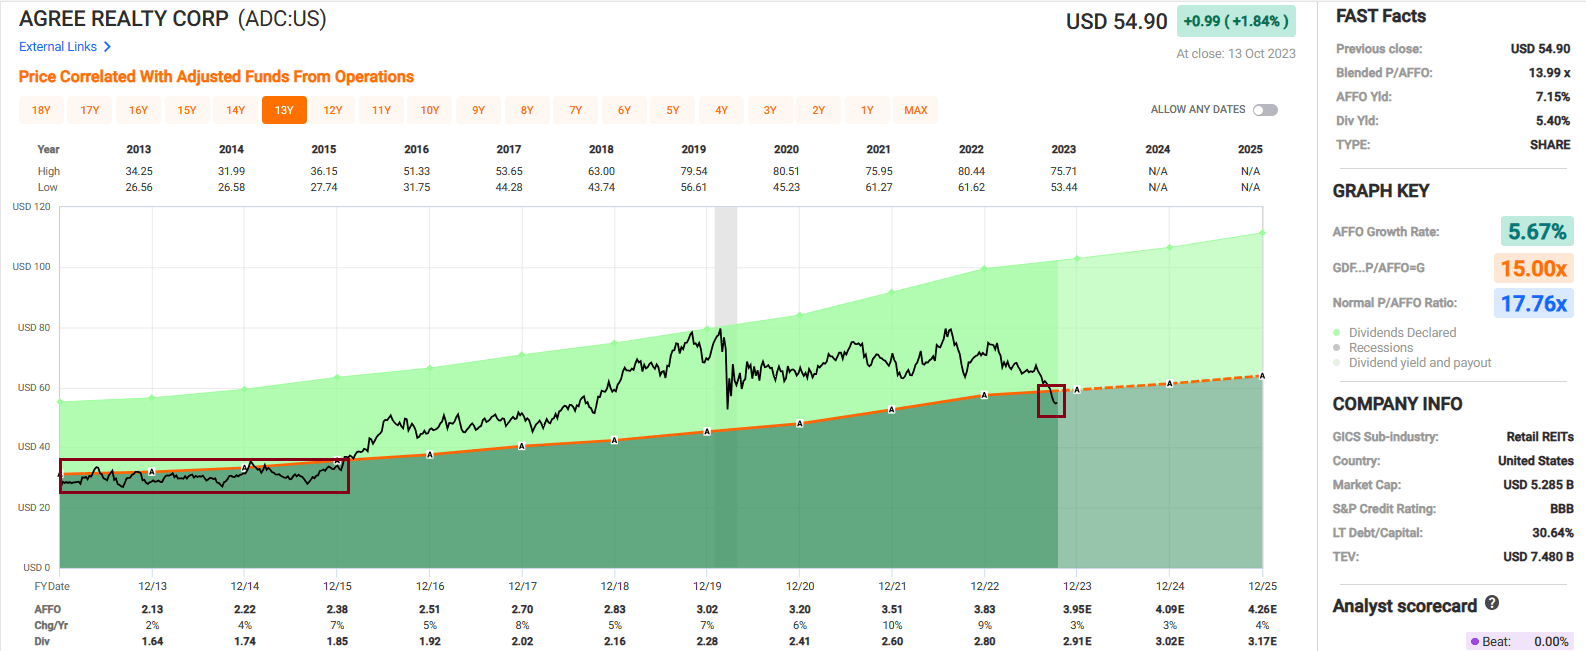
Like most other REITs, Agree Realty’s stock has suffered under the current regime of rising interest rates and its price has fallen almost 21% year-to-date.
The sell-off has pushed its dividend yield up to 5.40%, which is well above its three-year average yield of 4.30%, its five-year average yield of 4.15%, and its 10-year average yield of 4.25%.
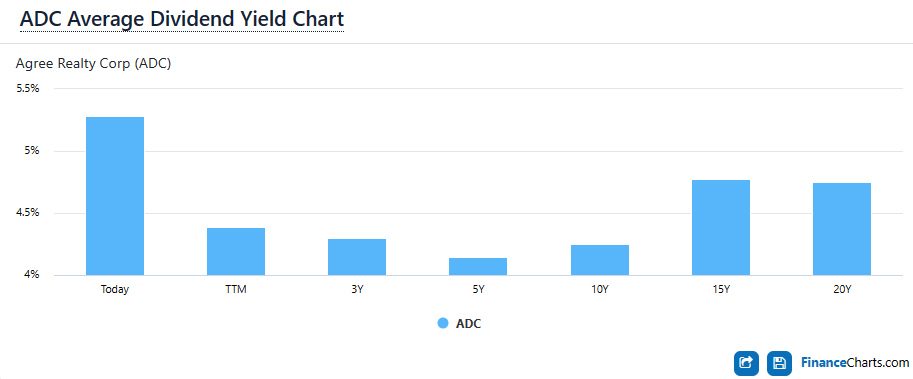
If Agree Realty trades back up to an AFFO multiple of 15 times by the end of 2024 it would result in a total annual rate of return of 14.90%, and if the stock trades back up to their five-year average AFFO multiple of 20.27x it would result in a total annual rate of return of 45.30% by the end of 2024.
We rate Agree Realty a Buy.
VICI Properties ( VICI )
VICI is a triple-net lease REIT that invests in experiential real estate and holds one of the largest portfolios of gaming, hospitality, and entertainment destinations.
Some of the more notable properties in their portfolio include the Venetian Resort Las Vegas, the MGM Grand, and Caesars Palace Las Vegas, which are all iconic trophy properties that cannot easily be replaced.
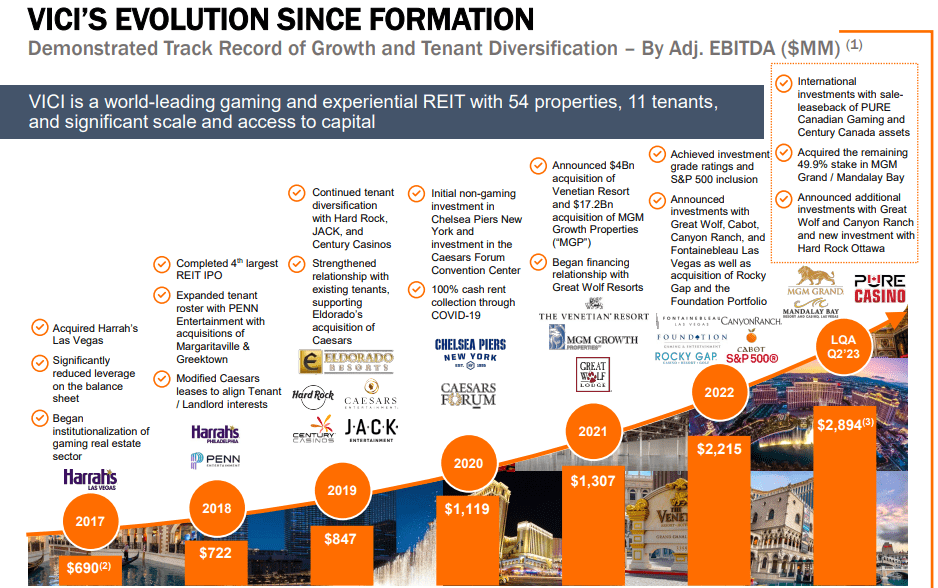
VICI has 54 gaming properties located in 15 states within the U.S. and one Canadian province. The 54 gaming properties cover approximately 124 million square feet and include more than 60,000 hotel rooms, around 500 retail outlets, and over 450 restaurants, sportsbooks, nightclubs, and bars.
Additionally, VICI owns four championship golf courses and approximately 33 acres of undeveloped or underdeveloped land next to the Las Vegas Strip.
VICI’s properties are leased on a long-term, triple-net basis to leading gaming and hospitality operators such as Caesars Entertainment, MGM Resorts, and PENN Entertainment.
They have 11 tenants but the vast majority of their cash rent is derived from their top two tenants: Caesars, which makes up 40% of their annual cash rent, and MGM Resorts, which makes up 36% of their annual cash rent.
While this level of tenant concentration would normally be concerning, as previously mentioned, many of VICI’s properties are iconic and are practically irreplaceable.
Additionally, when including all extension options, VICI’s top tenant Caesars has a weighted average lease term of 32.1 years, and their second-largest tenant, MGM Resorts, has a weighted average lease term of 51.8 years.
VICI - IR
VICI filed its initial public offering (“IPO”) in 2018 with annual adjusted EBITDA of $722.0 million. Since that time the company has grown to become one of the largest publicly traded net lease REITs with $2.2 billion in adjusted EBITDA as of the end of 2022 and a current market capitalization of approximately $29.7 billion.
Additionally, in 2022 the company achieved an investment-grade credit rating and was included in the S&P 500, making it possibly the fastest REIT to achieve these milestones in its short existence.
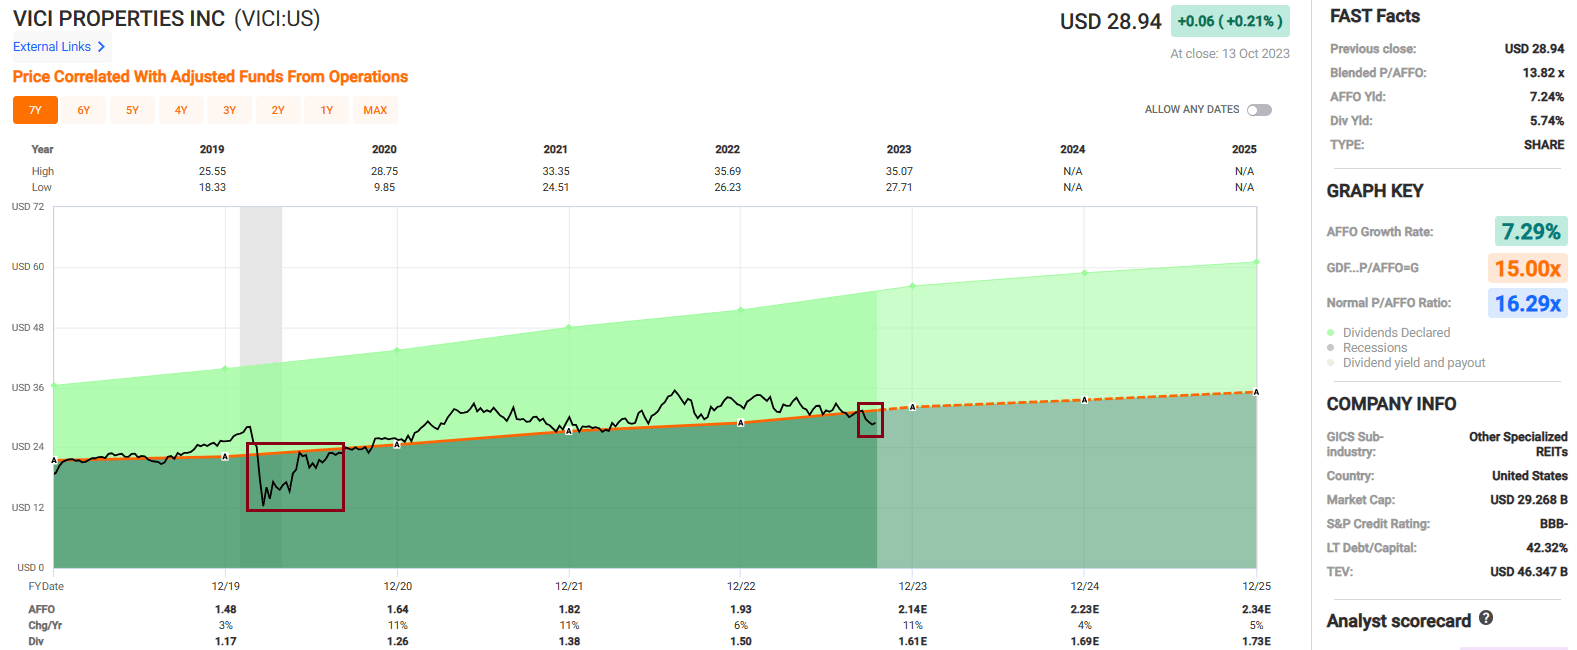
Since 2019 VICI has delivered a blended average AFFO growth rate of 7.29% and an average dividend growth rate of 10.80%. The stock pays a 5.74% dividend yield that is well covered with a 2022 year-end AFFO payout ratio of 77.72% and a 2023 expected AFFO payout ratio of approximately 75%.
As shown below, the stock has traded at or above 15 times their AFFO for the majority of the company’s existence with the exception of the COVID crash and right now. Currently VICI trades for a P/AFFO of 13.82x which is a discount compared to their normal AFFO multiple of 16.29x.
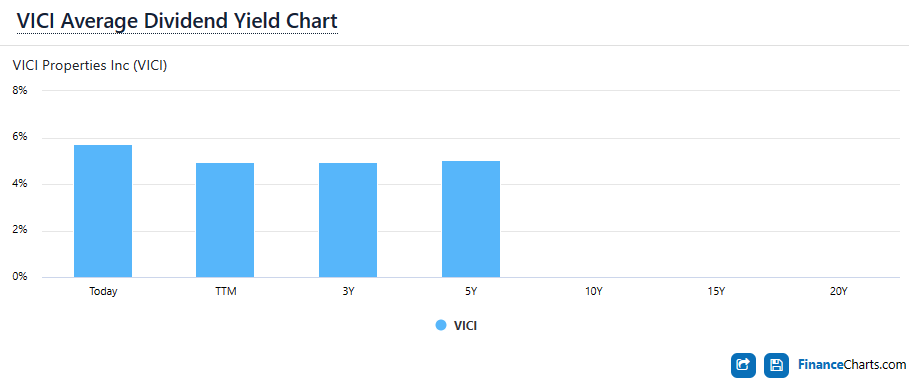
Similarly the stock is paying a higher dividend yield than its average with a current yield of 5.74% compared to its three-year average dividend yield of 4.93% and its five-year average dividend yield of 5.05%.
If VICI Properties trades up to an AFFO multiple of 15 times by the end of 2024 it would result in a total annual rate of return of 18.58%, and if the stock trades back up to their five-year average AFFO multiple of 16.54x it would result in a total annual rate of return of 27.89% by the end of 2024.
We rate VICI Properties a Buy.
Alexandria Real Estate ( ARE )
Since its founding in 1994, Alexandria Real Estate has been the pioneer and longest-running developer and owner of collaborative life science properties.
While ARE is classified as an office REIT, its properties are very different than traditional office buildings in that it specializes in building and leasing out laboratory space and research facilities that are used by top pharmaceutical firms, medical device makers, and institutional research centers.
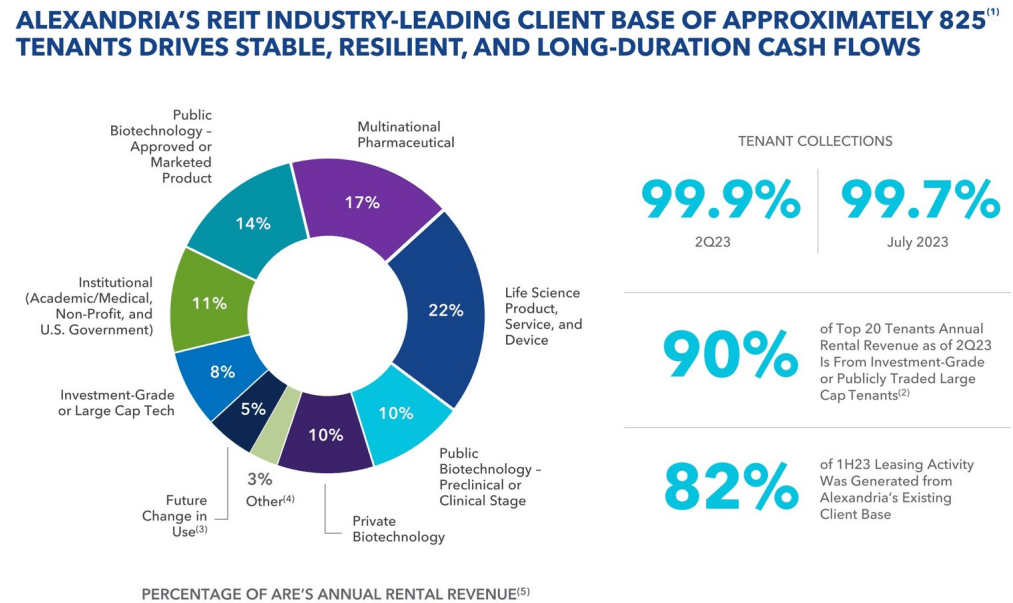
Alexandria has a high-quality tenant base of roughly 825 tenants and receives 49% of the rental revenue from investment-grade tenants or from large-cap, publicly-traded companies.
Their top 20 tenants includes many reputable companies and institutions such as Bristol-Myers Squibb, Moderna, Eli Lilly, Alphabet, Harvard University, Pfizer, and the Massachusetts Institute of Technology. Altogether, 16 out of their top 20 tenants have investment-grade credit ratings.
Additionally, ARE only receives 3.5% of their annual rental revenue from their largest tenant and only 31.4% of their annual rental revenue comes from their top 20 tenants combined.
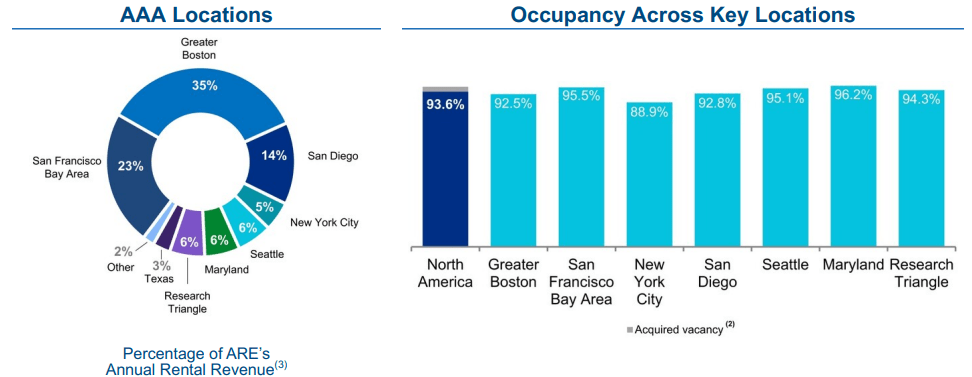
Alexandria develops and owns Class A/A+ life science properties in AAA innovation cluster locations which are primarily located in San Francisco, Boston, New York City, Seattle, San Diego, Maryland, and the Research Triangle.
ARE owns or has an ownership interest in an asset base in the U.S. of approximately 74.9 million square feet which consists of 41.1 million rentable square feet (“RSF”) of operating properties, 14.7 million RSF of properties under construction or in development, and 19.1 million square feet set aside for future development.
As of the most recent update, ARE has a 93.6% occupancy rate for its operating properties in North America with a weighted average lease term of 7.2 years.
Office REITs have sold off significantly over the past two years due to concerns over future demand for office space.
As previously mentioned, ARE is anything but your traditional office REIT due to the focus on lab space where work cannot be done from home.
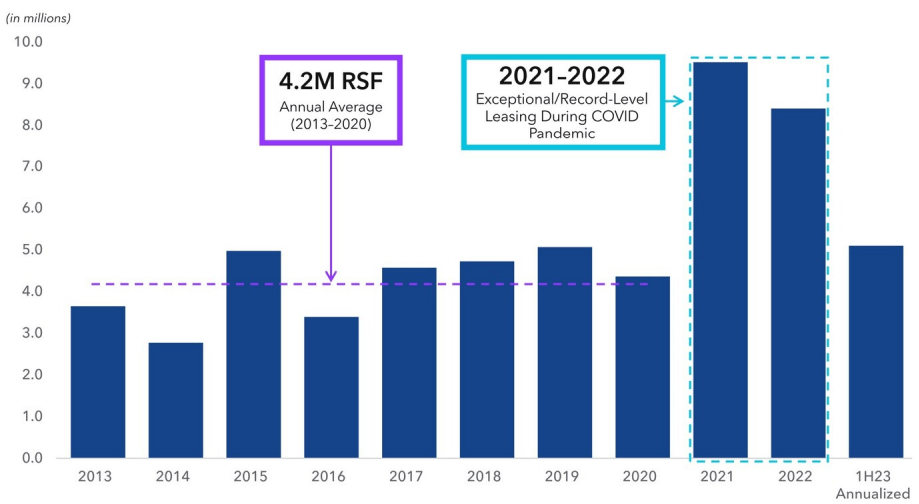
Their 1H23 annualized leasing volume of 5.1 million RSF reflect continued healthy demand for ARE’s properties and the levels are in line with their pre-COVID leasing volumes.
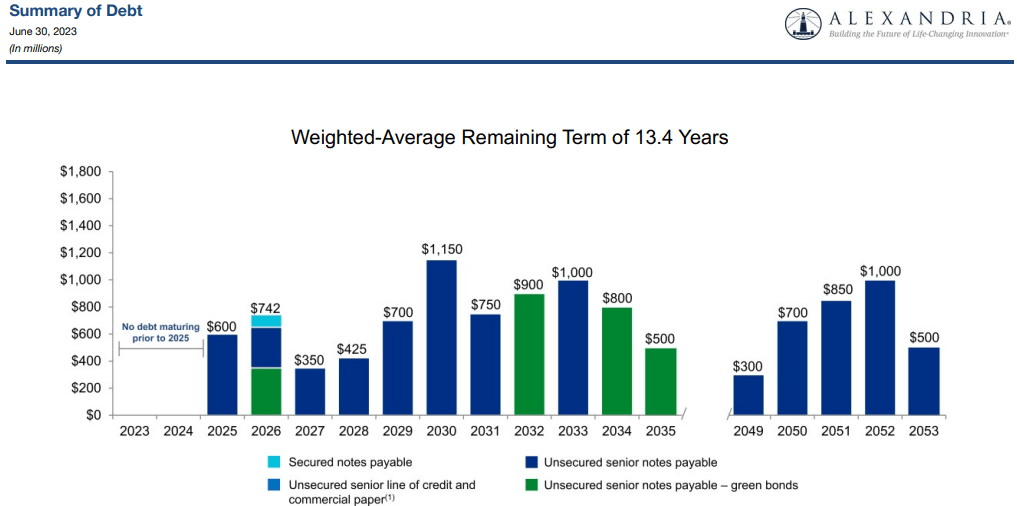
Alexandria has a BBB+ credit rating and excellent debt metrics including a net debt and preferred stock to adjusted EBITDA of 5.2x, a long-term debt to capital ratio of 38.85%, and a fixed charge coverage ratio of 4.7x.
Practically all of the debt is fixed rate (99.2%) and has a weighted average interest rate of 3.69% with a weighted average remaining term of 13.4 years. Additionally, ARE has no debt maturities until 2025 and had $6.3 billion in liquidity as of June 30.
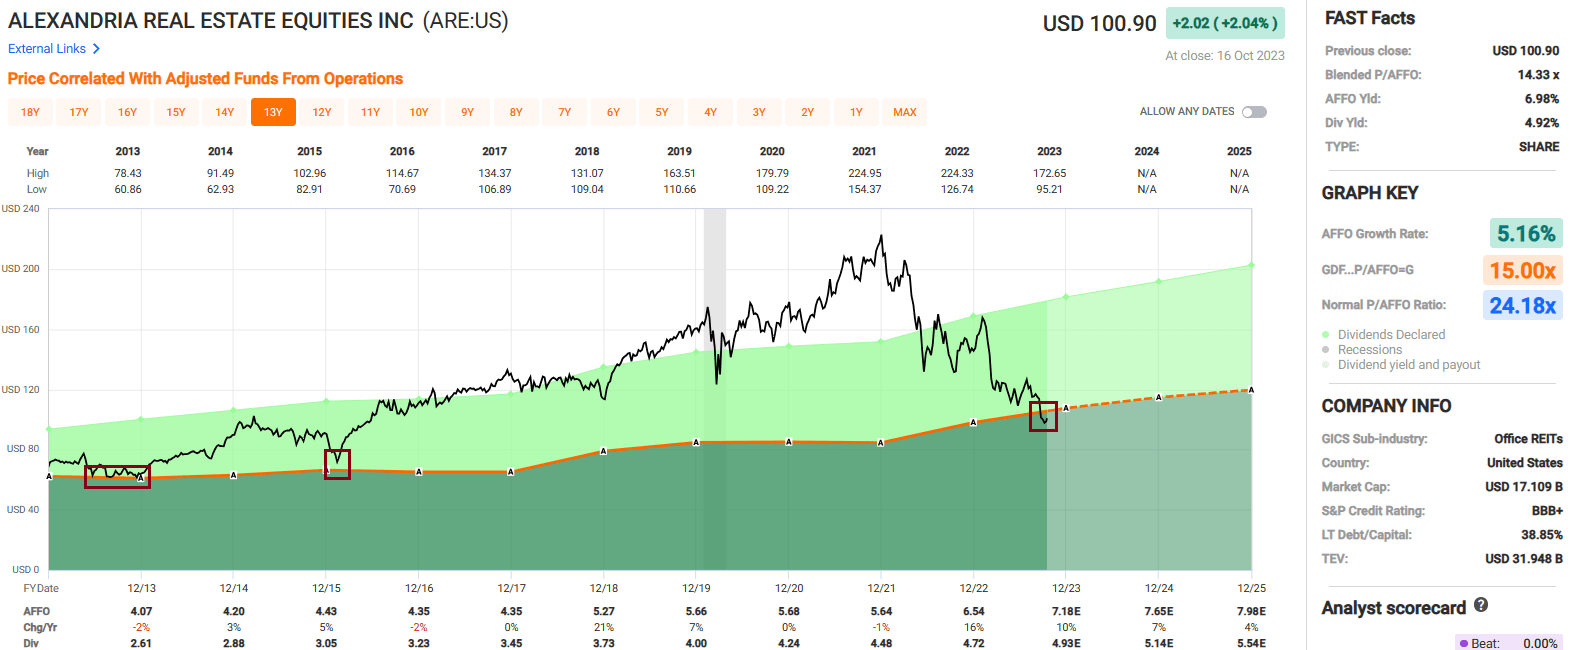
Over the last decade there have been very few times when ARE’s stock has traded below 15 times their AFFO per share.
The stock bounced around that valuation for most of 2013 and came close to an AFFO multiple of 15x in 2015, but as it relates to their earnings / AFFO the stock is currently trading at its lowest valuation in the last 10 years.
This is all while analysts expect AFFO per share growth of 10% in 2023 and 7% in 2024. Over the past 10 years ARE has had an average AFFO growth rate of 5.16% and an average dividend growth rate of 8.62%. The stock currently pays a 4.92% dividend yield that's well covered with a 2022 year-end AFFO payout ratio of 72.17% and an expected 2023 AFFO payout ratio of approximately 69%.
In terms of valuation, ARE’s stock currently trades at a P/AFFO of 14.33x which is a significant discount compared to their 10-year average AFFO multiple of 24.18x.
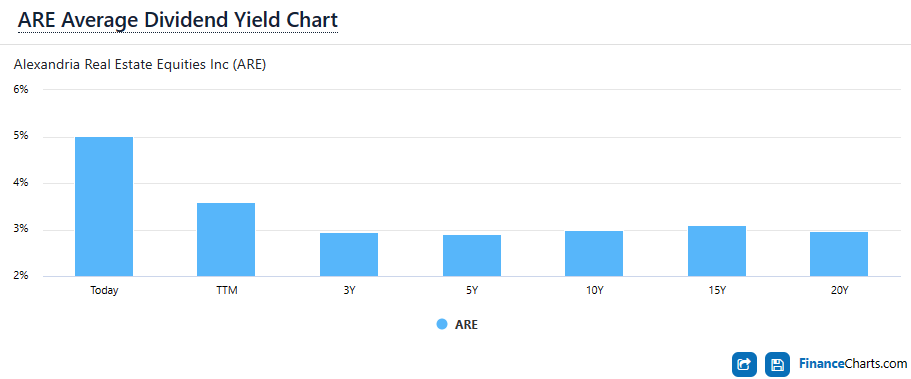
Likewise, ARE is trading at a historically low valuation as it relates to the dividend.
Currently the stock yields 4.92% compared to their three-year average yield of 2.95%, their five-year average yield of 2.91%, and the 10-year average yield of 2.99%.
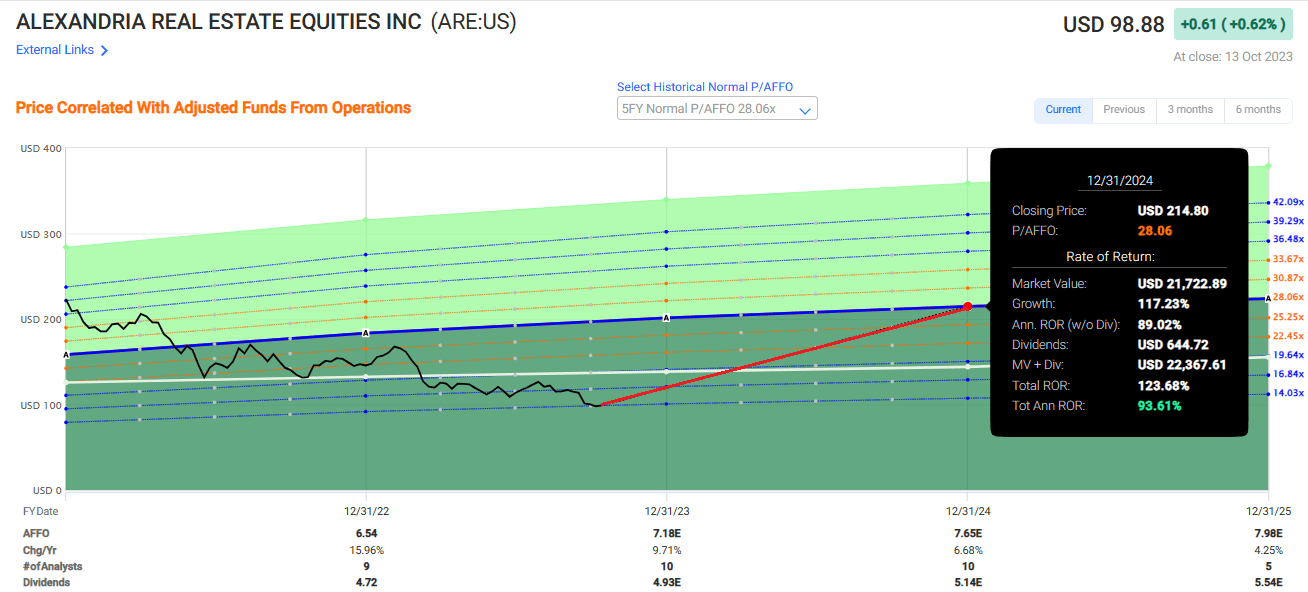
If Alexandria trades back up to an AFFO multiple of 15x by the end of 2024 it would result in a total annual rate of return of 16.34%, and if the stock trades back up to the five-year average AFFO multiple of 28.06x it would result in a total annual rate of return of 93.61% by the end of 2024.
We rate Alexandria Real Estate a Strong Buy.
Mid-America Apartment ( MAA )
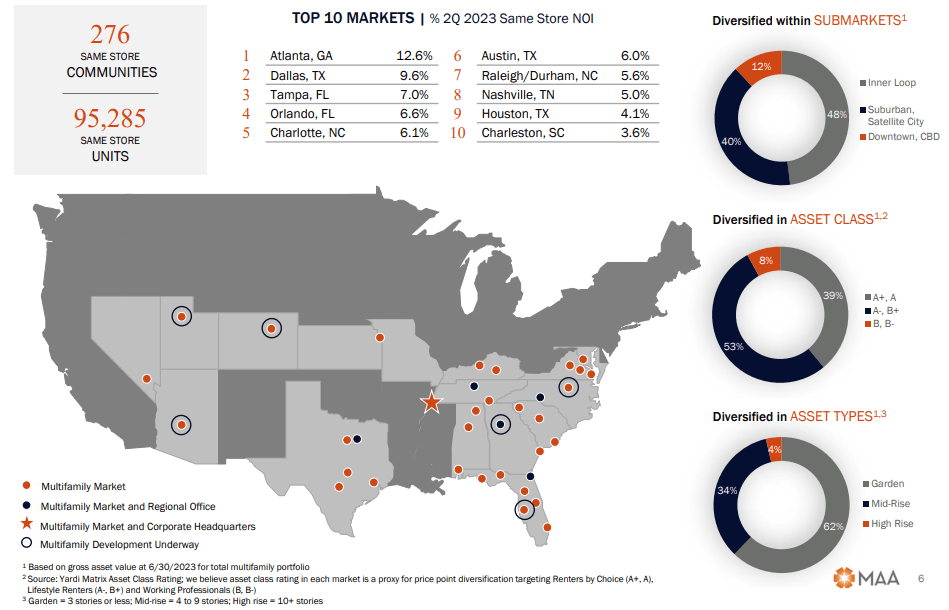
Mid-America is a sunbelt-focused multifamily REIT that owns or has an ownership interest in 101,986 apartment homes located in 16 states and the District of Columbia. Their multifamily communities are spread across the sunbelt region of the country with a particularly strong presence in the Southeast and Texas.
One thing to note is that even though MAA looks to develop and own multifamily communities in the sunbelt, they have no investments or exposure in California. Based on Same Store net operating income (“NOI”), MAA’s top five markets are Atlanta (12.6%), Dallas (9.6%), Tampa (7.0%), Orlando (6.6%) and Charlotte (6.1%).
The majority of MAA’s multifamily communities are garden style (three stories or less) which makes up 62% of their portfolio, followed by mid-rise (four to nine stories) which makes up 34%, and high-rise (10+ stories) which makes up 4% of their portfolio.
As of their most recent update, MAA reported an average physical occupancy rate of 95.5%.
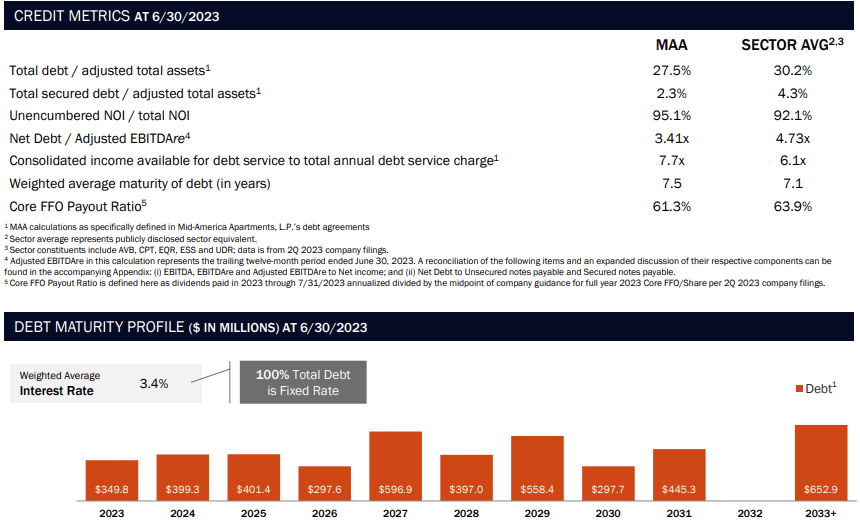
MAA has an investment-grade balance sheet with an A- credit rating from S&P Global.
The REIT has excellent debt metrics including a net debt to adjusted EBITDAre of 3.41x, a total debt to adjusted total assets ratio of 27.5%, and an EBITDA to interest expense ratio of 8.23x.
Additionally, all of the debt is fixed rate with a weighted average interest rate of 3.4% and a weighted average term to maturity of 7.5 years.
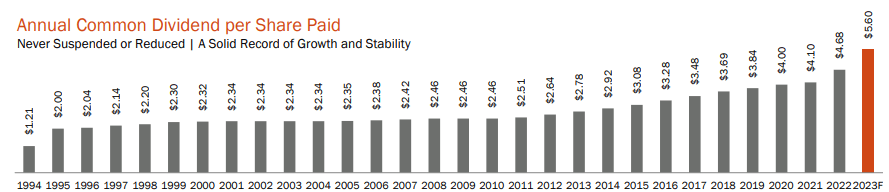
Mid-America has an excellent dividend track record with consecutive quarterly dividends paid since 1994. While MAA has not increased the dividend each year, they have never suspended or reduced the dividend either.
Currently MAA pays a 4.26% dividend yield that is well-covered with a 2022 year-end AFFO payout ratio of 60.95% and an expected 2023 AFFO payout ratio of approximately 68%.
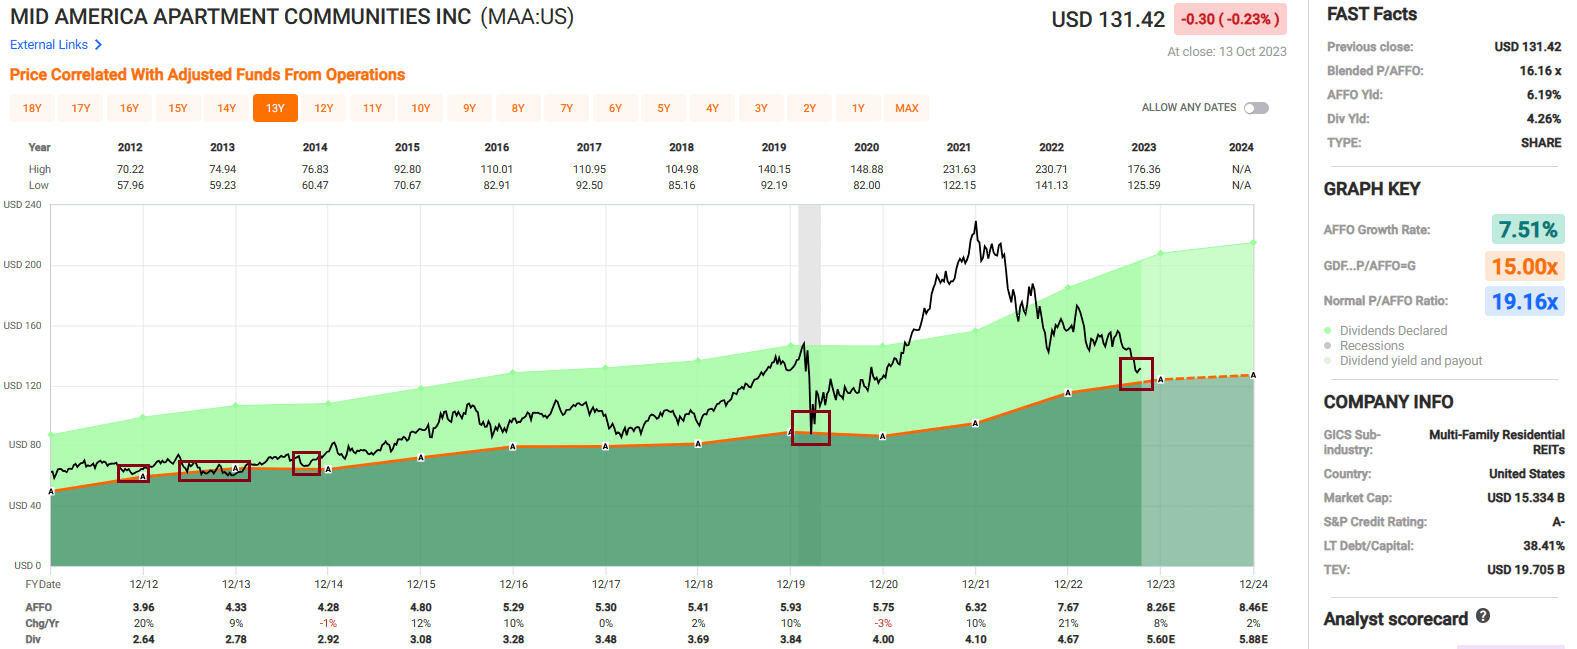
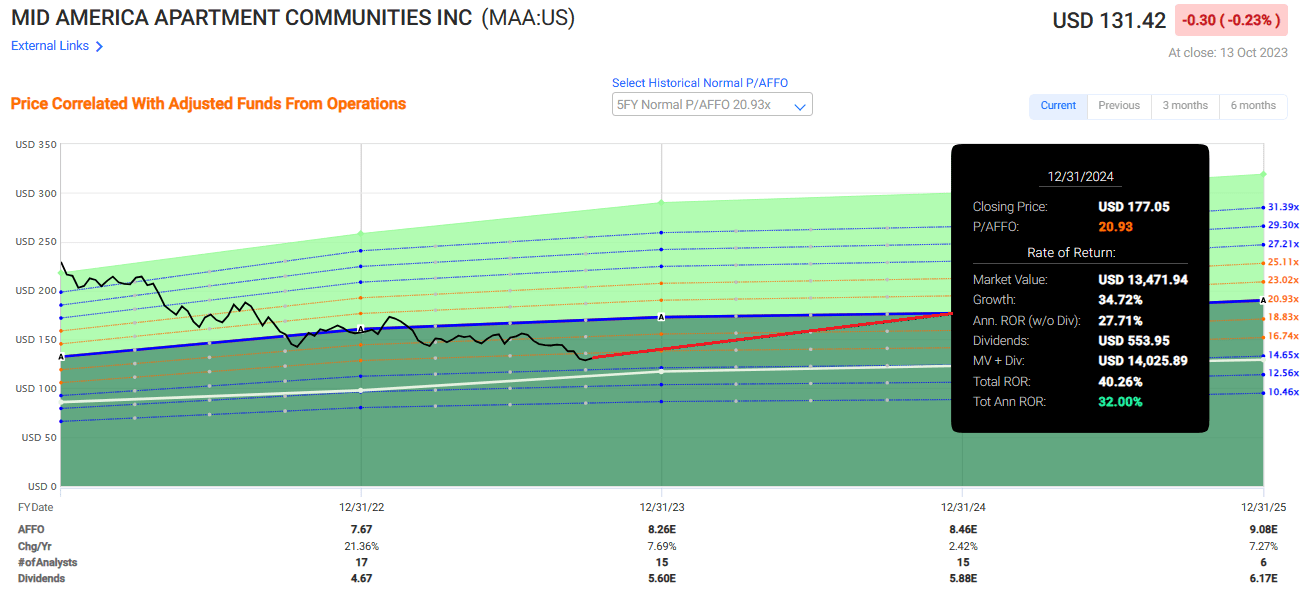
Since 2012 MAA has delivered an AFFO growth rate of 7.51% and an average dividend growth rate of 5.85%. As shown below MAA’s stock has only traded below an AFFO multiple of 15x a couple of times over the past decade.
Between 2012 and 2014 the stock traded around 15 times their AFFO per share, but since that time the stock has traded well above a multiple of 15x with the exception of the COVID crash. Currently the stock is trading at a P/AFFO of 16.16x which is a discount compared to their average AFFO multiple of 19.16x.
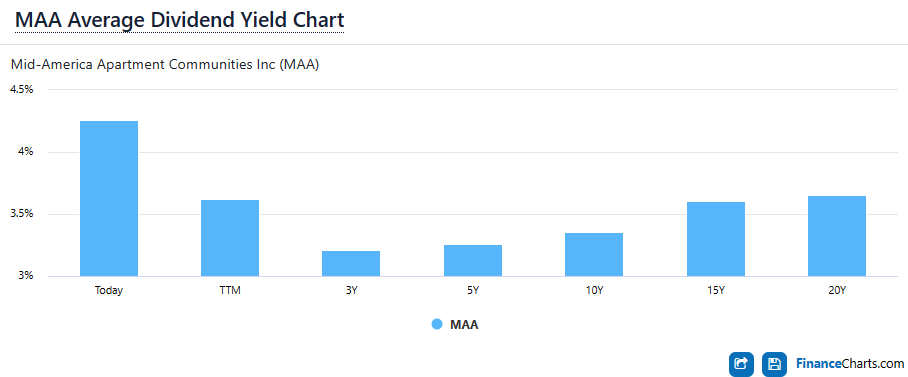
When measured by t he dividend yield the stock appears to be trading at a discount with a current yield of 4.26% compared to the three-year average dividend yield of 3.21%, t he five-year av erage dividend yield of 3.26%, and t he 10-year a verage dividend yield of 3.36%.
If Mid-America trades back up to the five-year average AFFO multiple of 20.93x it would result in a total annual rate of return of 32.00% by the end of 2024.
We rate Mid-America Apartment Communities a Buy.
In Closing...
I hope you enjoyed my Halloween-themed REIT recap of a few of my favorite REITs.
As I do most every year, I will be writing about three spooky REITs next: All tricks no treats.
Thank you for reading and I look forward to hearing from you below.
Note: Brad Thomas is a Wall Street writer, which means he's not always right with his predictions or recommendations. Since that also applies to his grammar, please excuse any typos you may find. Also, this article is free: Written and distributed only to assist in research while providing a forum for second-level thinking.
For further details see:
Trick Or Treat, My Favorite REITs