TCN - Tricon Residential: Attractive Set-Up Going Into 2024
2023-11-14 08:13:18 ET
Summary
- Tricon Residential is primarily an owner/operator of single-family rental homes in the US Sun Belt.
- It has underperformed its peers due to its higher leverage, exposure to variable rate debt, and high overhead.
- The current price offers a substantial margin of safety and an attractive set-up going into 2024 with several potential catalysts.
Summary
Tricon Residential (TCN) is an owner/operator of ~37,000 single-family rental homes primarily in the US Sun Belt and multi-family rentals in Canada, but also invests in adjacent businesses, including residential development in the US and Canada, and manages ~$8.1Bn of third-party capital through its Strategic Capital Solutions business. TCN has underperformed its main peers primarily due to the following:
- Higher Leverage: ~12x unadjusted proportionate EBITDAre (n.b., ~8x adjusted) vs. ~5x for peers
- Higher Exposure to Variable Rate Debt: ~27% variable rate vs. ~nil for peers and ~20% of debt maturing in '24 vs. ~10% for peers
- Higher Overhead: +2x higher than peers, with executive compensation significantly higher than peers on a size-adjusted basis
While these are valid concerns, I believe TCN's current valuation offers a substantial margin of safety that compensates for these risks. REIT activist investor Land & Buildings recently gave a presentation outlining its long thesis and indicating an activist engagement with management, where it will look to improve the loss-to-lease, reduce overhead, and sell non-core assets to deleverage. L&B's involvement may act as a "catalyst of catalysts" as they seek to unlock the latent value of TCN's assets.
TCN Overview
TCN has 3 segments: Single-Family Rental ("SFR"), Strategic Capital Solutions ("SCS"), and Adjacent Businesses. It currently has a ~$2.1Bn market cap, ~$5.1Bn proportionate TEV (n.b., ~$8Bn consolidated), implying 12.6x / 15.8x LQA FFO/AFFO and ~6.9% cap rate (n.b., 7.9% assuming FMV for SCS)
Valuation Overview (TCN )
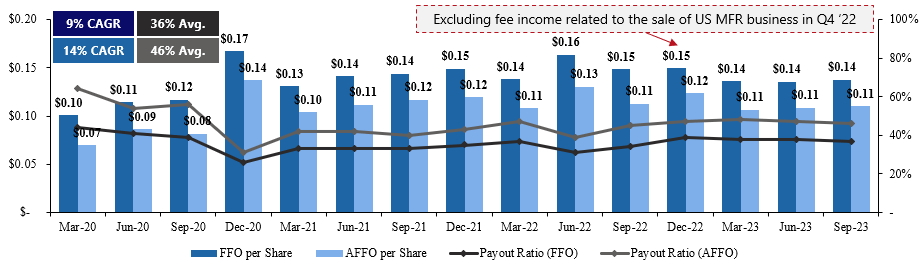
TCN's most notable peers are American Homes 4 Rent ( AMH ) and Invitation Homes ( INVH ), with ~59,000 and ~83,000 homes, respectively. Despite the strong operating performance of its core single-family rental portfolio (n.b., 96% of consolidated assets) on the back of supply constraints and the unaffordability of home ownership, TCN's share price is down a further ~10% YTD after a ~45% decline through '22 as interest costs have pressured FFO/AFFO (n.b., FFO/share and AFFO/share have grown at CAGRs of -0.2% and +1.3%, respectively, since Q1 '22) and forced a slower pace of acquisitions.
TCN per Share Metrics (TCN)
Single-Family Rental Overview
TCN owns or manages a portfolio of ~37,000 (n.b., ~15,000 wholly-owned, ~22,000 owned on a proportionate basis), of which ~90% are in the US Sun Belt.
Prop. SFH Breakdown (Homes) (TCN) NOI Breakdown by Geography (TCN)
Following the GFC, the SFR market has become increasingly institutionalized . Recently, COVID initiated several key trends that have transformed the market:
- Shifting Preferences: During lockdowns, many people bought detached homes to increase their living space and relocate away from major city centers. This trend was also aided by WFH
- Higher Cost of Capital: Higher rates to combat inflationary COVID-related stimulus has been a headwind for FFO. However, they have made home ownership prohibitively expensive for many Americans, leading to strong occupancy, rent growth, and home price appreciation
TCN Entered the SFR space in '12 and began growing the business in earnest in '17 by acquiring Silver Bay Realty, followed by the formation of two JVs in '18 and '19, and a $300MM preferred equity investment from Blackstone (via BREIT) in '20. Since BX's investment, TCN has focused on driving its growth through JVs, forming three in '21, two in '22, and is looking to launch another by the end of this year or early next.
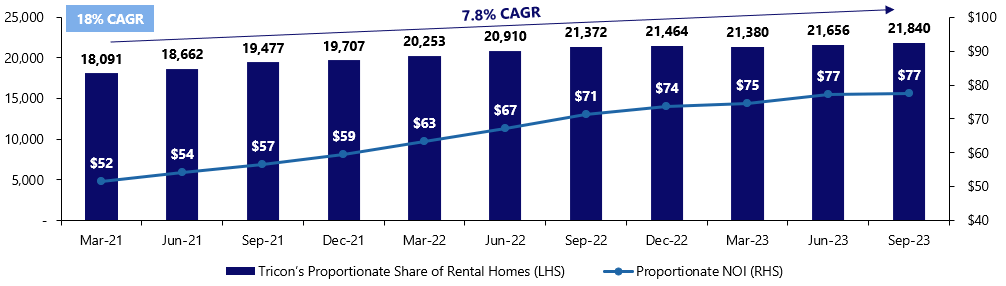
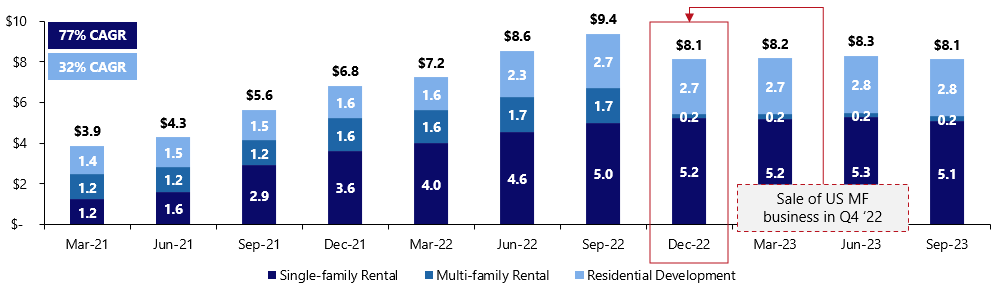
Since Q1 '20, TCN has grown its managed SFH portfolio at a ~13% CAGR (n.b., ~25% CAGR on JV rental homes and -1.5% wholly-owned homes). As of Q2 '23, ~90% of TCN's ~21.8k proportionate homes are located in the US Sunbelt (n.b., ~4% in Northern California and ~4% in Indiana).
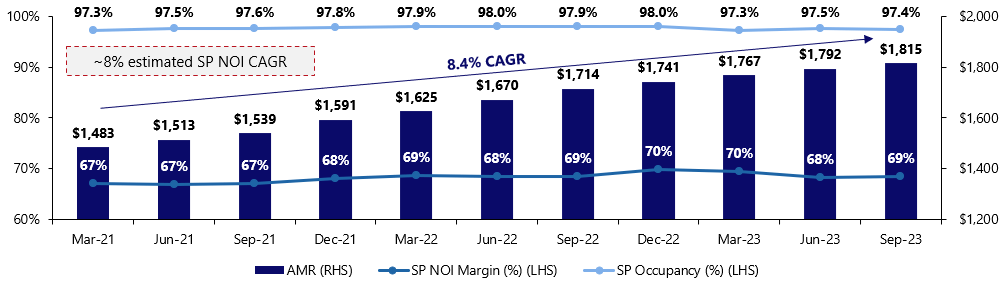
Prop. Homes & NOI (TCN) SFR Operating Stats (TCN)
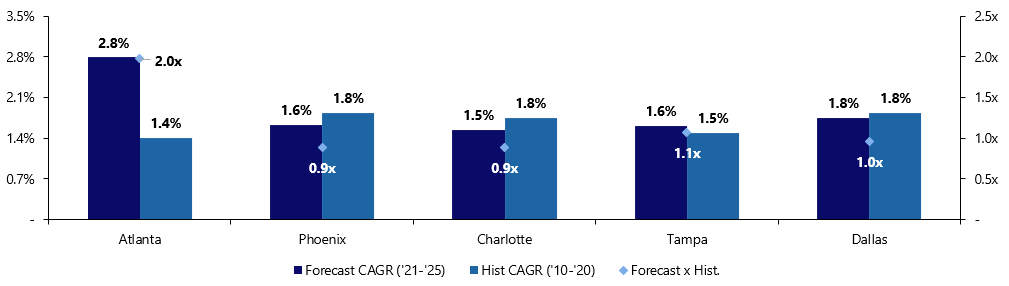
TCN's SFR strategy is focused on the middle-market segment of the high-growth Sun Belt states. From '10 - '20, the Sun Belt states have shown the strongest population growth in the US, benefitting from interstate migration driven by their preferable climate, lower taxes, lower cost of living, and, recently, a more relaxed approach to COVID lockdowns. This trend is expected to continue at or above historical growth rates (see below). One drawback to TCN's middle-market strategy is that it exhibits lower turnover compared to the lower and upper market segments, which has likely contributed to its relatively high loss-to-lease.
TCN Key Market Demographics (TCN; USCB)
Strategic Capital Services Overview
Tricon's Strategic Capital Services ("SCS") segment manages ~US$8.1Bn of third-party capital, which it invests through multiple JVs focused on SFR and development JVs. SCS earns asset management, property management, development, and performance fees. SCS manages capital for 13 of the top 100 largest institutional RE investors globally (n.b., SCS ranks 40th globally and 2nd in Canada for institutional equity raised since 2018 amongst RE managers). TCN also invests significant equity alongside its SCS clients ("principal AUM"), having committed 11-33% of the total equity of its most active vehicles.
SCS AUM Evolution (TCN)
Adjacent Businesses Overview
TCN's Toronto-based multi-family build-to-core portfolio consists of a $1.5B JV with CPP Investments and is expected to scale to ~5,600 units (n.b., 500 currently stabilized, 1,056 in lease-up, and 4,015 in various stages of construction). The portfolio is expected to contribute >$50M of annual NOI upon stabilization in 2028 .
TCN also has a legacy US residential development business consisting of commingled funds and separate accounts. TCN is now focused on selling off this portfolio on an opportunistic basis.
Valuation
My valuation of TCN is based on a SOTP considering the following segments: existing SFR portfolio (direct cap), SFR acquisition pipeline ((PV)), SCS (multiples), and adjacent businesses (book value). I use the value of these segments to derive TCN's NAV before making a further adjustment to account for the likely increase in borrowing costs on its '24 debt maturities (n.b., the incremental interest cost on '24 maturities based on the spread of expiring debt to most recent securitization, multiplied by the unadjusted AFFO multiple). Below is the summary of my valuation. More detailed explanations of my approach to each segment can be found in the following sections.
TCN SOTP Summary (Author)
SFR Segment
TCN's reported book value for its SFR properties is based on comparable home sales and broker price opinions; however, cap rates are a more appropriate way to value these assets, as this is how institutional buyers would underwrite the portfolio. I apply a 5.75% cap rate to my estimated NTM NOI (see below), which is on the high end of broker estimates and the low end of TCN's target range for acquisitions. The implied value for the portfolio is ~20% lower than the carrying value and implies an average home value that is ~16% lower than the acquisition cost of new homes in Q3 (n.b., $260k estimated vs. ~$310k for acquisitions).
TCN SFR Segment Valuation (Author; TCN)
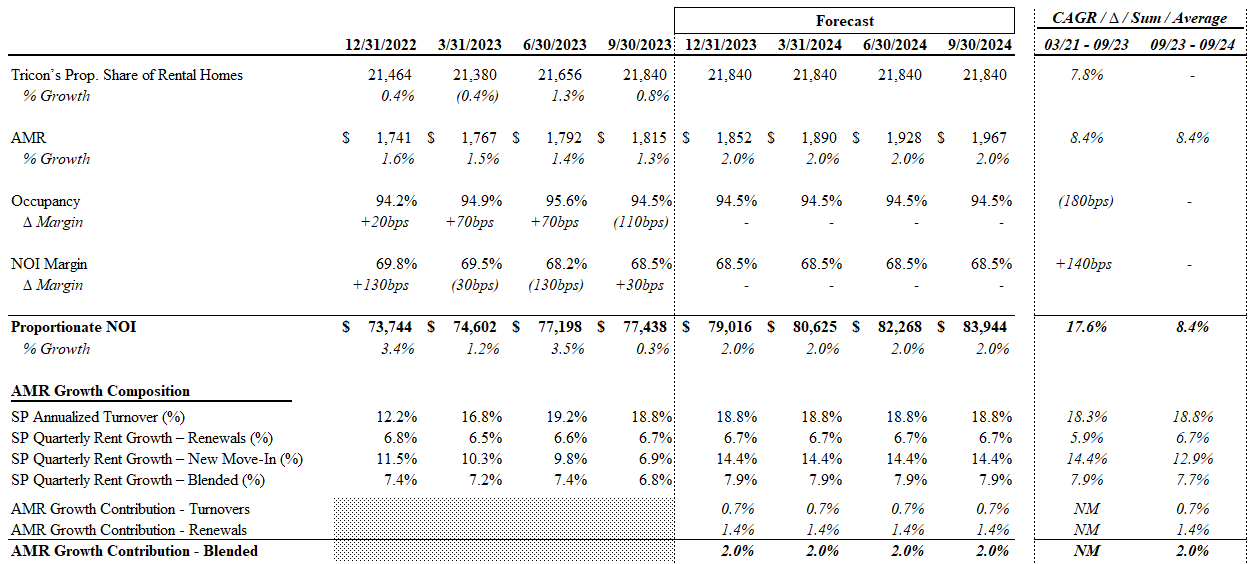
NOI projections are based on management's guidance.
SFR NOI Projections (Author; TCN)
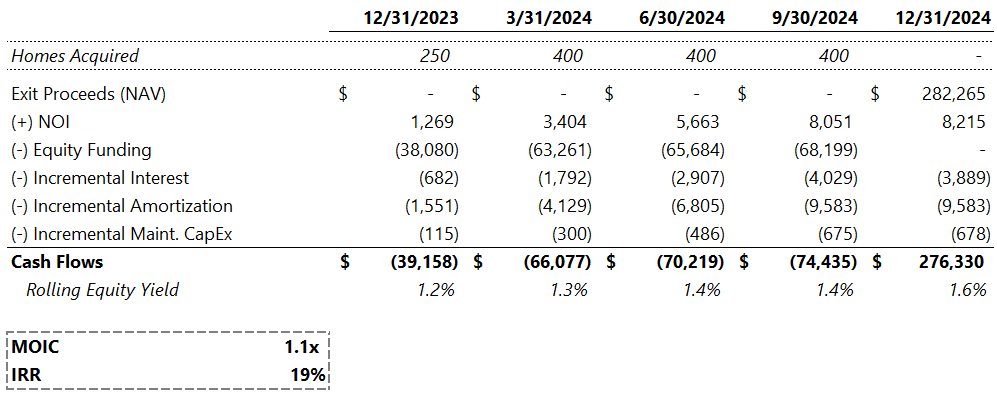
I treated the acquisitions program separately to simplify the valuation of the existing portfolio and assess how much value creation can be reliably attributed to the program. I assumed 1,450 SFHs acquired (n.b., 250 in Q4 '23, in line with guidance, 400/quarter in subsequent quarters, in line with previous guidance) at a 6.0% cap rate (5.75% at exit, in line with the existing portfolio), 55% LTV, and 5.86% cost of debt, in line with the recent securitization at ~5.86%. I assume 2% QoQ NOI growth, in line with my SFR projections, maintenance capex in line with historicals, and 30-year mortgage amortization. Despite the higher cost of debt and lower LTVs, the acquisition program still exhibits strong unit economics (see below).
SFR Acquisitions Economics (Author)
Based on my assumptions, I ascribe ~$0.05/share to the NTM of acquisitions based on an NPV at 8% of the above incremental cash flows (n.b., ~1% of the current share price). Should the financing markets stabilize, unit economics and the pace of acquisitions should improve.
SFR Acquisitions Valuation (Author)
SCS Segment
I value TCN's SCS business in 2 parts: Asset Management ("AM") and Property Management & Development. The AM segment is valued based on a 12.5x multiple on '24E fee-related earnings ("FRE"), in line with brokers and significantly lower than other large asset managers (e.g., Brookfield and Blackstone at high-teens/low-20s). I forecasted '24E FRE based on 2% QoQ growth in Fee-Bearing Capital ("FBC") over the next 4 quarters (n.b., 8.2% CAGR Q3 '23 - Q4 '24 vs. ~35% on third-party AUM Q1 '21 - Q3 '23, and ~15% sequential growth of FBC Q2 - Q3 '23). Property Management & Development is valued on 8x LQA FRE for these segments, reflecting the higher risk of development and simplistic approach to the FRE forecast.
SCS Segment Valuation (Author)
Downside Case
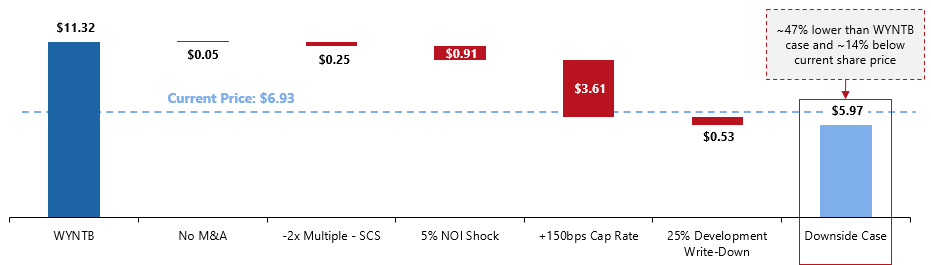
Below, I have provided a bridge from my central case to a punitive downside case which contemplates no SFH acquisitions, 2x lower multiples for SCS, a 5% decrease to stabilized SFR NOI, 175bps of SFR cap rate expansion (i.e., based on average spread to US5Ys and current yields), and a 25% write-down of the development business.
Risks
Leverage & Liquidity
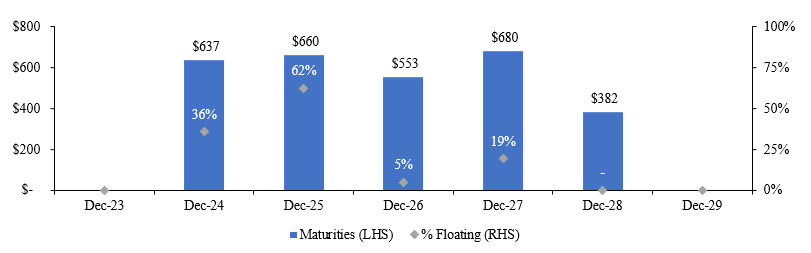
As of July, TCN had successfully dealt with its remaining '23 maturities. I estimate a current liquidity position of ~$500MM (n.b., ~$430MM excluding restricted cash). The current liquidity position is more than sufficient to cover '24 maturities, assuming a refi of the Securitization Debt 2017-2, which management says is on track. While the liquidity position appears healthy, significant maturities in '24 (n.b., ~20% of total prop. debt) will be a likely headwind for FFO/AFFO and acquisition volume as they are refinanced at higher rates with lower LTVs. This is accounted for in my valuation via the "Interest Rate MtM" item, which creates a liability for the estimated incremental interest cost on the '24 maturities valued at the implied AFFOx of my NAV.
TCN Debt Maturities (with extensions) (TCN)
Given the strong liquidity position and success TCN has had in the securitization market recently, I do not view this as a primary area of concern.
TCN Liquidity (TCN)
On the other hand, TCN's leverage is more concerning. While Net Debt/Adj. Tangible Assets is relatively healthy at ~45%, and management's preferred Net Debt / Adj. EBITDAre metric is ~8x (high, but not outrageous), but this does not accurately reflect TCN's true indebtedness. Management's preferred adjusted leverage multiple strips out the income/losses and debt of recently acquired vacant SFHs, and development projects. While this is a useful metric to assess the leverage of the stabilized portfolio, it significantly understates TCN's indebtedness. On an unadjusted basis (i.e., including vacant properties and the development portfolio), Net Debt / EBITDAre is actually in the ~10-12x range. Given the liquidity position, strong operating portfolio, and indications that management is looking to reduce overall leverage, I do not view this as existentially threatening. However, I do think it warrants a discount to peers and a smaller position size.
TCN Leverage Analysis (Author; TCN)
Interest Rate Exposure
The headline exposure to variable rates is ~27%, but ~7% when adjusting for active base rate caps. While this is still materially higher than peers, with essentially no variable rate exposure, it is much less of a problem than some seem to think. When considering that it seems we have reached the end of the Fed's hiking cycle, and the MtM liability I have factored into my valuation, I view this risk as manageable and priced in.
TCN Rate Exposure (TCN)
The other risks associated with interest rates, which I am much more concerned about, are: 1) rates remain elevated, leading to long-term cap rate expansion, and 2) falling rates unwinding the favorable (to TCN) affordability gap.
Currently, TCN is valued at an implied ~6.9% cap, ~230bps over the US5Y (n.b., ~30bps narrower than the historical average for SFR). In simple terms, if inflation and rates do not return to the much lower levels of recent history, TCN is fairly valued.
Conversely, higher rates and inflation also support SFH supply constraints and the relative affordability of renting vs. buying. A significant reduction of inflation, and subsequently interest rates, may drive the affordability gap back down to normal levels, leading to lower AMRs and/or lower occupancy, and allowing homebuilders to add significant supply, pressuring asset values.
The macro scenarios discussed above are highly limited and would lead to many follow-on effects (positive and negative to TCN) that are difficult/impossible to map out and quantify. If you find TCN's valuation compelling, it is important to stay on top of how the SFR market develops in relation to interest rates.
Executive Compensation
TCN has been criticized for what some consider excessive executive compensation and poor shareholder alignment (e.g., a recent L&B activist presentation). At face value, TCN's executive compensation appears highly excessive, with the top 5 NEOs receiving 2.4x more than the equivalent cohort at AMH in '22 (n..b, AMH is 6.5x larger on a market cap, and ~3x larger based on home count). However, ~65% of TCN's '22 executive compensation came from the LTIP (see below) in connection with the sale of the US MFR portfolio. Management's share of performance fees may be excessive, but it is a powerful incentive.
TCN Management Comp (TCN)
I am more concerned by the lack of per share metrics in the AIP, and the fact that LTIP compensation is larger than the value of TCN shareholdings for many key personnel. The AIP incentivizes management to pursue SP NOI growth (a good metric) and FFO growth (good, as long as it doesn't come with significant dilution). The LTIP, while potentially excessive, does not seem to be a problem in theory. Management gets paid when shareholders get paid. However, I wonder if it has created a perverse incentive. Several key personnel received either a significant percentage of, or more, value from their LTIP payments in '22 alone than the entire value of the common stock. Jonathan Ellenzweig, CIO, received ~$6.3MM of LTIP in '22, 5.7x the value of his ~$1.1MM of common (n.b., excluding options and DSUs). Gary Berman, CEO, received $12.8MM in LTIP, ~93% of the value of his ~$13.7MM common stock holding. My concern here would be if management focused on growing their LTIP through the development portfolio, for example, at the expense of the core SFR portfolio. While anything that drives the LTIP is ultimately beneficial to shareholders, it's the magnitude that created the problem. The development portfolio, even in the best-case scenario, is of relatively small importance to shareholders, while it could be the largest driver of value for management. As with debt, I think the way to deal with this risk is to demand a large margin of safety and keep the size smaller. The recent involvement of L&B could also prove beneficial in this regard.
Catalysts & Upsides
Activist Campaign
On October 17, Land & Building ("L&B") gave a presentation on TCN outlining its long thesis and indicating an activist engagement with management. The CT-based fund has a history of generally friendly activist engagements with a variety of REITs (n.b., ~35 active engagements over the past ~10 years). In their presentation, they outline what I consider to be the main catalysts for TCN:
- Loss-to-Lease: currently ~13-15%, providing significant room to grow AMRs. This is less a true catalyst than a supportive factor for strong operating performance, which the market has somewhat ignored in favor of the rate, growth, and leverage picture (likely, with management announcing a more active approach to handling long-term tenants and natural turnover)
- Cost Efficiencies/Compensation: overhead costs +2x greater than AMH/INVH despite its smaller size. If L&B can successfully lobby for right-sizing executive comp and G&A, this could be a major catalyst. However, note that much of TCN's overhead is attributable to its SCS business, which weakens the comparison with its peers (likely for cost efficiencies, with management announcing headcount reduction in the MRQ; unlikely for management comp)
- Capital Recycling: selling the Canadian MFR business to repay debt. Deleveraging may help narrow the valuation gap with peers, but note that the Oct '22 sale of the US MFR portfolio did not have a sustained positive effect on the share price (likely, but likely only in the SFR segment)
- Strategic Review: exploring a sale (unlikely)
Development Upside
In my valuation, I used the book value of TCN's development business to be conservative. However, the successful execution of its current development pipeline presents a significant potential upside that is not captured in my central case.
The quick-and-dirty valuation below indicates ~$0.7/share of potential incremental value and assumes the following:
- Value creation in line with management projections (see November investor deck , page 24)
- Canadian MF projects will be completed by 2028, per management
- US Residential projects will be completed by 2028, per management
- Value creation accrues linearly
- Discount rate of 10%, 200bps higher than the DR used for the SFH acquisitions
Development Upsides (Author; TCN)
Launch of JV 3
TCN is expecting to launch its next JV in early '24, which should prove to be a catalyst for the SCS business and accelerate the growth of its prop portfolio via TCN's co-investment in the JV. Management has indicated that the fund will be smaller than previous vehicles (n.b., $750-$900MM vs $1Bn JV 2), with a lower co-investment percentage (n.b., 20%-25% range vs ~33% before), and lower leverage (n..b, ~50% versus >65% in past vehicles).
Conclusion
With current prices below US$7 per share, TCN offers a substantial margin of safety and return profile relative to my price target of ~$10.25, which is based on a SOTP analysis and includes a discount for its near-term interest rate risk. Its high leverage and suboptimal management compensation present real risks that investors should consider carefully. I plan to consider AMH and/or INVH at a later date. While TCN is likely more compelling from a pure valuation perspective, it would be preferable to own one of these peers at a more moderate discount given the concerns around leverage and management.
For further details see:
Tricon Residential: Attractive Set-Up Going Into 2024