VIG - Trimming The Fat: OMFL Sheds Regional Banks Boosts Quality And Growth With Tech
2023-11-28 05:39:57 ET
Summary
- OMFL is a Russell 1000 Multifactor ETF that routinely changes according to a proprietary model's assessment of the economic cycle.
- My assessment is that OMFL is still modeling the expansion phase, but since my review in July, it's substituted low-quality Regional Banks with higher-quality Technology stocks.
- The resulting portfolio is attractive. My fundamental analysis reveals a portfolio with a lower five-year beta, a higher profit score, and earnings per share growth rate rivaling the Russell 1000.
- OMFL accomplishes this by largely avoiding the Magnificent Seven stocks, making it an excellent diversification tool. Still, concerns remain about how sensitive its model is, and how often the model gets it "right".
- In short, I've maintained my hold rating on OMFL, but am far less anxious about the fund's composition. This article takes a deep dive into its fundamentals at the sector and sub-industry levels.
Investment Thesis
I last covered the Invesco 1000 Dynamic Multifactor ETF ( OMFL ) in July, reporting 84% turnover from just three months prior and a dramatic switch from safe blue chips to riskier small and mid-cap value stocks. Unfortunately, these changes were ill-timed, and OMFL has since underperformed most major market indices. However, the latest changes better emphasize the quality and growth factors through increased exposure to Technology stocks, which had another solid earnings season, and substantially less exposure to risky Regional Banks. While concerns remain around the model's high sensitivity and somewhat unimpressive "monthly batting average," OMFL is an excellent way to diversify away from Magnificent Seven stocks, and I see no reason to abandon the ETF just yet.
OMFL Overview
Strategy Discussion: A Brief Overview
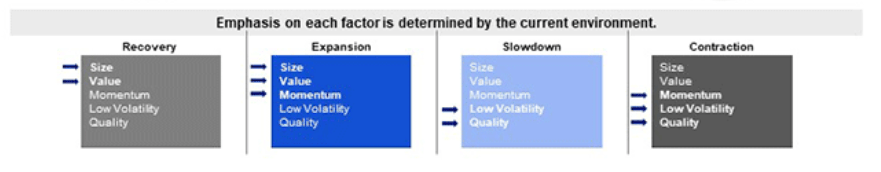
OMFL tracks the Russell 1000 Invesco Dynamic Multifactor Index, selecting securities according to market conditions and a proprietary model's determination of the current economic cycle. Economic indicators include manufacturing business surveys, monetary conditions, and housing activity, while equity and fixed-income returns in developed and emerging countries help gauge market sentiment. Depending on the selected cycle, the model emphasizes two or three factors: size, value, momentum, low volatility, or quality. The emphasis for each environment is summarized below.
Based on my observations, OMFL has spent most of its time in the expansion or slowdown phases, which the above graphic indicates are two worlds apart. Fundamentally, the expansion phase means holding a well-diversified group of small- and mid-cap stocks with high betas and cheap valuations, much like you would find with "pure value" ETFs like RZV, RFV, and RPV. In contrast, the slowdown portfolio looks more like a high-quality blue-chip fund like the Vanguard Dividend Appreciation ETF ( VIG ). Standard features include a five-year beta of around 0.90 and ROE figures rivaling the S&P 500 Index.
Performance Analysis
OMFL is a "trust the strategy" ETF, as portfolio turnover was 341% for the year ending August 23, and it's not reasonable to expect any investor to follow or respond to all changes. Besides, that would defeat the purpose of the strategy. Nevertheless, there are times when you will be satisfied with the fund's composition and others when you'll be baffled, and accepting that is necessary.
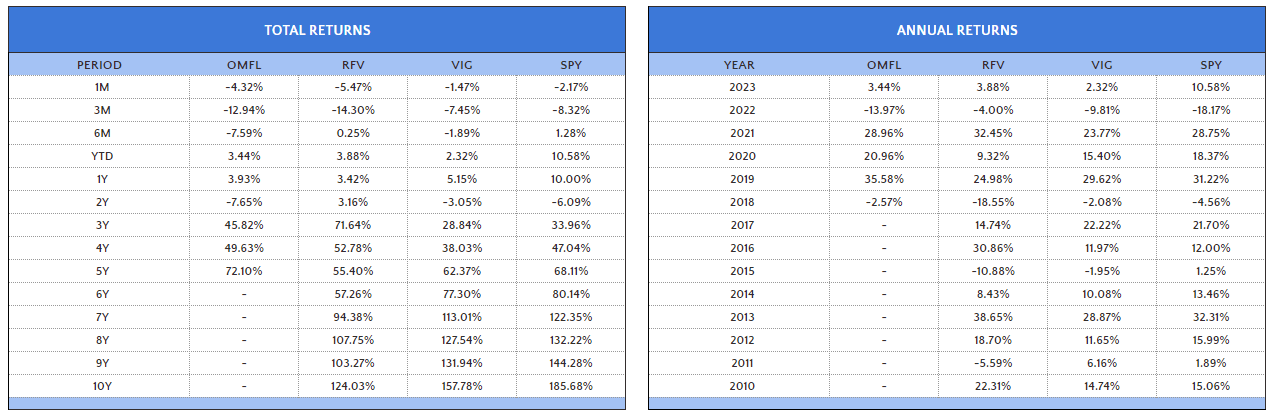
Still, OMFL has a solid track record. Through October 2023, its 72.10% five-year total return bests RFV, VIG, and SPY, but there are caveats. It has lagged all three over the last two years, and it's evident from the chart on the right that a lot of its outperformance occurred in 2020, a year unlikely to repeat. The following year was also strong, as OMFL benefitted from the correct selection of the expansion portfolio in a year when SPY gained 28.75%.
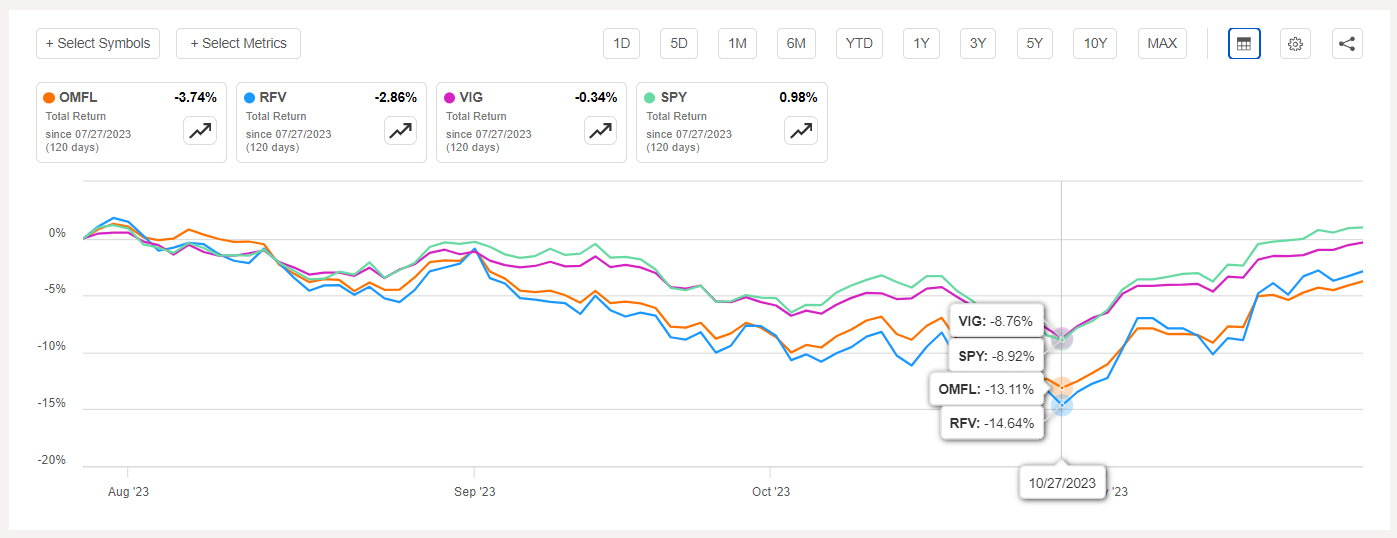
Since my cautionary July article, OMFL dipped by as much as 14.64% before recovering much of that in October. It's a reminder that not only was the prior composition the most risky, but investors should be careful about not attributing too much of an ETF's outperformance to just a handful of periods.
A flaw, which was evident from the start, is the model's high sensitivity. For a moment, consider if an actual human was making the asset allocation decisions and changing their mind each month about whether we're in a slowdown or expansion phase of the business cycle. Of course, no one expects any manager to be right 100% of the time, but it's appropriate to check to see if they've been right most of the time. So let's do that. Let's calculate OMFL's "batting average," or the percentage of months it outperformed its primary benchmark, the iShares Russell 1000 ETF ( IWB ).
The answer is 54% (39/72 months). Over two and three months, it's 55% and 56%, and 55% and 54% over six and twelve months. So, while it's certainly been better than average, it's not significant, and I'm not yet at a point where I can unquestioningly trust the strategy. In addition, we must remember that OMFL has mostly experienced upward-trending markets. Given its history of above-average volatility, the relative results might be weaker in a downward-trending market.
OMFL Analysis
Fund Composition
According to Invesco's website, OMFL currently only has 8.28% of assets in its top ten holdings, which isn't enough to perform a comprehensive analysis. The ETF's market cap and style breakdown is as follows:
- Large-Cap Value: 3.76%
- Large-Cap Blend: 9.33%
- Large-Cap Growth: 7.34%
- Mid-Cap Value: 18.05%
- Mid-Cap Blend: 27.46%
- Mid-Cap Growth: 16.08%
- Small-Cap Value: 4.75%
- Small-Cap Blend: 9.74%
- Small-Cap Growth: 3.49%
With 61.59% of assets dedicated to mid-cap stocks, OMFL looks like a mid-cap fund. However, I want to briefly discuss different classification systems and how easy it is to misinterpret a fund's composition, depending on the system used. To illustrate, here is the breakdown if one relied on S&P Guidelines.
- Small-Cap: 5.24%
- Mid-Cap: 33.67%
- Large-Cap: 61.09%
This breakdown indicates OMFL is predominantly large-caps. Therefore, my advice is to ensure you're making apples-to-apples comparisons. One alternative is to calculate a fund's weighted average market capitalization, which is $43.29 billion in this case, though much smaller than the $670.37 billion figure for IWB. These statistics and others are highlighted in the sector summary breakdown below.
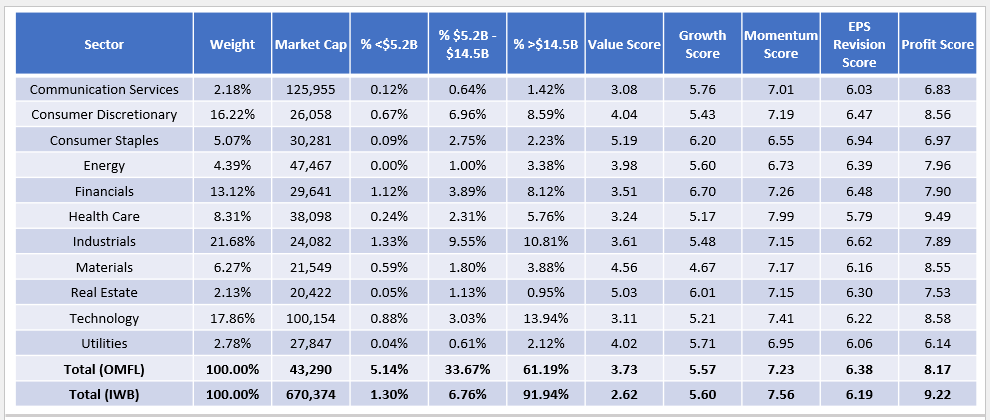
This high-level overview helps us determine which phase of the business cycle OMFL's model has assigned. The size factor is prominent, though less than before when OMFL's weighted average market cap was just $10.22 billion. In addition, OMFL's weighted average value score of 3.73/10 is higher than IWB's, which I calculated using individual Seeking Alpha Factor Grades. That narrows down the possibilities to either the recovery or expansion phases, where the momentum factor is emphasized in the latter but not the former. It's close, as OMFL's Momentum Score is relatively high but not as good as IWB's. Still, OMFL's constituents are up a weighted average of 23.84% in 2023 vs. 4.62% for the prior portfolio, so there's been a big change on the momentum front.
To sum up, OMFL substituted many of its small- and mid-cap holdings for higher-quality, less volatile, and more expensive large-cap stocks. It still looks like an "expansion" phase to me, but it's less aggressive than before and might attract some looking to diversify away from the Magnificent Seven stocks. OMFL has only a 0.50% combined exposure to these stocks ( AAPL , MSFT , GOOGL , AMZN , NVDA , META , TSLA ) compared to 26.28% in IWB.
Fundamentals By Sub-Industry
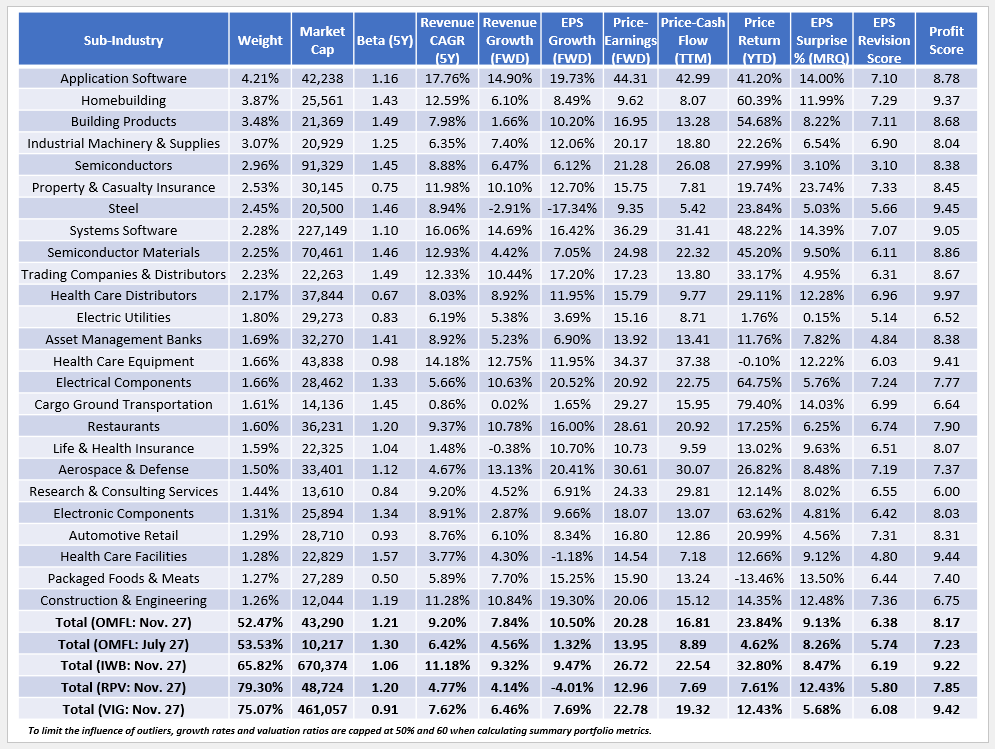
The following table highlights selected fundamentals for OMFL's top 25 sub-industries, totaling 52.47% of the portfolio. I also included summary metrics for OMFL's prior portfolio, IWB, VIG, and the Invesco S&P 500 Pure Value ETF ( RPV ) based on its market cap and beta similarities to OMFL.
I want to make a few observations:
1. OMFL remains well-diversified at the sub-industry level, with only 52.47% of assets in its top 25. The diversification is similar to the prior portfolio, better than what IWB, RPV, and VIG feature, and nearly impossible to accomplish with a market-cap-weighted approach. While avoiding the largest companies entirely is not prudent, OMFL consistently limits allocation to the Magnificent Seven. Even its "slowdown" version had only 6.26% and 5.70% exposure to Apple and Microsoft, with negligible or no exposure to the remaining five.
2. OMFL's five-year beta decreased from 1.30 to 1.21 with the latest reconstitution, which goes hand-in-hand with a higher market cap ($43.29 vs. $10.22 billion) and a higher overall profit score (8.17/10 vs. 7.23/10). As a quality-focused analyst, it's impossible not to like these changes, though it's still below what IWB and VIG feature at 9.22/10 and 9.42/10. I doubt OMFL will have much downside protection if its algorithm has selected the wrong model, but the ETF no longer has the same risks I cautioned about in July. Supplemental profitability metrics are below:
The Sunday Investor
Compared to IWB and VIG, OMFL's lower gross profit margins trickle down to lower net and free cash flow margins and lower ROA, ROE, and ROTC figures. However, it's head-and-shoulders above RPV, and although the Profit Scores are based on sector-adjusted Seeking Alpha Factor Grades, I'm surprised the difference isn't bigger.
3. Quality portfolios aren't cheap, and with the latest reconstitution, OMFL's forward P/E jumped from 13.95x to 20.28x and is now just 2.50 points cheaper than the higher quality, more defensive VIG. OMFL's 17.86% allocation to Technology stocks is a significant contributor, which trade at 29.88x forward earnings. Sub-industry representatives include Application Software (44.31x), Semiconductors (21.28x), Systems Software (36.29x), Semiconductor Materials (24.98x), and Electronic Components (18.07x). Previously, OMFL had just 6.62% allocated to Technology stocks.
4. Another substantial change was the estimated sales and earnings per share growth improvement. Those figures are 7.84% and 10.50% vs. 4.56% and 1.32% previously. This was unexpected and one of the changes that prompted me to provide this update. The most significant contributor was a 6.28% reduction to Regional Banks (6.98% to 0.70%), a sub-industry that might struggle if net interest margins trend downward with interest rates. The previously-held Regional Bank stocks had a weak 3.28/10 Growth Score, but more importantly, they had a low 1.23% ROA. Earlier this year, ROA was a critical screen for the ALPS O'Shares U.S. Small Cap Quality Dividend ETF ( OUSM ). As the sole measure of quality for Financial sector stocks, it managed to avoid the Regional Banking crisis.
5. Generally, Technology stocks had another solid earnings season, with OMFL's constituents delivering a 10.91% weighted average earnings surprise compared to 10.58% for IWB's Technology stocks. It's unclear if earnings surprises are an input in the model, but it's a nice bonus. Solid results also feed into analyst EPS Revisions, which can impact short-term performance. OMFL scores 6.38/10 on this metric, the best of the four.
Investment Recommendation
OMFL is an exciting fund to follow, though admittedly, its substantial turnover can cause headaches for the average investor. It's been around for six years, and although it's developed an impressive track record, I have yet to fully buy into the strategy. I don't like how sensitive the model is and how it can switch back and forth between the expansion and slowdown phases, which runs contrary to how a "cycle" should operate. Furthermore, its 54% batting average over IWB is not overly impressive. For context, VIG has outperformed OMFL 52% of the time and is easier to analyze and build a portfolio around due to its consistency.
That said, I like OMFL's recent changes, which place more emphasis on quality and growth. Also, a decrease in the portfolio's five-year beta and solid earnings surprise figures are bonuses, and its strong diversification at the sub-industry level is always appreciated. I understand some readers are disappointed in OMFL's recent performance and may want to give up on the ETF now, but I'm confident its current iteration is reasonably strong, so I see no reason to bail just yet. I hope this article was helpful, and as always, I look forward to answering your questions in the comments section below.
For further details see:
Trimming The Fat: OMFL Sheds Regional Banks, Boosts Quality And Growth With Tech