TRTN - Triton: Structural Changes To Leasing Arrangements Underpin Future Profitability
2023-04-03 10:09:16 ET
Summary
- Triton has enjoyed windfall profits due to COVID-19 supply chain disruption effects on shipping container short and long-term lease pricing.
- While 2023 earnings are expected to decline from 2022, underlying long-term earnings growth, ignoring the blip in 2022 earnings, is strong.
- Triton has taken advantage of the period of container shortages to lock in longer-term container leasing agreements at attractive prices, underpinning future profitability.
Triton: Investment Thesis
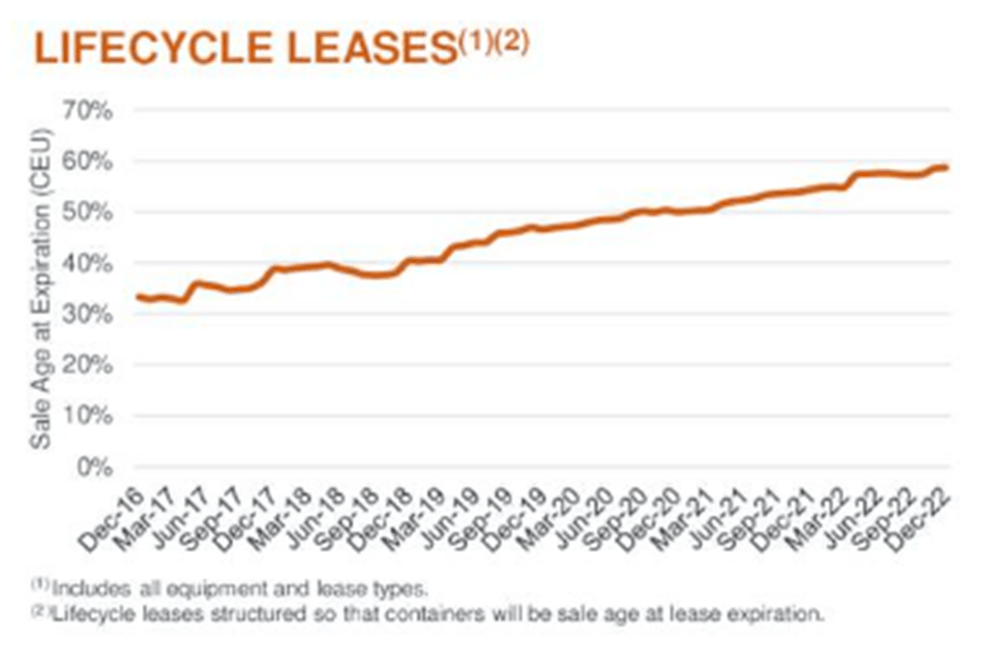
I published my only previous article on Triton ( TRTN ), " Triton: Investment Grade Dividend Stock, Potential 30%+ Per Year Total Return ", back on July 26, 2021. Since that time, Triton share price has increased by 26.67% compared to a decrease in the S&P 500 of (6.27)%. With dividends included, total return over the period is 36.27%. That total return has been achieved despite its P/E ratio decreasing from 8.85 at Jul. 26, 2021 to 5.58 at Mar. 31, 2023. That decrease in P/E ratio is likely highly influenced by SA Premium analysts' EPS consensus estimates for FY-2023 of $9.44, a decrease of 16.6% from FY-2022 record EPS of $11.32. A forward P/E ratio based on FY 2023 EPS is 6.70, but that is still far below the historical average P/E ratio of 8.02. What needs to be understood is FY-2021 and FY-2022 EPS results were driven by the extraordinary supply chain disruption following COVID-19. Container prices were at a premium and Triton "made hay while the sun shines". While this disruption has largely come to an end, Triton has locked in 100% lifecycle leases with customers over the last 6 years that have increased average age of containers at lease expiration from <40% to ~60% of sale age of containers at expiration of lease, per Fig. 1 below from the Q4-2022 earnings presentation .
Figure 1
SA Premium Triton Q4-22 Earnings Call Presentation
It can be seen from Fig.1 the average sale age of containers increased by ~12 percentage points over the three years Dec-16 to Dec-19. In the three years Dec-19 to Dec-2022 average sale age increased by another ~12 percentage points, but in absolute terms this has to be a far larger increase, as it comes off a much larger base. What Triton has achieved here is a much greater certainty in the business with a greatly increased percentage of container revenue locked in for the useful life of the containers.
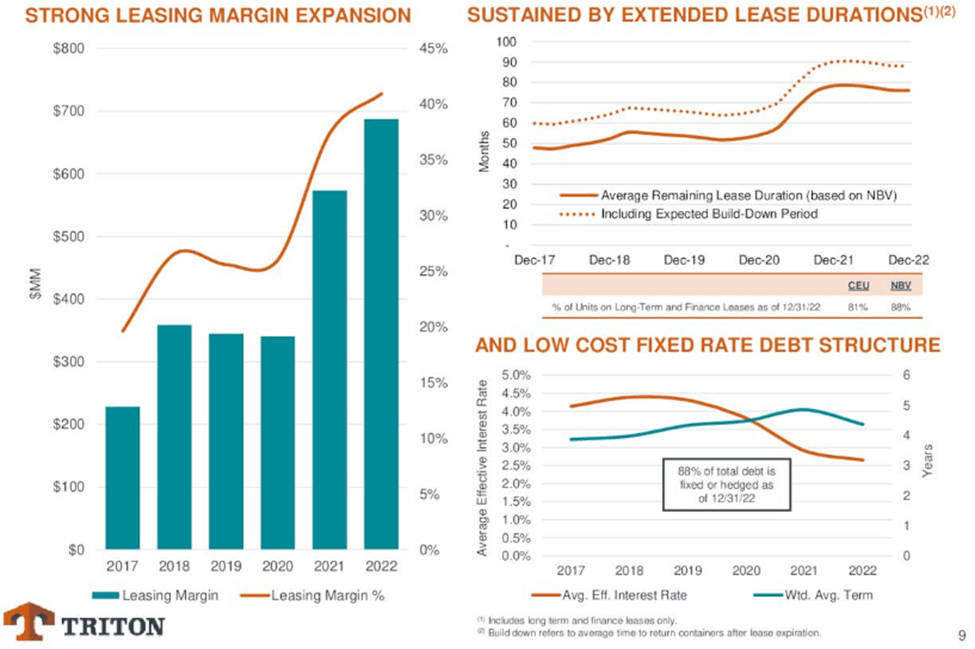
Triton earned "super" profits in FY-2022 due to extraordinarily high utilization and leasing rates for containers not under long term leases. But the company also locked in benefits for the future as shown in Fig. 2 below from its Q4-2022 earnings presentation.
Figure 2
SA Premium Triton Q4-22 Earnings Call Presentation
Without the benefit of exceptional earnings from containers not under long term leases, Triton EPS is estimated to decline from $11.32 for FY-2022 to $9.44 for FY-2023 based on analysts' consensus estimates. This is likely a large part of the reason the SA Premium Quant rating for Triton is a "Hold", per Fig. 3 below.
Figure 3
SA Premium
The downward revisions and decline in EPS automatically cause the Quant rating to default to "Hold". That does not invalidate the Quant system, overall statistically it has empirically shown above average returns, but there will always be exceptions, and I believe Triton is such an exception. The decline in EPS is not a reversal of fortune but due to a windfall one-off increase in an element of FY-2022 earnings which is not being repeated in FY-2023. This blip in earnings hides underlying long-term structural underlying earnings growth. Ignoring the period of COVID-19 disruption, which was beneficial to Triton's business, EPS has grown from $4.57 in FY-2019, pre-COVID, to an estimated $9.44 for FY-2023, an average yearly growth rate of ~20%. This structural growth was aided by an ability to lock in long term leases at higher rates during FY-2021 and 2022 as shown in Fig. 2 above. Those opportunities to use cash flows to acquire containers for new short and long-term leases are now likely greatly reduced, but Triton is now using its strong earnings to repurchase shares. And what a wonderful opportunity to repurchase shares when the forward P/E multiple is below 7.0. Triton's dividend yield is currently 4.3% but dividend payout ratio based on FY-2023 analysts' consensus EPS estimate of $9.44 is just 30%. The relatively low payout ratio is due to the low forward P/E ratio of 6.70 which translates to a total implied yield of 15%, of which only 30% is required for the dividend payment. With only 30% of earnings going to dividends, that leaves 70% of earnings to reinvest in the business or to repurchase shares. Triton stock continues to represent a very investable opportunity. My usual detailed structured financial analysis follows.
Looking for market mispricing of stocks
What I'm primarily looking for here are instances of stock market mispricing of shares due to distortions to many of the usual statistics used for screening stocks for buy/hold/sell decisions. The usual metrics do not work when the "E" in P/E is distorted by the impact of COVID-19. And if the P/E ratio is suspect, so too, then, is the PEG ratio similarly affected. I believe the answer is to start with data at the end of 2019, early 2020, pre-COVID-19 and compare to projections out to the end of 2023 or later, when hopefully the impacts of COVID-19 will have largely dissipated. The Triton stock analysis, summarized in Tables 1, 2, and 3 below is the result of compiling and analyzing the data on this basis.
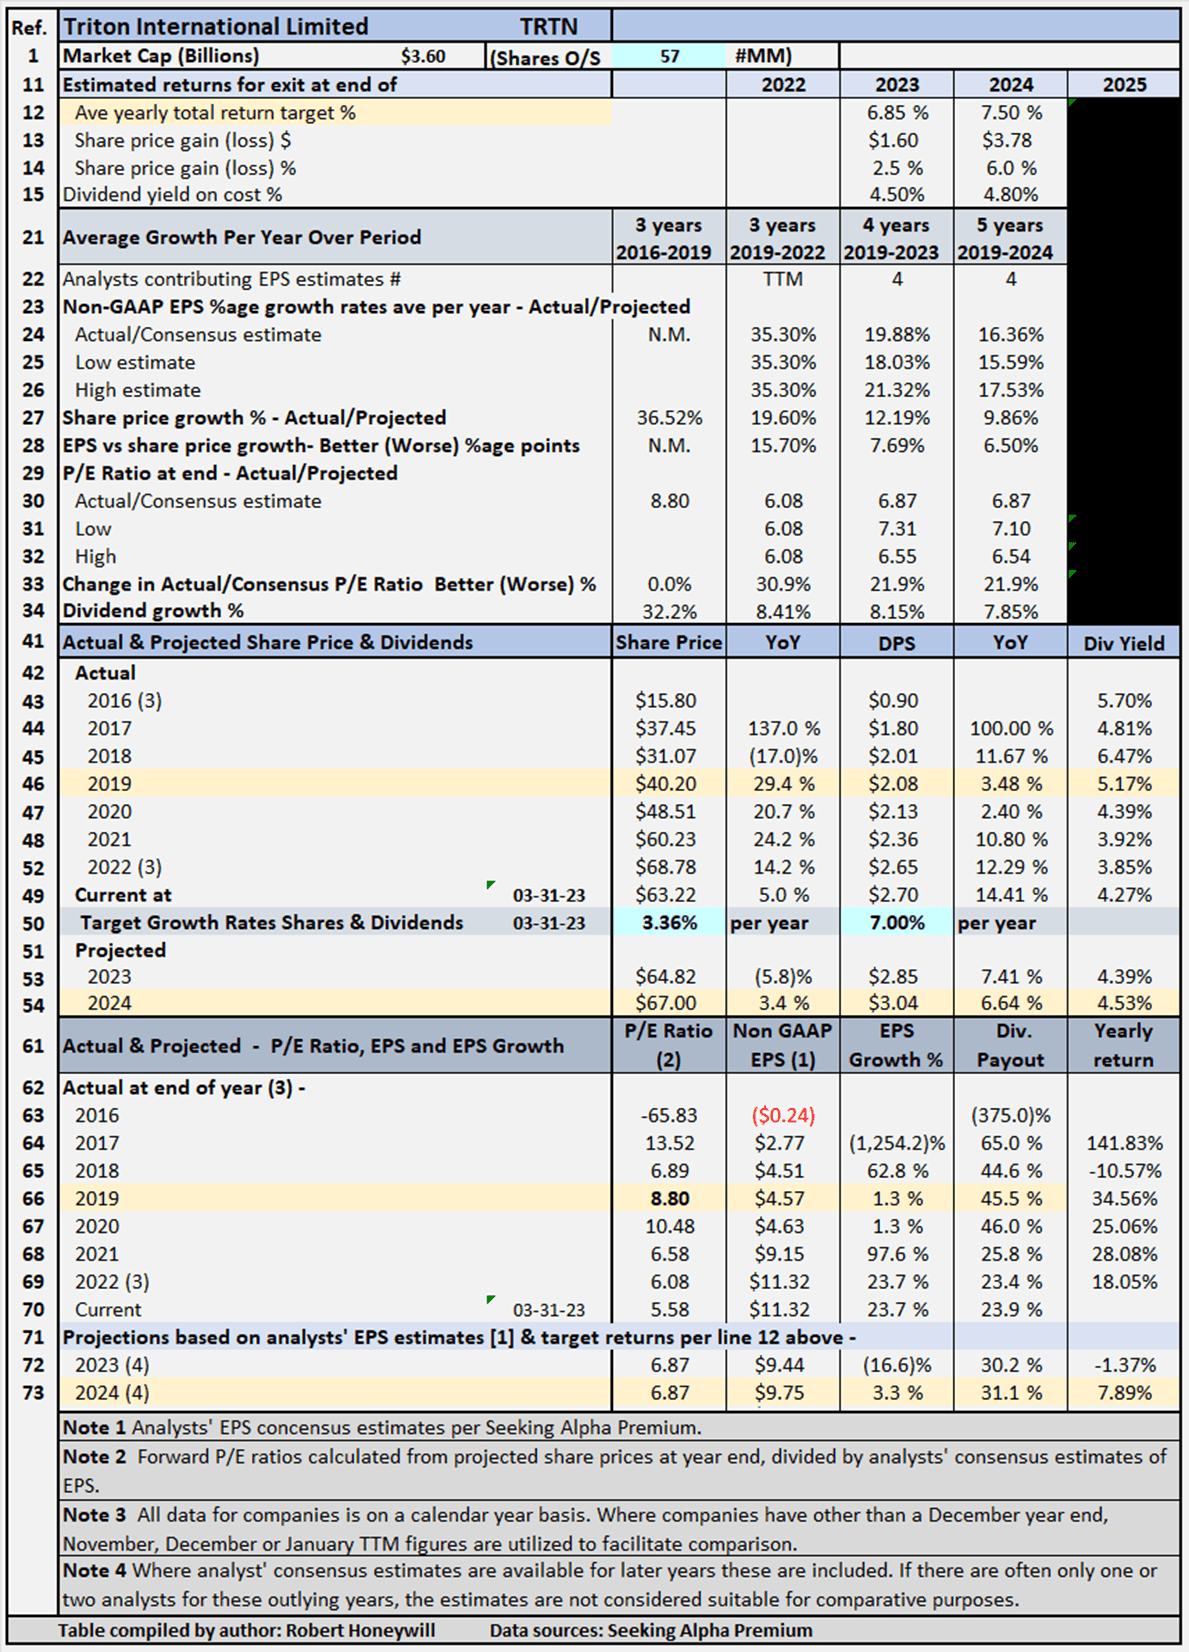
Table 1 - Detailed Financial History And Projections
Table 1 documents historical data from 2016 to 2019, including share prices, P/E ratios, EPS and DPS, and EPS and DPS growth rates. The table also includes estimates out to 2025 for share prices, P/E ratios, EPS and DPS, and EPS and DPS growth rates (note - while estimates are shown for analysts' EPS estimates out to 2022, 2023, 2024 and 2025 where available, estimates do tend to become less reliable, the further out the estimates go. These estimates are only considered sufficiently reliable if there are at least three analysts' contributing estimates for the year in question). Table 1 allows modeling for target total rates of return. In the case shown above, the target set for total rate of return is 7.5% per year through the end of 2024 (see line 12), based on buying at the Mar. 31, 2023, closing share price level. As noted above, estimates become less reliable in the later years. I have decided to input a target return based on the 2024 year, which has EPS estimates from four analysts, because it allows for the impact of the projected EPS growth rates to be taken account of in the assessment of the value of Triton shares. The table shows to achieve the 7.5% return, the required average yearly share price growth rate from Mar. 31, 2023, through Dec. 31, 2024, is 3.36% (line 50). Dividends and dividend growth make up the balance of the target 7.5% total return. Table 2 below shows projected returns through end of 2024.
Triton's Projected Returns Based On Selected Historical P/E Ratios Through End Of 2024
Table 2 below provides additional scenarios projecting potential returns based on select historical P/E ratios and analysts' consensus, low, and high EPS estimates per Seeking Alpha Premium through end of 2024.
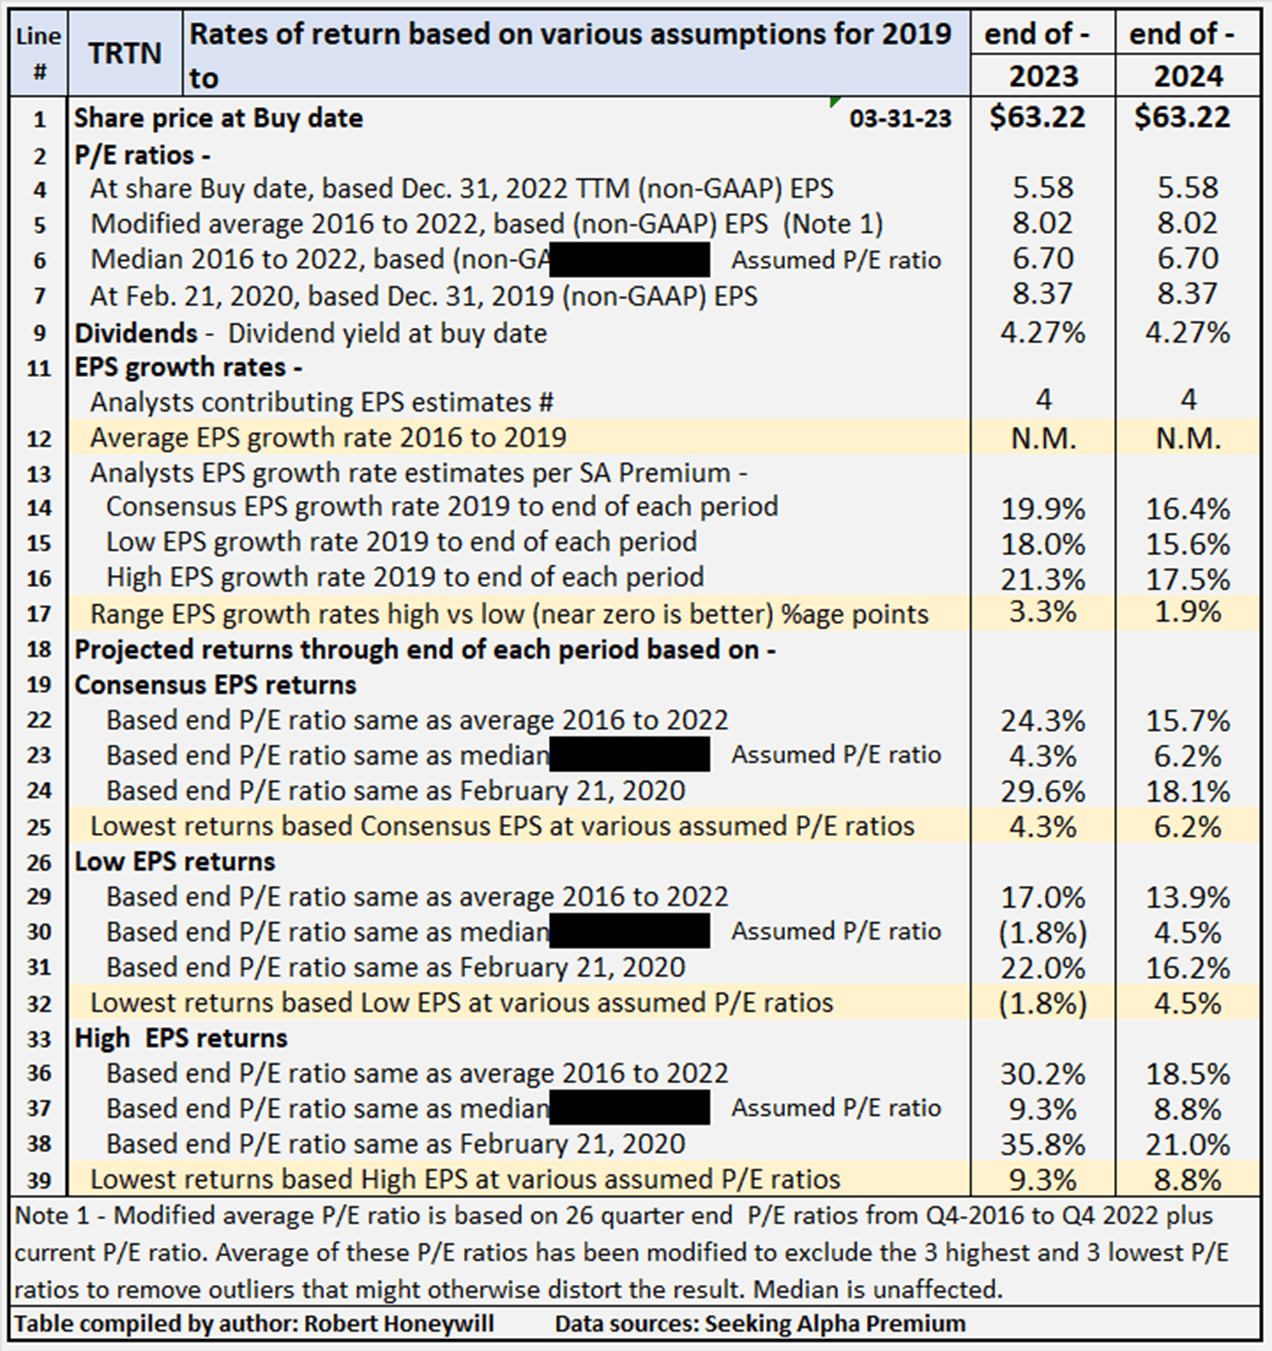
Table 2 - Summary of relevant projections Triton
Table 2 provides comparative data for buying at closing share price on Mar. 31, 2023, and holding through the end of years 2023 through 2024. There's a total of nine valuation scenarios for each year, comprised of three EPS estimates (SA Premium analysts' consensus, low and high) across three different P/E ratio estimates, based on historical data. Triton's P/E ratio is presently 5.58. For Triton, the present P/E ratio is well below the range of historical P/E ratios. Table 2 shows potential returns from an investment in shares of the company at a range of historical level P/E ratios This analysis, from hereon, assumes an investor buying Triton shares today would be prepared to hold through 2024, if necessary, to achieve their return objectives. Comments on contents of Table 4, for the period to 2024 column follow.
Consensus, low and high EPS estimates
All EPS estimates are based on analysts' consensus, low and high estimates per SA Premium. This is designed to provide a range of valuation estimates ranging from low to most likely, to high based on analysts' assessments. I could generate my own estimates, but these would likely fall within the same range and would not add to the value of the exercise. This is particularly so in respect of well-established businesses such as Triton. I believe the "low" estimates should be considered important. It's prudent to manage risk by knowing the potential worst-case scenarios from whatever cause.
Alternative P/E ratios utilized in scenarios
- The actual P/E ratios at the buy date based on actual non-GAAP EPS for FY-2022.
- A modified average P/E ratio based on 26 quarter-end P/E ratios from Q4 2016 to Q4 2022 plus current P/E ratio in Q1 2022. The average of these P/E ratios has been modified to exclude the three highest and three lowest P/E ratios to remove outliers that might otherwise distort the result.
- A median P/E ratio calculated using the same data set used for calculating the modified average P/E ratio. Of course, the median is the same whether or not the three highest and lowest P/E ratios are excluded. In the case of Triton, I have chosen to use an assumed P/E ratio of 6.70, based on current forward P/E ratio for 2023, in place of Triton's historical median of 7.52. I have done this to provide an idea of the impact on returns of the multiple continuing at a level below the historical average and median.
- The actual P/E ratio at Feb. 21, 2020, share price, based on 2019 non-GAAP EPS. The logic here is the market peaked around Feb. 21, 2020, before any significant impact from COVID-19 became apparent. This makes the P/E ratios at Feb. 21, 2020, reflective of most recent data before distortion of P/E ratios by the impact of the coronavirus pandemic.
Reliability of EPS estimates (line 17)
Line 17 shows the range between high and low EPS estimates. The wider the range, the greater disagreement there is between the most optimistic and the most pessimistic analysts, which tends to suggest greater uncertainty in the estimates. There are four analysts covering Triton through end of 2024. In my experience, a range of 1.9 percentage points difference in EPS growth estimates among analysts is quite moderate. It suggests a degree of certainty, and thus greater reliability.
Projected Returns (lines 18 to 39)
Lines 25, 32 and 39 show, at a range of historical P/E ratio levels, Triton is conservatively indicated to return between 4.5% and 8.8% average per year through the end of 2024. The 4.5% return is based on analysts' low EPS estimates and the 8.8% on their high EPS estimates, with a 6.2% return based on consensus estimates. Those are the lowest of the returns under the consensus, low and high EPS scenarios and assume the P/E ratio will remain at the forward level of 6.70 for 2023. The 6.70 is well below the longer-term average of 8.02 and it is likely reasonable to expect higher multiples between now and 2024. At the high end of the projected returns for Triton, which assume P/E levels at the pre-COVID levels in Feb. 2020, the indicative returns range from 16.2% to 21.0%, with consensus 18.1%. I believe it is not unreasonable to expect returns close to or in this range if buying now and holding through end of 2024. The difference between best and worst cases is an indication of the degree of certainty in analysts' estimates.
Checking Triton's "Equity Bucket"
Table 3.1 Triton Balance Sheet - Summary Format
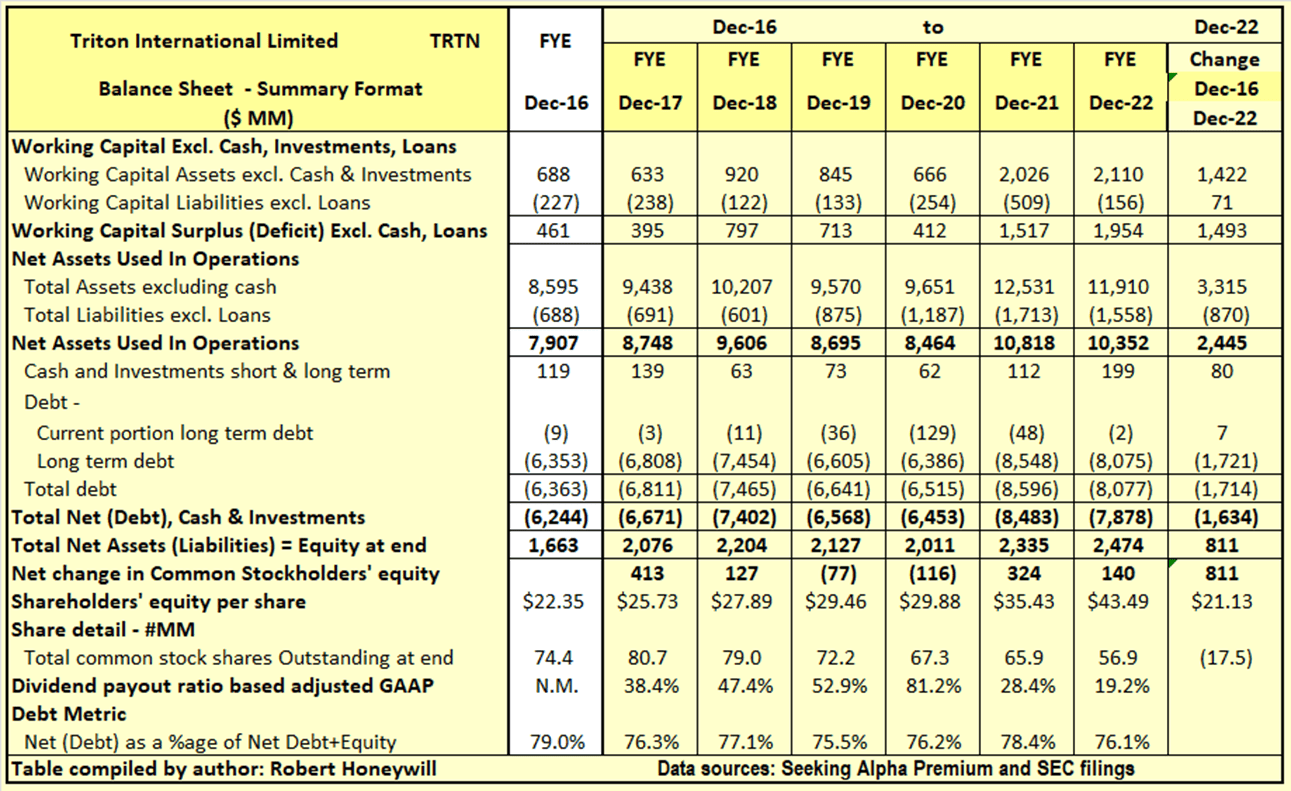
Over the 6 years from the end of 2016 to end of 2022, Triton has increased net assets used in operations by $2,445 million. This increase was funded by an increase in common shareholders' equity of $811 million and debt net of cash of $1,634 million. Net debt as a percentage of net debt plus equity decreased from 79.0% at end of 2016 to 76.1% at end of 2022. The high debt ratio is not overly concerning given the debt is mainly a means of financing the company's business of purchasing shipping containers and leasing these to shipping companies under long term leases. Outstanding shares decreased by 17.5 million from 74.4 million to 56.9 million, over the period, due to share repurchases, partially offset by shares issued for stock compensation, and share issues in FY-2017. The $811 million increase in shareholders' equity over the last 6 years is analyzed in Table 3.2 below.
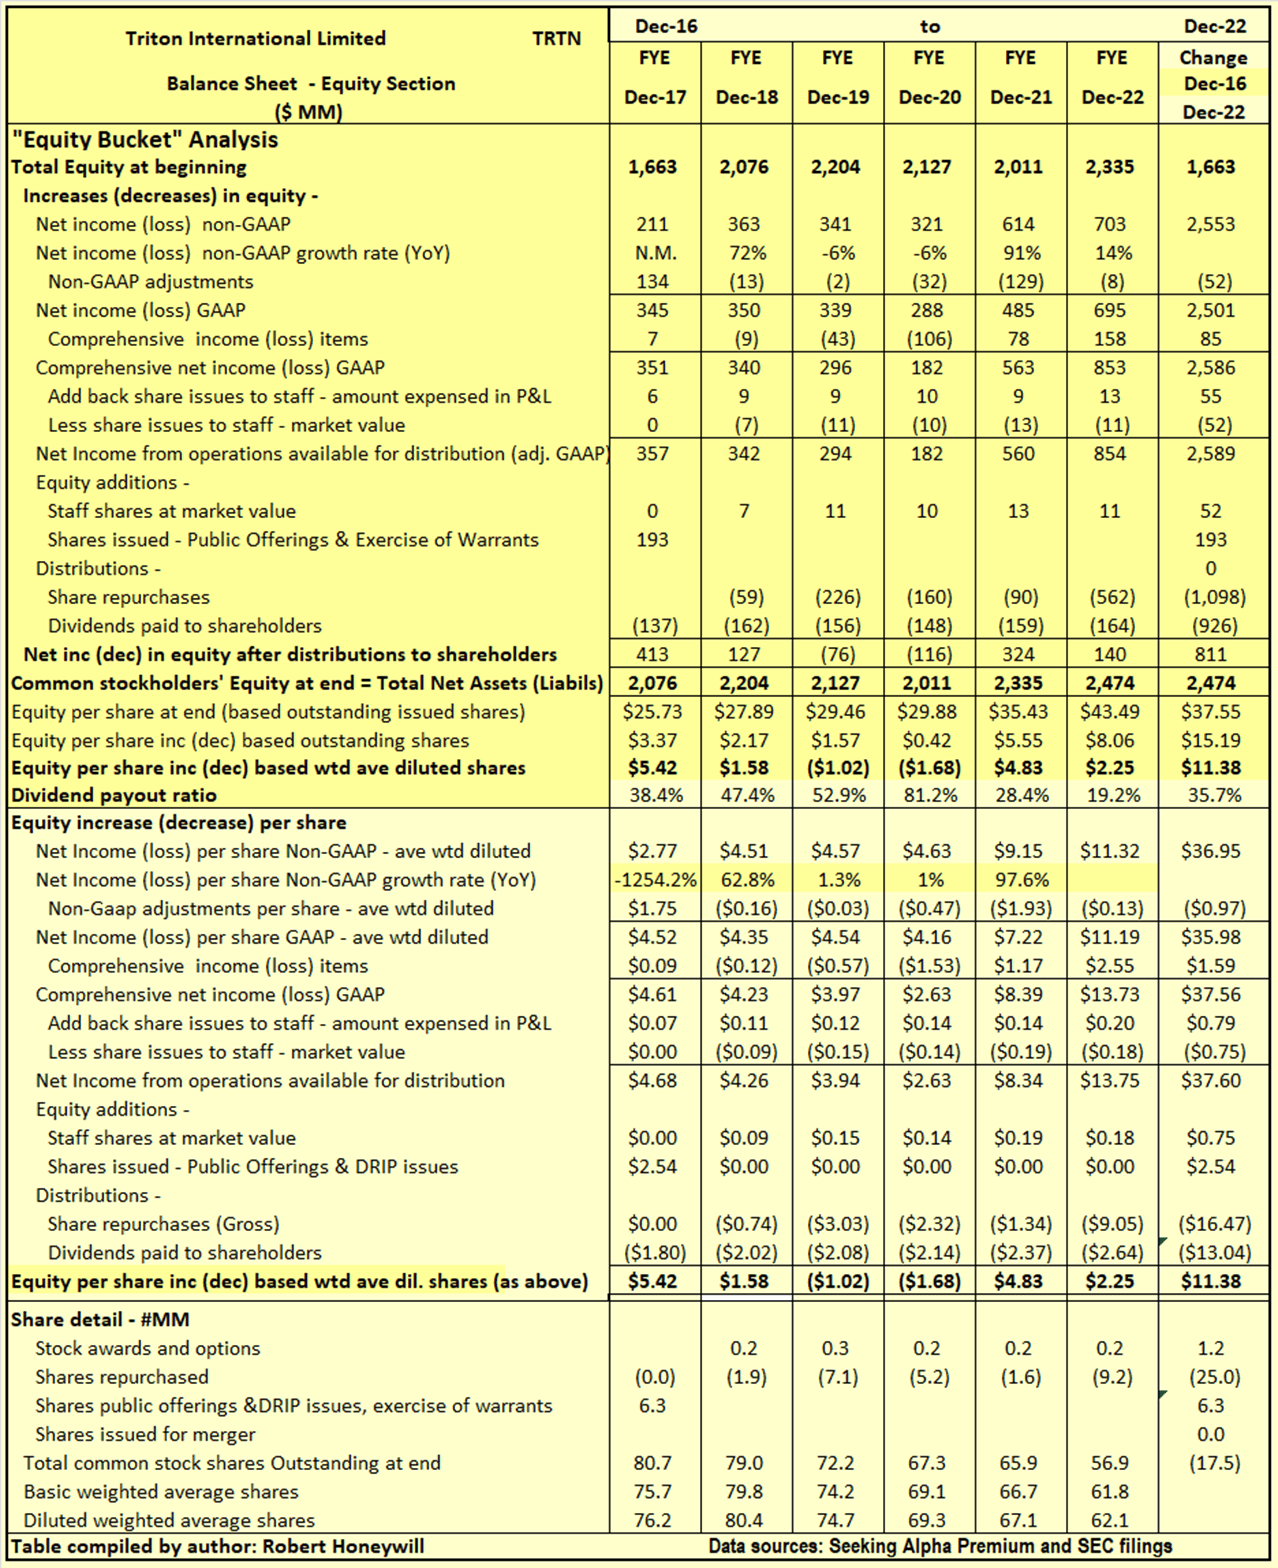
Table 3.2 Triton Balance Sheet - Equity Section
I often find companies report earnings that should flow into and increase shareholders' equity. But often the increase in shareholders' equity does not materialize. Also, there can be distributions out of equity that do not benefit shareholders. Hence, the term "leaky equity bucket." I do not find this happening with Triton.
Explanatory comments on Table 3.2 for the period end FY-2016 to end FY-2022.
- Reported net income (non-GAAP) over the 6-year period totals to $2,553 million, equivalent to diluted net income per share of $36.95.
- Over the 6-year period, the non-GAAP net income excludes $52 million of GAAP loss (EPS effect $0.97) of items regarded as unusual or of a non-recurring nature in order to better show the underlying profitability of Triton.
- Other comprehensive income includes such things as foreign exchange translation adjustments in respect to buildings, plant, and other facilities located overseas and changes in valuation of assets in the pension fund - these are not passed through net income as they fluctuate without affecting operations and can easily reverse in a following period. Nevertheless, they do impact on the value of shareholders' equity at any point in time. For Triton, these items amounted to positive $85 million (EPS effect $1.59) over the 6-year period.
- Amount taken up in equity to account for shares issued to staff over the 6 years is $55 million. This compares to an estimated market value of $52 million at the time of issue of these shares. The estimated market value of these shares is very little different to that allowed for in arriving at non-GAAP EPS, so no "leaky equity bucket" here.
- By the time we take the above-mentioned items into account, we find, over the 6-year period, the reported non-GAAP EPS of $36.95 ($2,553 million) has increased to $37.60 ($2,589 million), added to funds from operations available for distribution to shareholders.
- Dividends of $926 million, and share repurchases of $1,098 million, together totaled $2,024 million. These were adequately covered by $2,589 million generated from operations, resulting in a net increase of $565 million in equity from operating activities.
- This net $565 million increase in equity from operations, together with $193 million of shares issued in FY-2017, and the $52 million capital raised through share issues to staff, resulted in the $811 million net increase in shareholders' funds per Table 3.1 above.
Triton: Summary and Conclusions
Triton has a sound balance sheet as evidenced by the BBB- rating from both S&P and Fitch. What might look like high debt levels is due to partial debt financing of containers supported by revenue from medium to long term container lease agreements. It should also be noted there is a market for containers so these are not as illiquid as most companies' plant and facilities. With the fall off in demand for containers, Triton is in a position to use its cash flows from long term container leasing to repurchase shares at its current (likely undervalued) stock price, as an alternative to its spending on expanding its leased container fleet over the high demand period of the last two years. Recently, share price growth has been affected by multiple contraction which is likely driven by the prospect of FY-2023 earnings below FY-2022 levels. Underlying long-term EPS growth has been strong. Should the P/E multiple revert to or around the long term average of 8.02, based on the full range of analysts' estimates, excellent returns of 14% to 18% are indicated for buying now and holding through end of 2024, with consensus around 16%. Multiple expansion is likely more probable than any further multiple contraction.
For further details see:
Triton: Structural Changes To Leasing Arrangements Underpin Future Profitability