PTBD - TRND: An ETF For Trend Following Investors
2023-03-08 09:00:00 ET
Summary
- The Pacer Trendpilot Fund of Funds ETF invests in other Pacer ETFs that invest based on selected indices based on market trends. The ETF is Globally invested.
- Each of the underlying ETFs are reviewed. A common review of how each index works is included. Where possible, the Trend ETF was measured against an equivalent non-trend ETF.
- While backtesting showed promise, in practice the results have not. With none of the held ETFs showing superior results except for lower StdDevs, I would pass on the whole set.
(This article was co-produced with Hoya Capital Real Estate )
Introduction
Market trend following, also similar to momentum investing, believes investors can earn Alpha by following the market or individual stock's direction. This runs counter to the “ Random Walk ” theory that in its simplest form, says future market movements are unpredictable and random.
Pacer Advisors has launched their Trendpilot ETF Series to provide investors access to trends in six different market segments. For investors who want a simpler means of exposure, Pacer set up the Pacer Trendpilot Fund of Funds ETF ( TRND ), which includes the above ETFs except for the Pacer Trendpilot European Index ETF ( PTEU ). This article will review the current allocation in TRND and more detailed look at each of the five ETFs that TRND holds. Where possible, a comparison against the ETFs base index or equivalent ETF is provided.
Index policy/procedures review
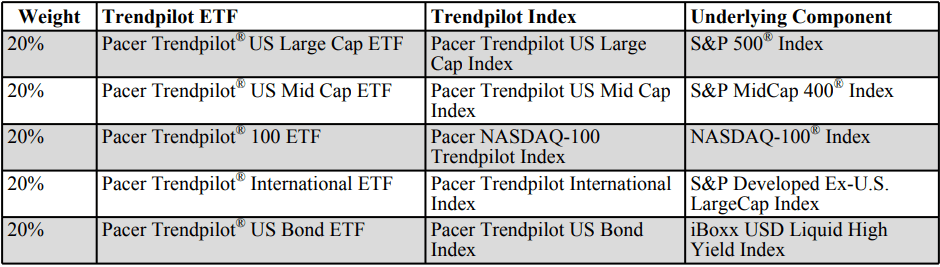
The index is reset to 20% allocation in each ETF every quarter. The following outlines the process used by each equity and then bond ETF:
Each Equity Trendpilot Index uses an objective, rules-based methodology to implement a systematic trend-following strategy that directs exposure:
- 100% to the “Underlying Component” specified in the table below,
- 50% to the applicable Underlying Component and 50% to 3-Month US Treasury bills, or
- 100% to 3-Month US Treasury bills, depending on the relative performance of the Underlying Component and its 200-business day historical simple moving average (the “200-day moving average”). The calculation of the 200-day moving average for each Underlying Component is based on the total return version of such Underlying Component and reflects the reinvestment of dividends paid by the securities in such Underlying Component.
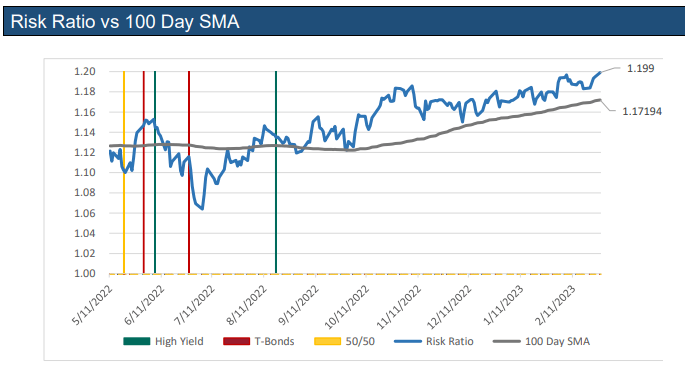
The Pacer Trendpilot US Bond Index uses an objective, rules-based methodology to implement a systematic trend-following strategy that directs exposure to one of the following positions:
- 100% to the iBoxx® USD Liquid High Yield Index,
- 50% to the iBoxx USD Liquid High Yield Index and 50% to the iBoxx USD Treasuries 7-10 Year Index or
- 100% to iBoxx® USD Treasuries 7-10 Year Index, depending on the value of the iBoxx USD Liquid High Yield Index divided by the value of the iBoxx USD Treasuries 7-10 Year Index (the “Risk Ratio”).
The use of these two ETFs changed as of 1/31/23. They replaced the S&P U.S. High Yield Corporate Bond Index and the S&P U.S. Treasury Bond 7-10 Year Index. Looks like the provider is the biggest change.
Source: paceretfs.com indices
The next piece explains when each underlying ETF will change its strategy.
paceretfs.com Index rules
The last column in the next table gives the date of the last strategy change for each ETF.
paceretfs.com Trendpilot
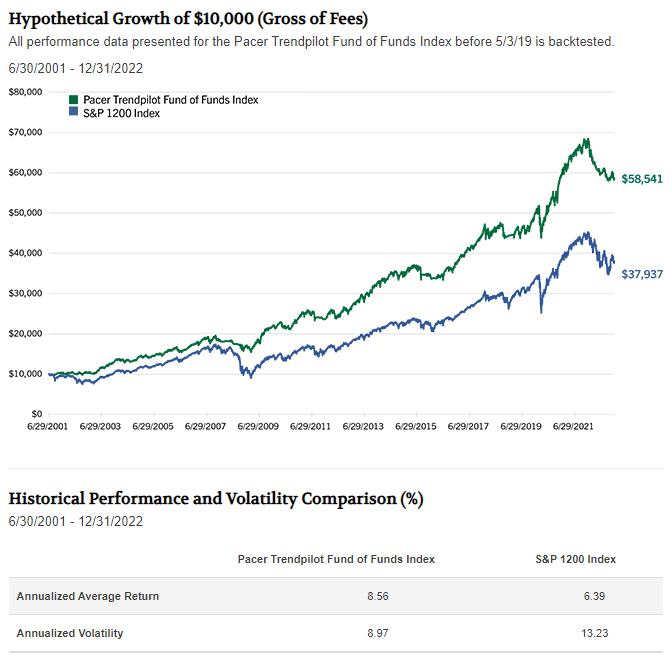
The Index developer provided this comparison, which doesn't include international equity or a bond component, so take that into consideration.
Actual results are not currently providing this outperformance.
Pacer Trendpilot Fund of Funds ETF review
Seeking Alpha describes this ETF as:
For its equity portion, it invests directly and through other funds in stocks of companies operating across diversified sectors. For its fixed income portion, it invests directly and through other funds in 3-Month US Treasury bills. The fund seeks to track the Pacer Trendpilot Fund of Funds Index . TRND started in 2019.
TRND has only $43.5m in AUM and provides a1.7% yield. Fees are 77bps, but this includes the fees paid to the ETFs owned.
TRND holdings review
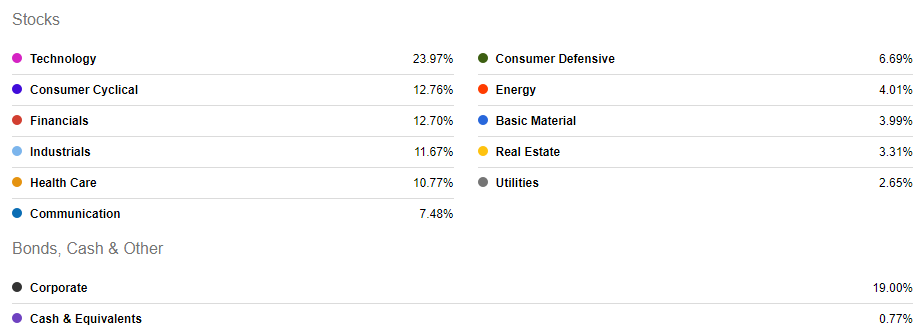
This reflects what each of the underlying ETFs hold.
seekingalpha.com TRND holdings
Based on Morningstar's classifications, TRND underweights Defensive stocks. The ETF is also heavily dependent on the US economy.
morningstar.com TRND countries
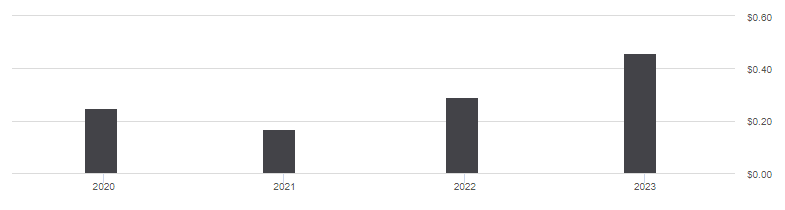
TRND distributions review
With annual payouts and a sub 2% yield, this is not an ETF for income investors.
Pacer Trendpilot US Large Cap ETF ( PTLC ) review
Seeking Alpha describes this ETF as:
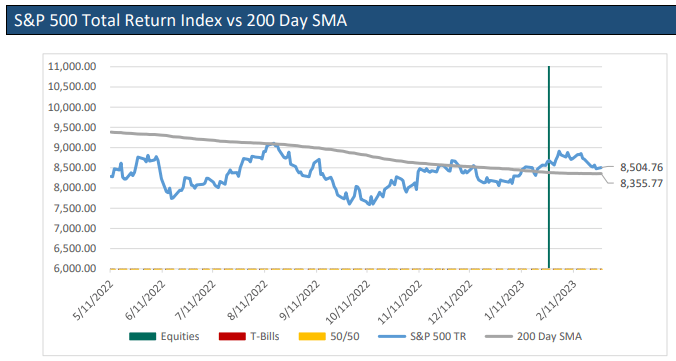
The Pacer Trendpilot US Large Cap ETF invests based on the Pacer Trendpilot US Large Cap Index. Based on the 200-business-day trend-line, the ETF shifts assets between the S&P 500 index stocks and 3-month T-bills. PTLC started in 2015.
PTLC has $2b in AUM and provides 1.3% yield. Fees are 60bps.
PTLC holdings review
This ETF is currently at 100% equity exposure. The sectors largely match what a holder of the SPDR S&P 500 ETF ( SPY ) would own.
paceretfs.com PTLC sectors
PTLC results
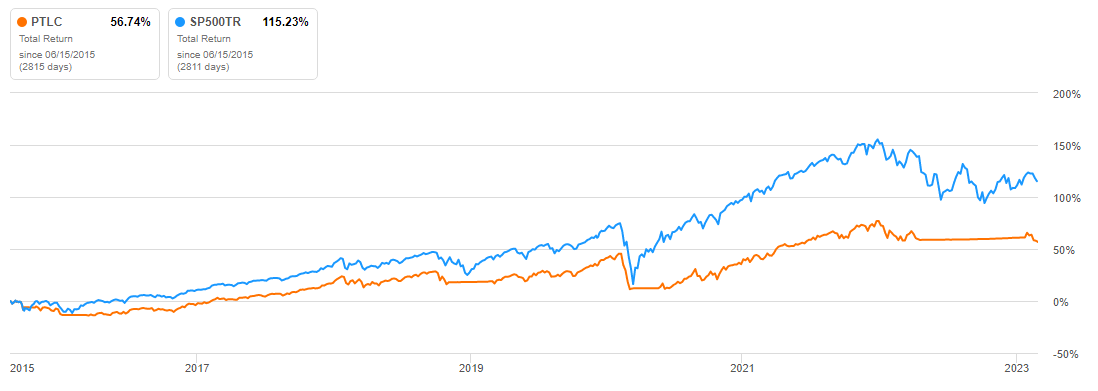
According to the ETF's Factsheet, PTLC was 100% T-Bills for the entire 4th quarter of 2022. I couldn't find more past allocations, but the next chart does not favor owning this ETF.
seekingalpha.com PTLC charting
While PTLC had much lower risk, as measured by their StdDev, the SPY ETF had better risk ratios. This is one No vote.
Pacer Trendpilot US Mid Cap ETF ( PTMC ) review
Seeking Alpha describes this ETF as:
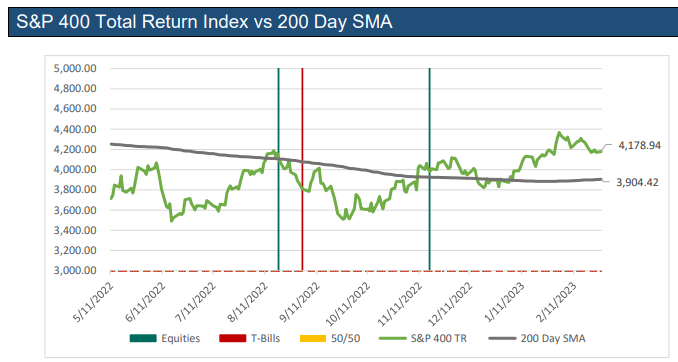
The Pacer Trendpilot US Mid Cap ETF invests based on the Pacer Trendpilot US Mid Cap Index. Based on the 200-business-day trend-line, the ETF shifts assets between the S&P MidCap 400® Index stocks and 3-month T-bills. PTMC started in 2015.
PTMC has $415.9m in AUM, with a 0.76% yield. Fees are 60bps.
PTMC holdings review
This ETF is currently at 100% equity exposure. The sectors match what a holder of the SPDR S&P MidCap 400 ETF ( MDY ) would own.
paceretfs.com PTMC sectors
PTMC results
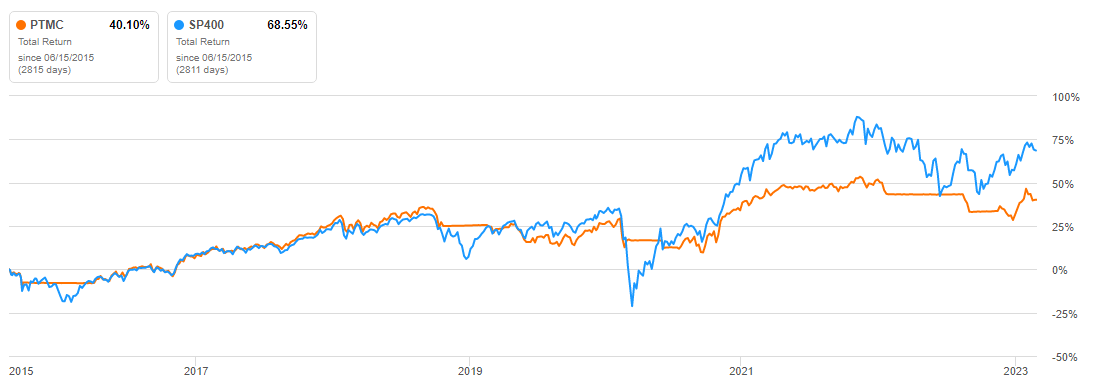
PTMC went from 100% Equities, to 100% T-Bills, back to 100% Equities since last May. While the chart is somewhat better, PTMC has trailed the index since the market recovered from COVID.
seekingalpha.com PTMC charting
PTMC has trailed the Index every calendar year since 2018. Again, with less risk but inferior risk ratios. Lacking superior results means another No vote.
Pacer Trendpilot 100 ETF ( PTNQ ) review
Seeking Alpha describes this ETF as:
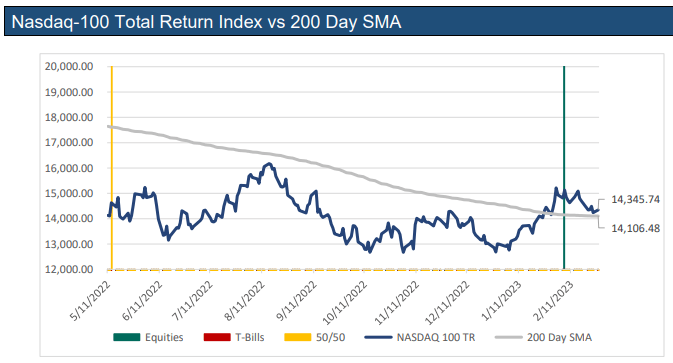
The Pacer Trendpilot 100 ETF invests based on the Pacer NASDAQ-100 Trendpilot Index. Based on the 200-business-day trend-line, the ETF shifts assets between the NASDAQ-100® Index stocks and 3-month T-bills. PTNQ started in 2015.
PTNQ has $677m in AUM, with a .61% yield. Fees are 65bps.
PTNQ holdings review
This ETF is currently at 100% equity exposure. The sectors match what a holder of the Invesco QQQ Trust ( QQQ ) would own.
paceretfs.com PTNQ sectors
PTNQ results
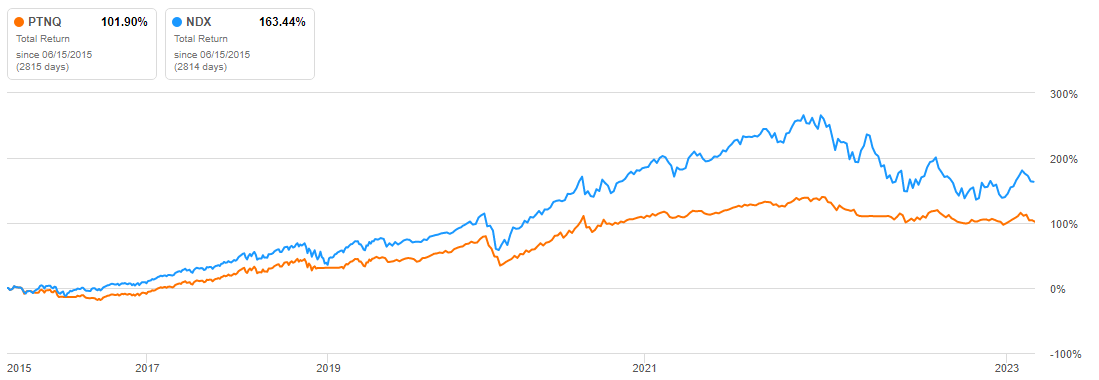
Last May, PTNQ went to a 50/50 mix and stayed there until early February when it became 100% equities. While that helped in 2022, the Index did better the prior three years and so far in 2023.
seekingalpha.com PTNQ charting
With risk results the same as the other US equity ETFs, this becomes another No vote.
Pacer Trendpilot International ETF ( PTIN ) review
Seeking Alpha describes this ETF as:
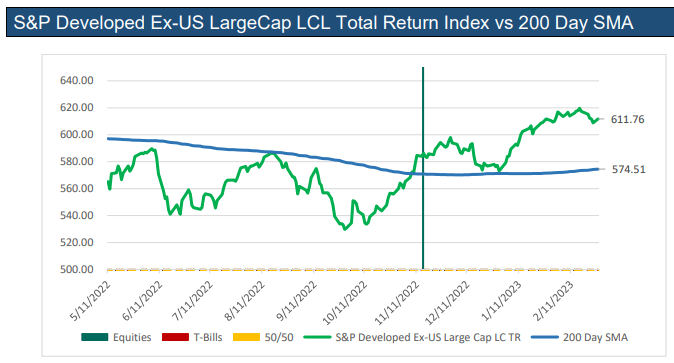
The Pacer Trendpilot International ETF invests based on the Pacer Trendpilot International Index. Based on the 200-business-day trend-line, the ETF shifts assets between the S&P Developed Ex-US Large-Cap index stocks and 3-month T-bills. PTIN started in 2019.
PTIN has $117.8m in AUM and has a 0.38% yield. Fees are 68bps.
PTIN holdings review
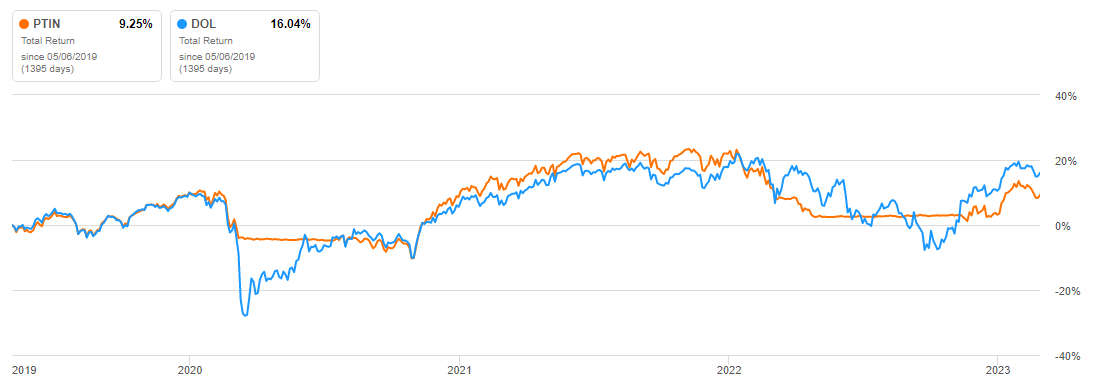
This ETF is currently at 100% equity exposure. The sectors best match what a holder of the WisdomTree International LargeCap Dividend Fund ( DOL ) would own. I did not find any ETF using the exact index PTIN measures itself against.
paceretfs.com PTIN sectors
PTIN results
PTIN was also 100% T-Bills until mid-November, when it switched to 100% equities. Unlike the others, PTIN shows times of much better results, but still trails the comparison ETF I picked since PTIN started in 2019.
seekingalpha.com PTIN charting
Risk data continues to show the trending process reduces risk, but also returns to the extent that the risk ratios are not in its favor. Pacer Advisors does provide a comparison to the index; it means another No vote.
paceretfs.com
Pacer Trendpilot US Bond ETF ( PTBD ) review
Seeking Alpha describes this ETF as:
The Pacer Trendpilot US Bond ETF invests based on the Pacer Trendpilot US Bond Index. Based on the 200-business-day trend-line, the ETF shifts assets between the S&P U.S. High Yield Corporate Bond Index bonds and the S&P U.S. Treasury Bond 7-10 Year Index bonds. PTBD started in 2019.
PTBD has $264.4m in AUM, and provides a 6.82% yield. Fees are 60bps.
PTBD holdings review
This ETF is currently at 100% risky bond exposure. The sectors match what a holder of the iShares iBoxx $ High Yield Corporate Bond ETF ( HYG ) would own.
paceretfs.com PTBD sectors
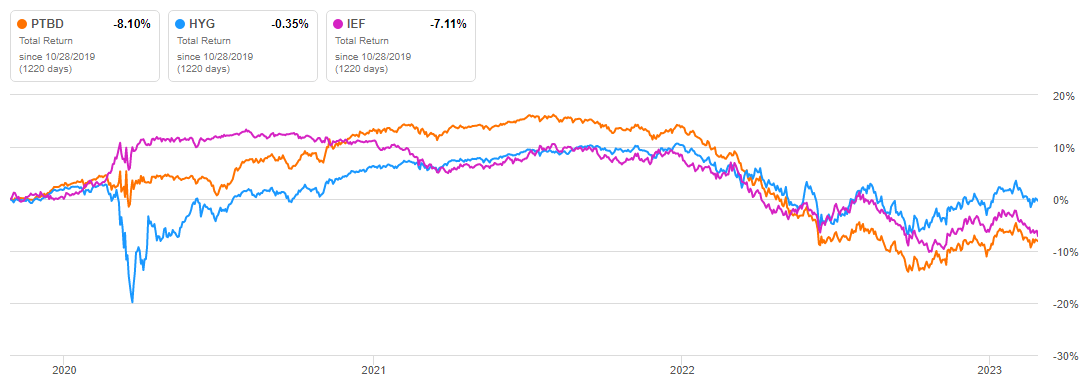
If PTBD was below the trend-line, it would be matching the iShares 7-10 Year Treasury Bond ETF ( IEF ) holdings.
PTBD results
This ETF has changed allocations the most since last May. Unlike the equity ETFs, PTBD can invests in two styles of bonds. I chose two ETFs to represent those options; both have outperformed PTBD.
seekingalpha.com PTBD charting
The risk ratios places PTRBD between the two other bond ETFs. Clean sweep: No vote here too.
Portfolio strategy
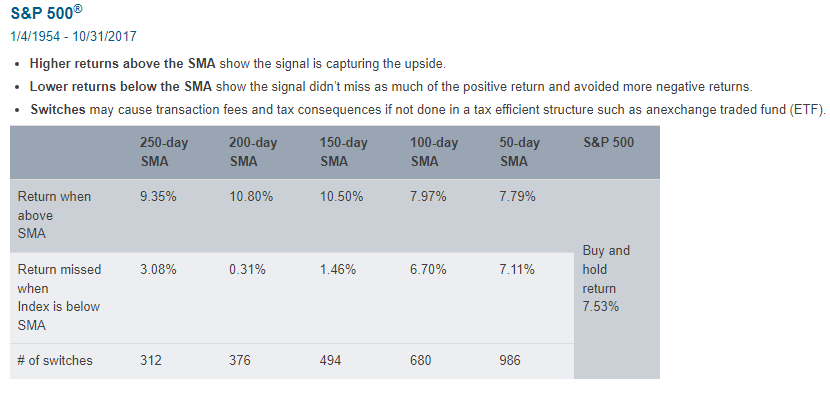
Assuming an investor wanted to use a moving-average strategy, then what length do they use? Too short, constant trading; too long, miss upswings and capture more of the downswing. Back in 2017, Pacer published the results from using different ones against the S&P 500 results.
The 200-day MA provided the best results, which is why their Trendpilot ETFs use that period of time. According to their documentation, they wait five trading days for confirmation before executing trades.
While backtesting showed promise, in practice the results have not. With none of the held ETFs showing superior results except for lower StdDevs, I would pass on the whole set.
Final thoughts
I mentioned trend following is like momentum investing. I recently wrote SPMO: A Factor ETF That Benefits Investors Over SPY , which covered that well-known Momentum ETF.
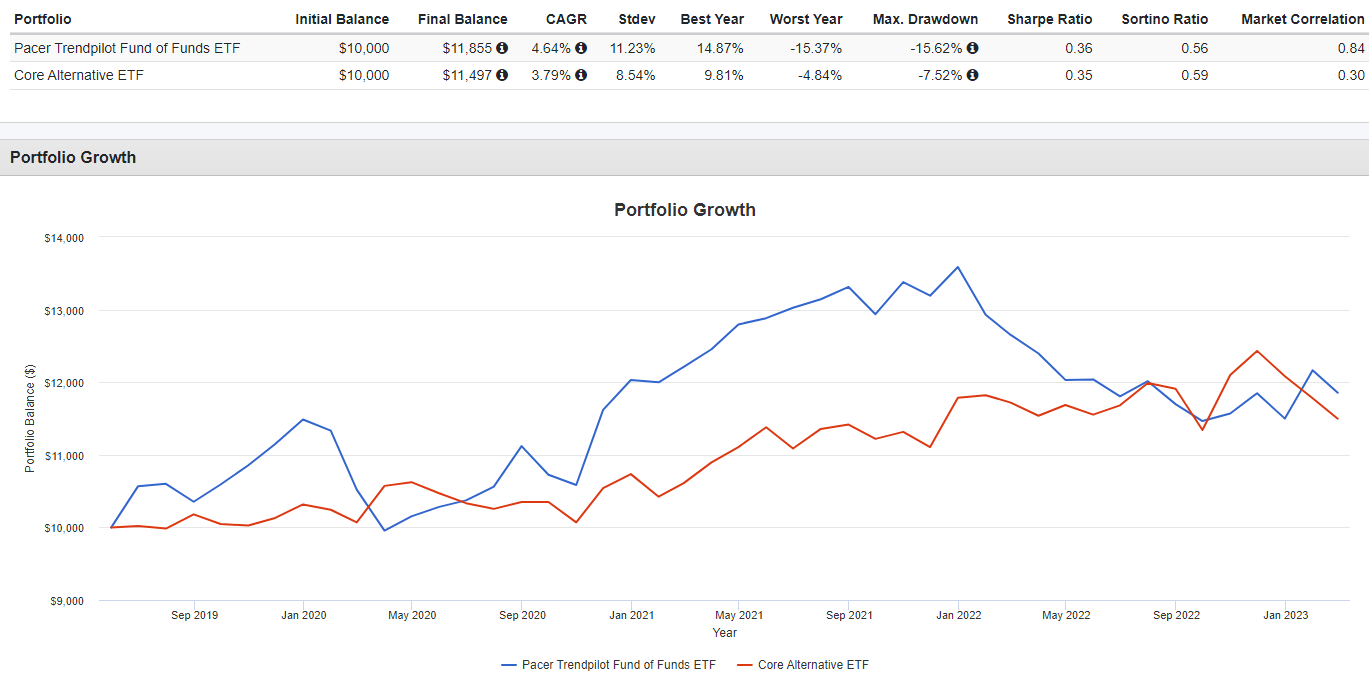
One thing the Trendpilot series has provided is less movement, as measured by their StdDev, than the targeted index. My recent article CCOR Vs. JEPI: Trading Income And Some Return For Much Less Risk looked at the CCOR ETF as a less risky alternative. Here is how TRND and CCOR match up.
While currently TRND has the higher CAGR, CCOR provided a smoother ride. For investors looking to allocate some part of their portfolio to such funds, I would prefer CCOR over TRND. For those interested in comparing the four equity Trendpilot ETFs, the next chart is for you.
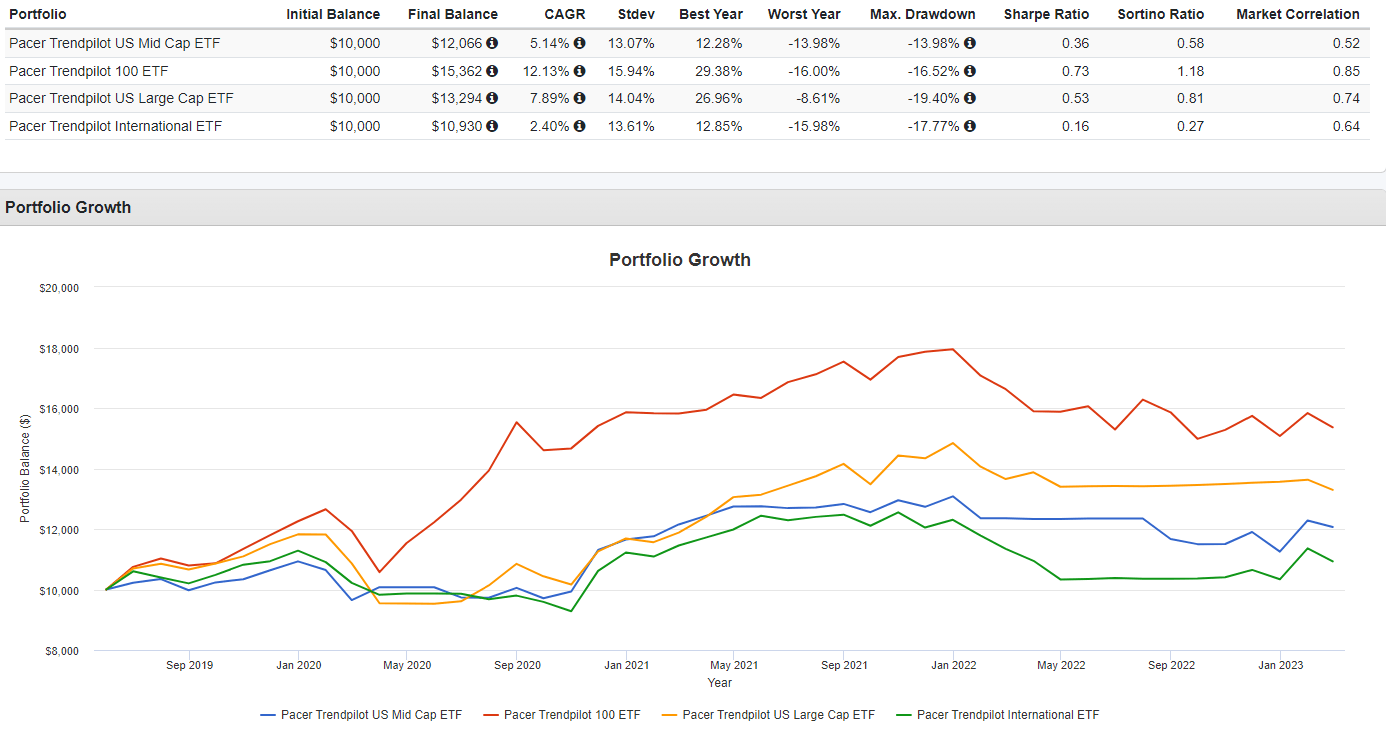
For further details see:
TRND: An ETF For Trend Following Investors