TFC - Truist Financial: Buying In A Solid Base At Technical Support Levels
2023-11-20 17:43:14 ET
Summary
- Truist Financial Corporation faced challenges and strategic adjustments in Q3 2023, resulting in a decrease in Adjusted PPNR and total revenues.
- The bank showed resilience with a slight improvement in net interest margin and stable asset quality indicators.
- The stock price of Truist Financial Corporation is exhibiting a strong bullish formation, potentially poised for gains.
Truist Financial Corporation ( TFC ) faced a compl ex financial scenario in Q 3 2023, marked by challenges and strategic adjustments. The Adjusted Pre-Provision Net Revenue (PPNR) experienced a decrease due to reduced revenues. This period saw a decline in total revenues, with net interest and noninterest income witnessing downturns, reflecting the bank's strained revenue streams. This article analyzes the financial results of Truist Financial Corporation, focusing on Q3 earnings. It also delves into a technical analysis of the company's stock price to determine future trends and potential investment prospects. The analysis reveals that the stock price rebounds from a technical robust support level, indicating signs of a solid long-term bottom formation.
Financial Performance and Strategic Adjustments
Truist Financial Corporation reported a net income of $1.1 billion, translating to $0.80 per diluted share back on October 19th. However, this figure includes significant merger-related and restructuring charges amounting to $75 million, or $0.04 per share, primarily for severance in restructuring initiatives. Adjusted PPNR was $2.2 billion, marking a decrease of 9.4%, mainly due to lower revenues. Total revenues saw a decline of 4.1%, with net interest income dropping by 1.6% from Q2 2023, a slight decrease compared to the 6.1% decline from Q1 2023 to Q2 2023.
On the other hand, the bank's net interest margin improved marginally by four basis points, suggesting some success in balance sheet optimization. However, average loans and leases declined by 2.5% due to the sale of a non-core student loan portfolio and reductions in the commercial and industrial portfolio. Average deposits remained stable, and nonperforming assets were flat. There was an improvement in capital strength, with the CET1 ratio rising to 9.9%, a 29 basis point increase, and a robust Consolidated Liquidity Coverage Ratio [LCR] of 110%.
The CEO emphasized the company's transformative efforts to enhance financial performance, focusing on simplifying the organization, reducing expenses, and prioritizing core clients. The bank is on track with its $750 million cost savings program, aiming to restrict expense growth to a maximum of 1% in 2024. Despite these efforts, asset quality shows signs of normalization, with the Allowance for Loan and Lease Losses (ALLL) ratio increasing by six basis points and a net charge-off ratio of 51 basis points, slightly down due to impacts from the student loan sale.
Taxable-equivalent net interest income for Q3 2023 was down by 1.6% from Q2 2023 but saw a more substantial decrease of 4.3% compared to Q3 2022. This decline is attributed to lower earning assets and higher funding costs, partially offset by higher market interest rates. Notably, the net interest margin experienced a slight increase due to balance sheet optimizations, such as paying down higher-cost borrowings and improving spreads on new and renewed loans.
Noninterest income declined compared to Q2 2023, mainly due to seasonal factors in insurance income, reduced deposit service charges, and lower investment banking and trading income. However, it remained relatively stable year-over-year, with growth in other income and insurance income offsetting declines in service charges and investment banking income.
Noninterest expenses were relatively flat compared to Q2 2023 but increased compared to Q3 2022. The bank faced higher personnel, other expenses, and regulatory costs, although merger-related and restructuring charges declined due to the completion of integration activities.
Truist Financial Corporation's Q3 2023 financial performance presents a complex picture of challenges and strategic adjustments. Despite the decline in total revenues and net interest income, the bank showed resilience with a slight improvement in net interest margin and stable asset quality indicators. As outlined by the CEO, the efforts towards organizational simplification, cost management, and balance sheet optimization reflect a strategic direction aimed at navigating through a fluctuating financial landscape and positioning the bank for future stability and growth.
Exploring the Bottom Formation Process
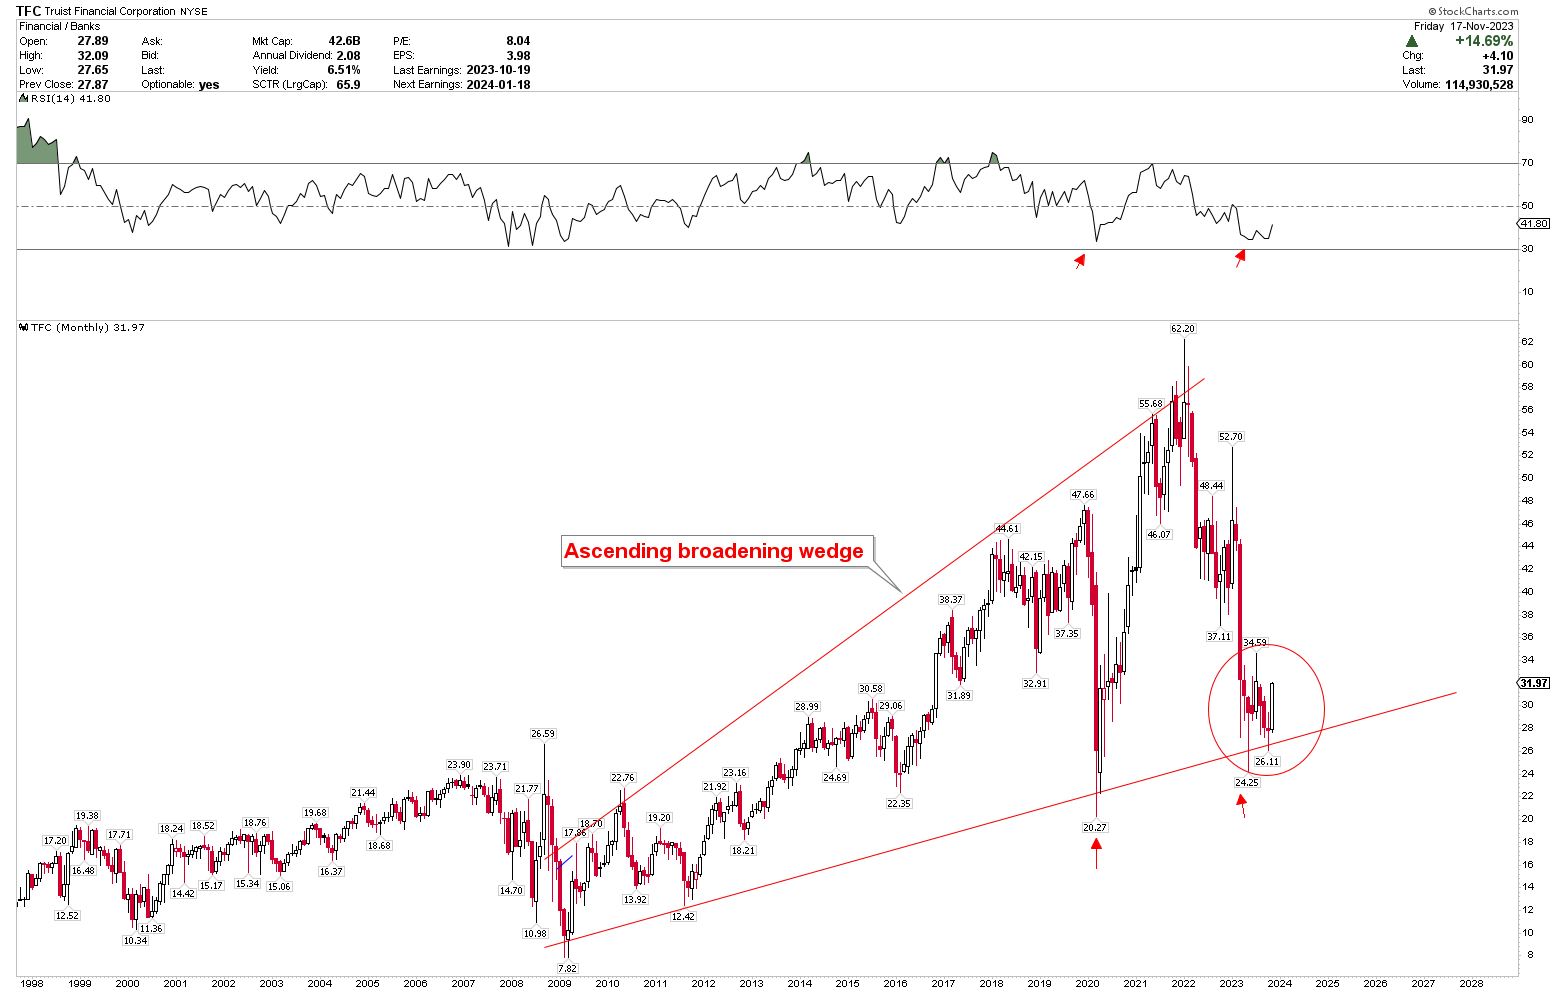
The stock price of Truist Financial Corporation experienced a significant low at $7.82 in 2009, primarily due to the global financial crisis that began in 2007-2008. This crisis, driven by a housing market collapse and subsequent mortgage-backed securities failures, profoundly impacted the banking sector. Banks, including those that would later form Truist, faced intense scrutiny and regulatory changes, leading to a lack of investor confidence. The economic downturn led to increased loan defaults and a squeeze on credit markets, severely affecting Truist's predecessors' profitability and stock value. However, post-2009, Truist and its legacy institutions embarked on a path of recovery and restructuring. Improved regulatory oversight and an economy on the mend helped restore investor confidence. Truist's focus on diversifying its services, enhancing digital banking platforms, and prudent financial management played a crucial role in its steady growth. The bank benefited from the broader economic recovery in the United States, witnessing a rise in consumer and business lending. Its growth was also propelled by strategic acquisitions and mergers, including the significant merger of equals between BB&T and SunTrust in 2019. This expansion improved its market share and operational efficiency, increasing its stock value in 2019 to mark a high of $47.66.
TFC Monthly Chart (stockcharts.com)
However, the stock price of Truist Financial Corporation dropped sharply in 2020, mirroring a global trend among financial stocks due to the COVID-19 pandemic. The pandemic caused a massive economic shock, leading to a temporary shutdown of economic activities, surging unemployment rates, and heightened economic uncertainty. As a result, there was a significant decrease in consumer spending and borrowing, adversely affecting the banking sector's profitability. Additionally, the Federal Reserve's decision to slash interest rates to near-zero to support the economy further squeezed banks' interest income, impacting their revenue streams. Despite these challenges, Truist demonstrated resilience and adaptability in navigating the pandemic's impacts. The bank capitalized on its robust digital infrastructure to continue providing services amidst lockdowns and social distancing measures. It also played a vital role in distributing relief funds and loans under government programs like the Paycheck Protection Program [PPP], enhancing its reputation and client base. With the gradual recovery of the economy and the effectiveness of global vaccination programs, investor confidence returned, leading to a rally in Truist's stock. Truist's strong fundamentals bolstered this recovery, continued focus on digital transformation, and a rebound in consumer and business lending, allowing the stock to reach new highs at $62.62.
However, the significant volatility in the market, characterized by a sharp decline in 2020 followed by a robust recovery, has led to an ascending broadening wedge pattern. This pattern was particularly evident when the stock reached an all-time high of $62.62, only to fall dramatically back to the strong support level of the ascending broadening wedge, hitting a 2023 low at $24.35. Since reaching this low, the stock price has been oscillating around this critical support zone, suggesting the potential establishment of a bottom at these levels. The November 2023 monthly candle further hints at a strong reversal, indicating that the bottom may form at this juncture. Additionally, the RSI is rebounding from lower levels, signaling signs of recovery.
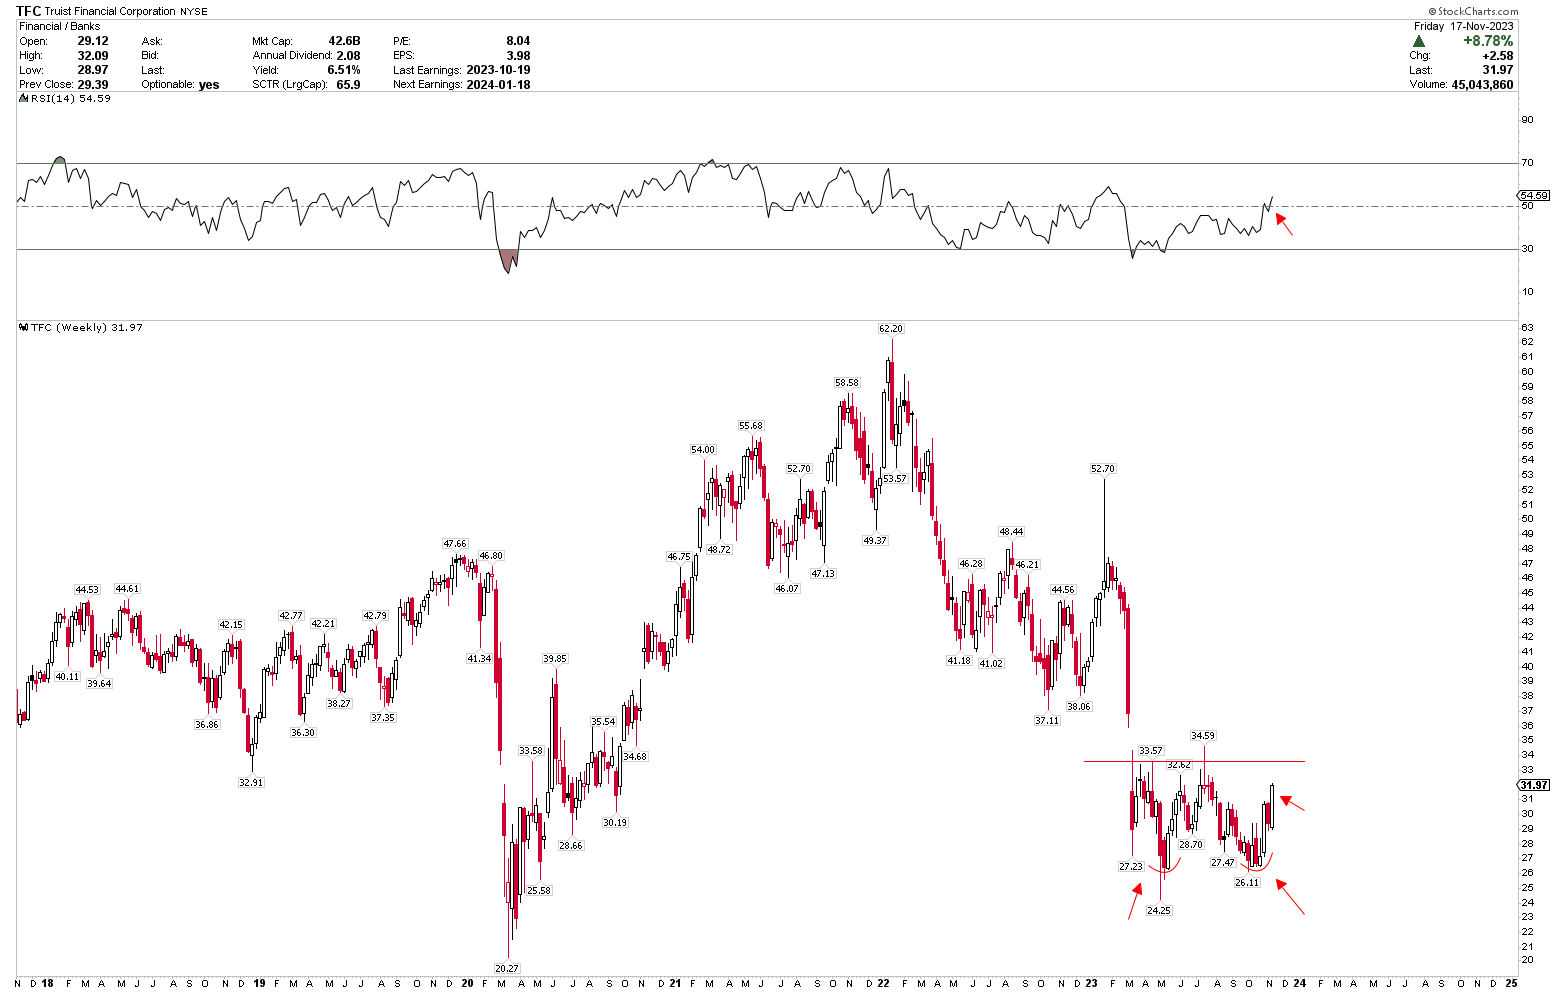
To gain a more comprehensive understanding of this bullish trend, an examination of the weekly chart is insightful. It reveals a double bottom pattern at the prices of $24.25 and $26.11, with a neckline around $34. A weekly closure above $34 would confirm the formation of a bottom and suggest potential upward movements in stock prices. The RSI crossing above the midline 50 further reinforces this bullish outlook.
TFC Weekly Chart (stockcharts.com)
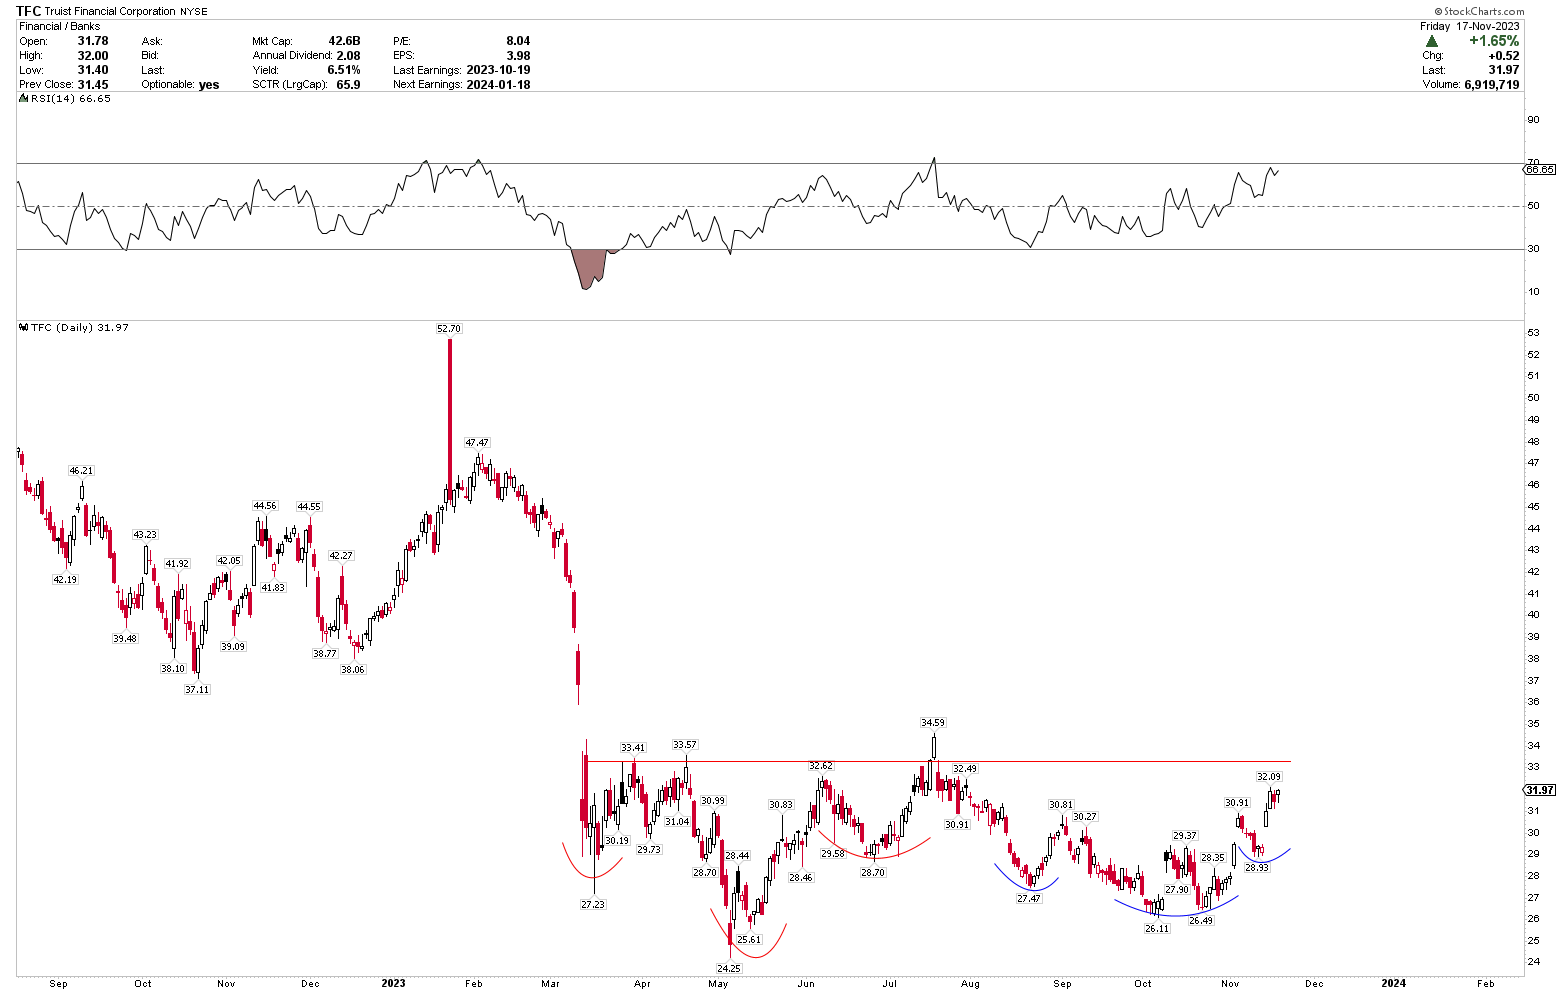
Delving deeper, the daily chart below underscores an inverted head and shoulders pattern during this bullish phase, which points to the likelihood of an upside breakout in the market.
TFC Daily Chart (stockcharts.com)
In light of this analysis, the stock price of Truist Financial Corporation appears to be exhibiting a strong bullish formation, poised for potential gains. Investors may consider entering at the current levels in anticipation of future price increases.
Market Risks
The bank reported a decrease in net income and adjusted PPNR, reflecting a challenging operating environment. The decline in total revenues by 4.1%, with net interest income and noninterest income both falling, indicates pressures on the bank's primary revenue streams. Though narrower than in previous quarters, the decrease in net interest income and the drop in noninterest income due to lower insurance income and reduced deposit service charge fees suggest vulnerability to changing market conditions, such as fluctuating interest rates and client behavior.
The bank's focus on balance sheet optimization, evidenced by a marginal improvement in net interest margin, may not fully offset the risks associated with a declining loan portfolio. The 2.5% reduction in average loans and leases, primarily due to the sale of a non-core student loan portfolio and reductions in the commercial and industrial portfolio, raises concerns about the bank's growth prospects in lending activities.
Bottom Line
In conclusion, Truist Financial Corporation's Q3 2023 results offer a multifaceted view of its current financial status and prospects. While the company faced significant challenges, including a decline in total revenues and adjustments in its loan portfolio, there are also positive indicators of resilience and strategic adaptability. The bank's management has shown a commitment to restructuring and optimization efforts, which are starting to yield marginal improvements in net interest margin and capital strength.
From a technical analysis perspective, the stock price of Truist Financial Corporation reveals a bullish trend. The formation of a solid long-term bottom, as indicated by the strong rebound from the long-term support level and bullish pattern formations, suggests a potential upside for investors. The appearance of an ascending broadening wedge, double bottom, and inverted head and shoulders pattern further underpin the bullish outlook for the stock. Investors may consider buying Truist Financial Corporation at its current price, with the strategy of adding to more positions, if the stock price experiences further declines, provided it stays above the $24 threshold.
For further details see:
Truist Financial: Buying In A Solid Base At Technical Support Levels