TRMK - Trustmark Bank Sale Inevitable: High Costs Low Returns
2023-04-10 14:05:10 ET
Summary
- Trustmark is a 130-year-old $18 billion bank headquartered in Jackson, Mississippi. Trustmark's challenges are the same facing most of the nation's 4,427 banks.
- Trustmark has two core problems: 1) Its expense structure is stubbornly high. 2) It has failed since 2007 to generate returns sufficient to cover the bank's cost of capital.
- Result: Stock price flat since 2003 and a dividend that has not increased since 2007. Since 2011, EPS up 21%, non-interest expense up 69% (compensation expense 60%, Director compensation 130%).
- Trustmark has two options and the best one is to sell. If it remains independent, its earnings challenges will only intensify over the next decade.
- Trustmark is microcosm of the US banking industry. Significant consolidation ahead. This will likely be the topic of my next post.
Trustmark and US Banking: Today and Tomorrow
Trustmark National Bank is the bank subsidiary of Trustmark Corporation ( TRMK ).
With assets of $18 billion at year-end 2022, Trustmark is the 107th largest bank in the US and 221st most profitable.
Per the bank's FDIC Call Report (see bankregdata.com), Trustmark operated 184 branches at YE 2022: 103 in Mississippi, 42 in Alabama (plus a Georgia Loan Production Office), 15 in Tennessee (Memphis area), 15 in Florida (Panhandle), and 12 in Texas (Houston). (The bank's recent 10-K indicates that Trustmark operates 169 offices, suggesting 15 closures since year-end.)
At the heart of Trustmark's profitability challenge is the bank's high cost of operation. Trustmark lags peers in Efficiency, Productivity, and Expense Management.
The bank's normalized EPS has improved to ~$2.00 a share compared to $1.65 in 2011, an improvement of 21%. In contrast, the bank's non-interest expense rate (x-litigation expense, see below) has increased by 69%.
The expense management challenges Trustmark faces today will become even more acute over the next decade as banks compete for a new generation of bankers capable of navigating an industry on the brink of massive technological and public policy disruptions.
Trustmark's high-cost structure is a function of several factors, chief among those is its inefficient, low-scale branch network outside of Mississippi, as well as a business model that combines traditional retail and commercial banking with less efficient, more expensive insurance and wealth management.
Trustmark, like all banks, has two choices in 2023:
- Commit to be an industry leader in order to survive the next decade.
- Sell the bank in recognition that the bank lacks the talent (skills) and capital needed to emerge as an industry leader over the next decade.
My view is that Trustmark's directors will serve their shareholders best by accepting the reality of option two as soon as possible. And they are not alone in this regard.
Key Shareholder Statistics at a Glance
Sources: Ycharts, Seeking Alpha.
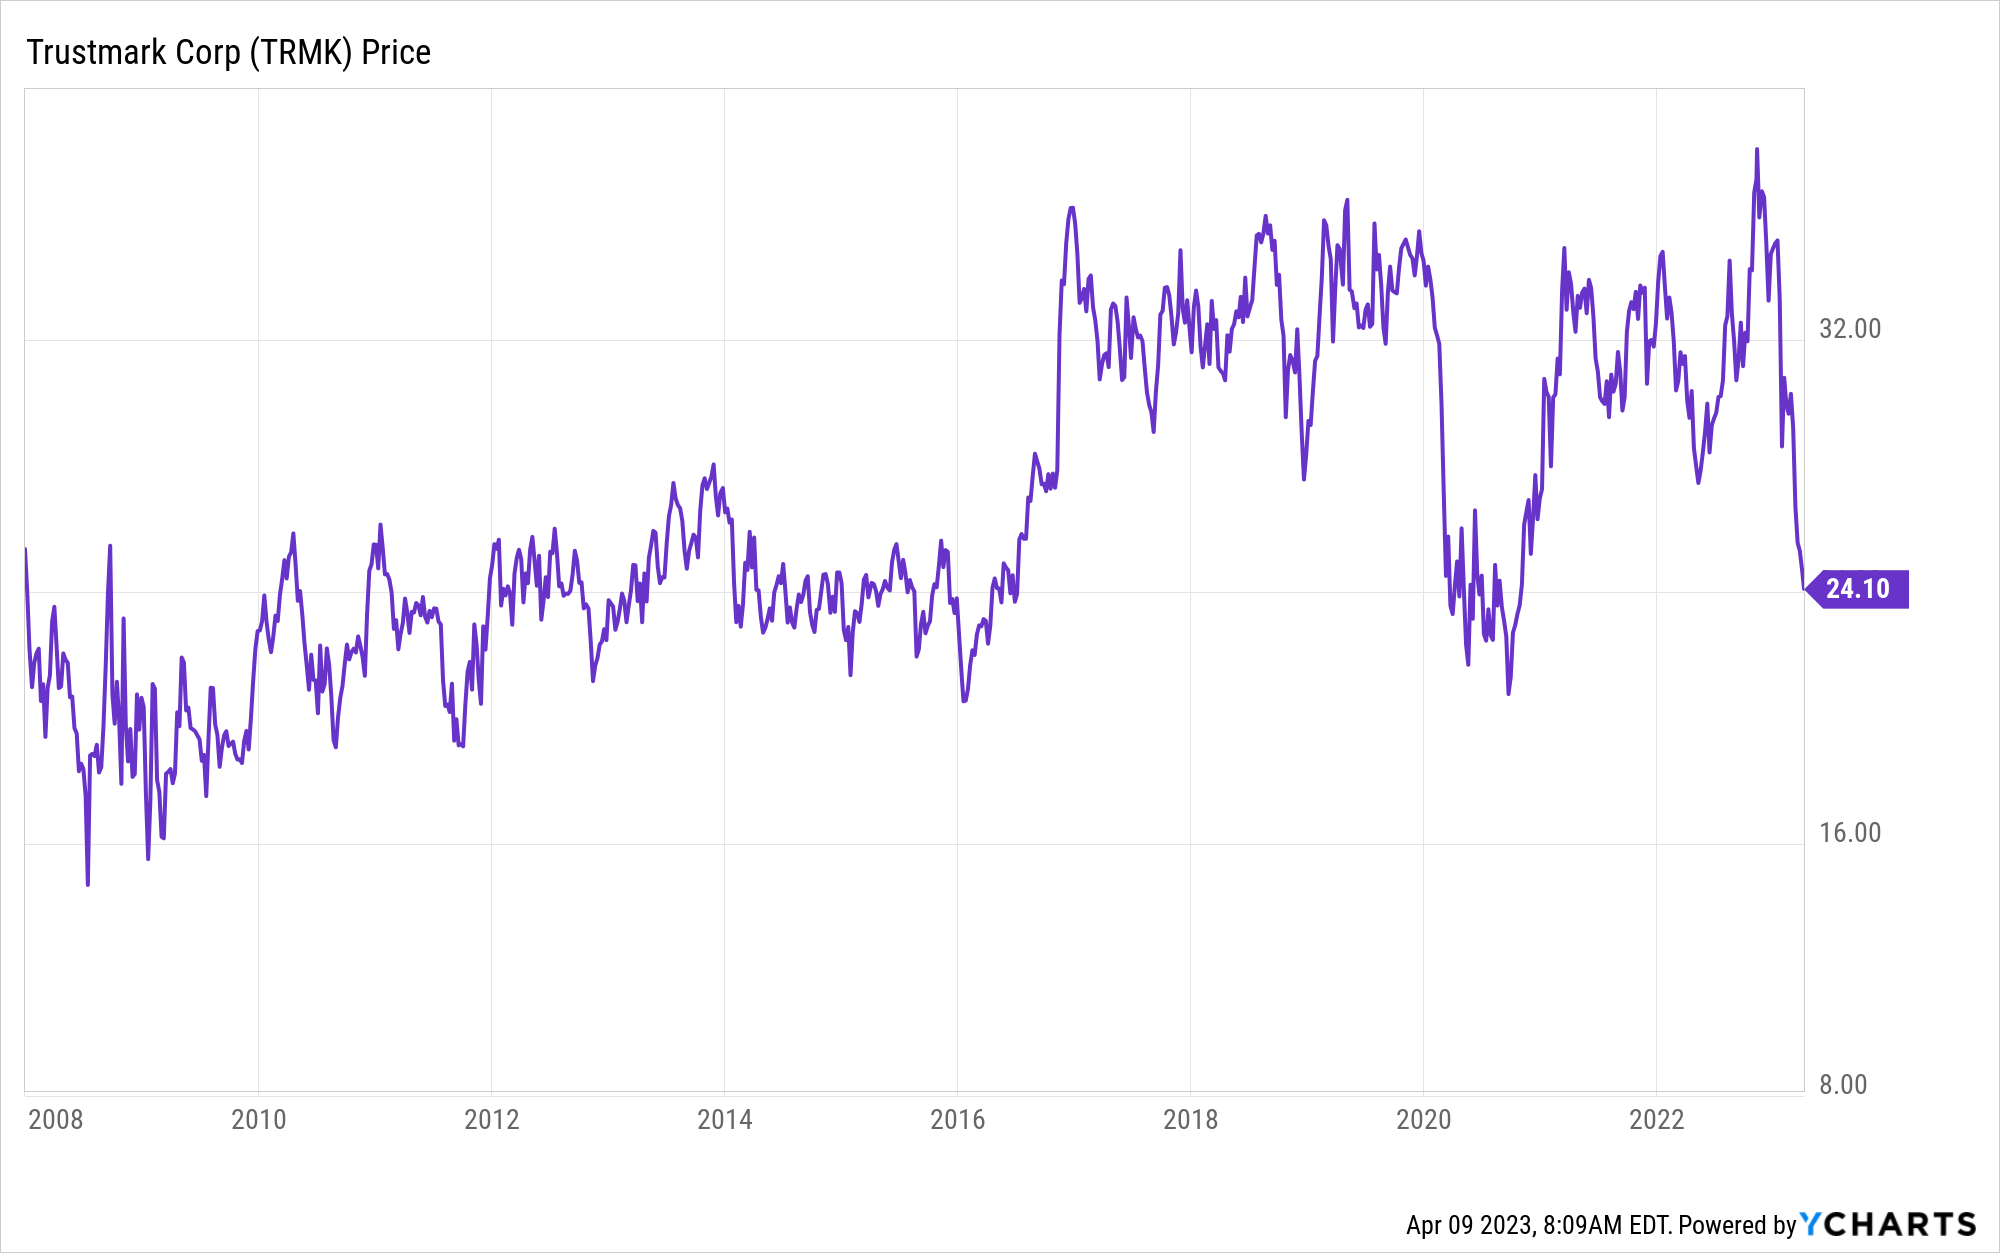
- April 7 closing price: $24.10
- One month price: -14%
- YTD price: -31%
- 1-year price: -19%
- 5-year price: -21%
- 10-year price: -.7%
- 20-year price: +1%
- YTD price range: $23.80-$35.10
- 4Q EPS: $0.68, miss by $0.11.
- Analyst price target $29.83. (6 analysts, 1 Outperform & 5 Hold)
- Share count: 60.98 million.
- Avg. Daily Volume: ~285,000.
- Market Cap: $1.47 billion.
- Dividend: $0.92 annual
- Dividend Yield: 3.82%
- Beta (5-year): 0.78
Price History
TRMK Price History (Ycharts)
Key Bank Metrics
Data Source: FDIC Call Reports/Bankregdata.com.
- Avg. ROE since 2003: 10.0%. Risk-adjusted ROE: 6.8%
- Avg. ROE since 2010: 8.3%. Risk-adjusted ROE: 7.1%
- Avg. Efficiency Ratio Recent 10 Years: 70.8 (Peers 2022: 54)
- Non-Interest Expenses/Assets 3Q 2022 YTD: 2.83% (Peers 2.23%)
- Assets/FTE: 4Q 2022: $6.6 million (Peers $9.9 million)
- Texas Ratio 4Q 2022: 5.2% (Peers 4.7%)
- Net Credit Loss 2022: 0.13% (Peers 0.31%).
- Net Credit Losses Rolling 4-Quarter History since 2003: 0.26%.
- Net Interest Margin 2022: 2.87% (Peers 3.26%).
- Net Interest Margin 4Q 2022: 3.35% (Peers 3.52%).
- Yield 2022: 3.10% (Peers 3.68%).
- Yield 4Q 2022: 3.98% (Peers (4.39%).
- Funding Costs 2022: 0.23% (Peers 0.43%).
- Funding Costs 4Q 2022: 0.63% (Peers 0.87%).
Interpretation of Key Metrics
- TRMK is a high-cost bank.
- The bank lags peers in Efficiency and Productivity.
- Credit history appears sound though emerging Watch Item as reversion to mean indicates rising credit costs in 2023-2024.
- Commercial Real Estate exposure is Watch Item, but TRMK is not a community bank outlier.
- Below peer average Net Interest Margin: superior funding costs do not offset inferior yield on earning assets.
- Funding costs major Watch Item when first quarter earnings are released April 24. Per the bank's recent 10-K , TRMK estimates a 3.3% improvement to estimated Net Interest Income if there is a 200-basis point change in interest rates, 1.7% at 100-basis points, and -1.8% if rates fall by 100-basis points.
Liquidity
- YE 2022: Held-to-Maturity Securities' paper losses = 5.49% of equity capital.
- YE 2022: Cash + Securities Maturing < 3 Mos. = 14% of assets.
- YE 2022: Securities Maturing 3 Mos. to 3 Years = 17% of assets.
- Meaning: Liquidity is ok, but clearly a Watch Item management must address in 1Q earnings report and call.
2022 Litigation Expense
As management discussed during its most recent earnings call, 2022 earnings fell precipitously from the prior year because of 4Q expenses associated with the resolution of long-standing litigation.
The litigation expense does not influence my view of the bank's earnings engine nor current stock price.
10-K Disclosure: Critical Audit Matter
For the second consecutive year, per the bank's 10-K , TRMK has not received an Unqualified Audit opinion from its outside audit firm.
The auditor identified a Critical Audit Matter related to Trustmark's "Allowance for Credit Losses, LHFI Reasonable and Supportable Forecasts." See Auditor opinion in 10-K:
"The critical audit matter communicated below is a matter arising from the current period audit of the financial statements that was communicated or required to be communicated to the audit committee and that: (1) relates to accounts or disclosures that are material to the financial statements and (2) involved our especially challenging, subjective, or complex judgments. The communication of the critical audit matter does not alter in any way our opinion on the financial statements, taken as a whole, and we are not, by communicating the critical audit matter below, providing a separate opinion on the critical audit matter or on the account or disclosures to which it relates."
My interpretation: 1) Based on my review of many recent bank 10-Ks, Trustmark is among a number of banks that have this same Critical Audit Matter. 2) That said, many do not. 3) As this Critical Audit Matter was identified verbatim when the 2021 10-K was issued, I question why this Matter was not closed within the past year to the satisfaction of the audit firm. 4) As a rule, I prefer to invest in banks that have Unqualified audit opinions.
For further background on auditor classifications and accounting for loans, see this PWC Viewpoint .
My view is that this Critical Audit Matter is a Watch Item, but probably not cause for significant concern. I have long been critical of FASB's 2016 decision to impose the "Current Expected Credit Losses" methodology on banks. The new methodology is arcane and not clearly superior to the method it replaced. It also places enormous accountability on outside audit firms to attest to the CECL reporting. I can understand why Critical Audit Matters still exist even though the industry has three years of experience with CECL.
One other observation about the 10-K : To Trustmark's management's credit, the bank issued its 2022 10-K on February 16. This is one of the earliest dates among banks I follow. In fact, at least one bank I follow has yet to issue its 2022 10-K much to my concern. For Trustmark to issue a 10-K earlier than peers, the bank must have a well-oiled internal accounting function as well as a strong working relationship with outside auditors.
Key Performance Chart
Profitability & Cost of Capital
There is no more important metric for bank investors than the return a bank earns on shareholder capital.
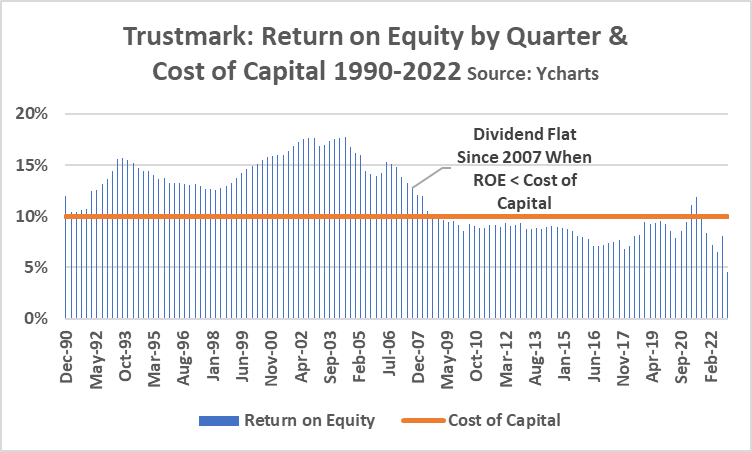
The chart below shows Trustmark's quarterly Return on Equity since 1990. It also shows a second line which is my estimate of the bank's long-term cost of capital of 10%.
If anything, the 10% cost of capital is too low in today's interest rate environment where an investor can earn 4%+ from risk-free Treasuries.
But let's assume the bank's long-term cost of capital is 10%. Herein lies the heart of the challenge facing long-term Trustmark shareholders: The bank does not earn profits sufficient to cover the bank's cost of capital.
Consequently, the bank does not grow shareholder value. Dividends and stock price are flat and will remain so until the bank generates sustained ROE profitability of 10%+.
And as a point of fact, Trustmark's ROE numbers are decent by industry standards. Though not a leader, its long-run profitability is not out of line with most banks in its peer group. The decisions and choices in front of Trustmark's board are shared by other bank boards across the country.
TRMK ROE and Cost of Capital (Ycharts)
Valuation Metrics
- P/E: 20.8x. Avg. since 2000: 14.6x; 10-year average: 15.2x.
- Forward P/E: 10.3x based on current 2023 analyst estimates.
- Price to Tangible Book Value: 1.51x (10-year average 1.76x).
Long-term investors in Trustmark might argue that the directors should not sell at this time because of recent share price weakness.
On the surface, that argument seems valid since the stock price has declined 19% over the past twelve months.
However, the next chart suggests that the current price is in line with the historic valuation trend.
Graham Multiple
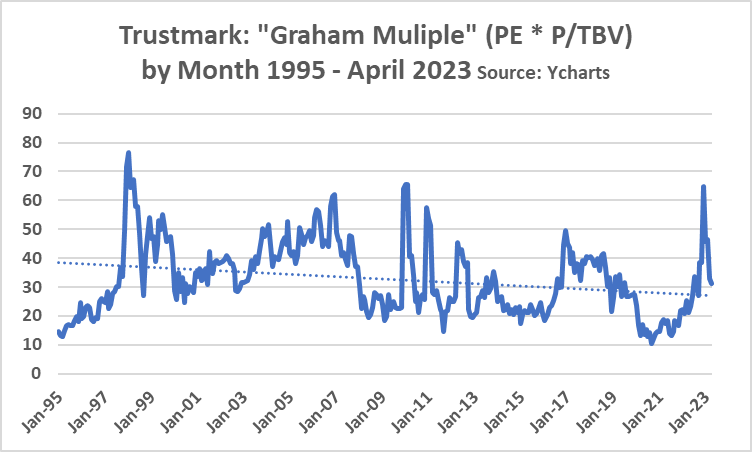
This next chart is what I call a modified "Graham Multiple." This ratio is a modification of the ratio used by Benjamin Graham, mentor of Warren Buffett. Graham's preferred valuation metric was Price to Earnings (P/E) times Price/Book (P/B).
I modified that ratio for banks by using Price to Tangible Book (P/TBV) rather than P/B. The reason for the tweak has to do with the amount of Goodwill (intangible asset) sitting on the balance sheet of acquisitive banks.
As you examine the Graham Multiple run chart, it is apparent that the long-term valuation trend is downward. This is not surprising given the bank's failure to create shareholder value since 2007.
In fact, the valuation may be surprising to the upside. This fact may reflect a premium in value that shareholders have placed on TRMK shares in anticipation of a bank sale.
Trustmark Graham Mult. (Ycharts)
Director/Management "Returns" vs. Shareholder Returns
It is important to address a dilemma directors, managers, and investors face in all publicly traded companies.
The dilemma centers on the question whether shareholder returns grow over time at a rate consistent with the growth rate of director and management compensation.
We know dividends at Trustmark have been flat since 2007. We also know that Trustmark's share price has not changed for the past twenty years.
These two facts lead to simple math: Shareholders have earned on average about 3.8% in total return annually by owning TRMK shares ($0.92 a share in dividend/~$24 per share average price).
Inflation-adjusted, TRMK shareholders have earned declining returns over the past two decades.
How have Trustmark executives and directors done during this time?
The oldest proxy statement I can find for Trustmark is one from 2011. The 2011 Proxy Statement indicates that:
- Average total compensation to bank directors in 2010 was ~$52,000. This sum excludes changes in the value of pensions and unqualified plans.
- Average total compensation paid to the bank CEO from 2008-2010 was ~$1.67 million. This sum excludes the three-year average change in pension and unqualified plans of $230,000.
How has CEO and board compensation changed since the 2011 Proxy?
The bank's 2023 Proxy was filed March 13. Here is what we see:
- Average total compensation to bank directors in 2022 was ~$120,000. This sum excludes changes in the value of pensions and unqualified plans. It also excludes board chair compensation of $204,000.
- Average total compensation paid to the bank CEO from 2020-2022 was $2.60 million. This sum excludes the three-year average change in pension and unqualified plans of $70,000.
Here is another view of compensation at Trustmark. Data are drawn from the bank's quarterly FDIC Call Reports as presented by Bankregdata in this link .
- Average compensation per employee was $70,442 in 2011.
- Average compensation per employee was $112,260 in 2022.
The total number of employees in 2022 is 2,726, up 9% from 2011.
Trustmark's total bank (not holding company) compensation in 2022 was $272 million compared to an estimated normalized (x-litigation expense) 2022 net income after tax of ~$150 to $160 million. In other words, shareholders earn about $0.57 for every dollar spent on employee compensation.
This ratio lags peers and is a serious problem for investors. My preferred banks earn at least $1 in net income for every dollar of compensation.
Just to be clear, Trustmark's employee, management, and director expenses are in line with the industry. I am not suggesting the bank is a profligate spender. But I am saying that running a bank is an expensive endeavor where scale and productivity matter. Expense pressures, especially related to personnel, will not abate over the next decade.
Summarizing Trustmark Compensation Changes:
- Since 2011, Director compensation has increased 130%.
- Since 2011, CEO compensation has increased 56%.
- Since 2011, average Trustmark bank (not HC) employee compensation has increased 60% .
Change in the bank's dividend since 2011: 0%.
Directors: Employees or Shareholders?
Here is a question I often ask myself when investing in a bank:
Are the directors' "employees" or "shareholders"?
That may seem a dumb question since directors are supposed to be independent and act in the interests of shareholders.
Warren Buffett reminds Berkshire Hathaway Inc. ( BRK.A ) ( BRK.B ) shareholders periodically that his company's directors are not paid fees. Instead, they are substantial shareholders looking to protect and grow their investment interests. Consequently, the role Berkshire directors play is never in question.
Per the 2023 Proxy page 47 , Trustmark shareholders know the following about the director's equity holdings:
- Four of the directors own less than $500,000 in TRMK shares.
- Three own between $500,000 and $600,000.
- One owns shares valued today at $872,000.
- One owns shares valued at $1.0 million.
- The Board Chair's shares are valued at $6.6 million.
- The CEO's ownership of TRMK shares is $1.37 million.
Investors know from SEC Form 4 Insider Trading Screener - that there have been just three open market insider buys at Trustmark during the past four years totaling just 8,000 shares. The most recent was in January (1,500 shares, $28.24).
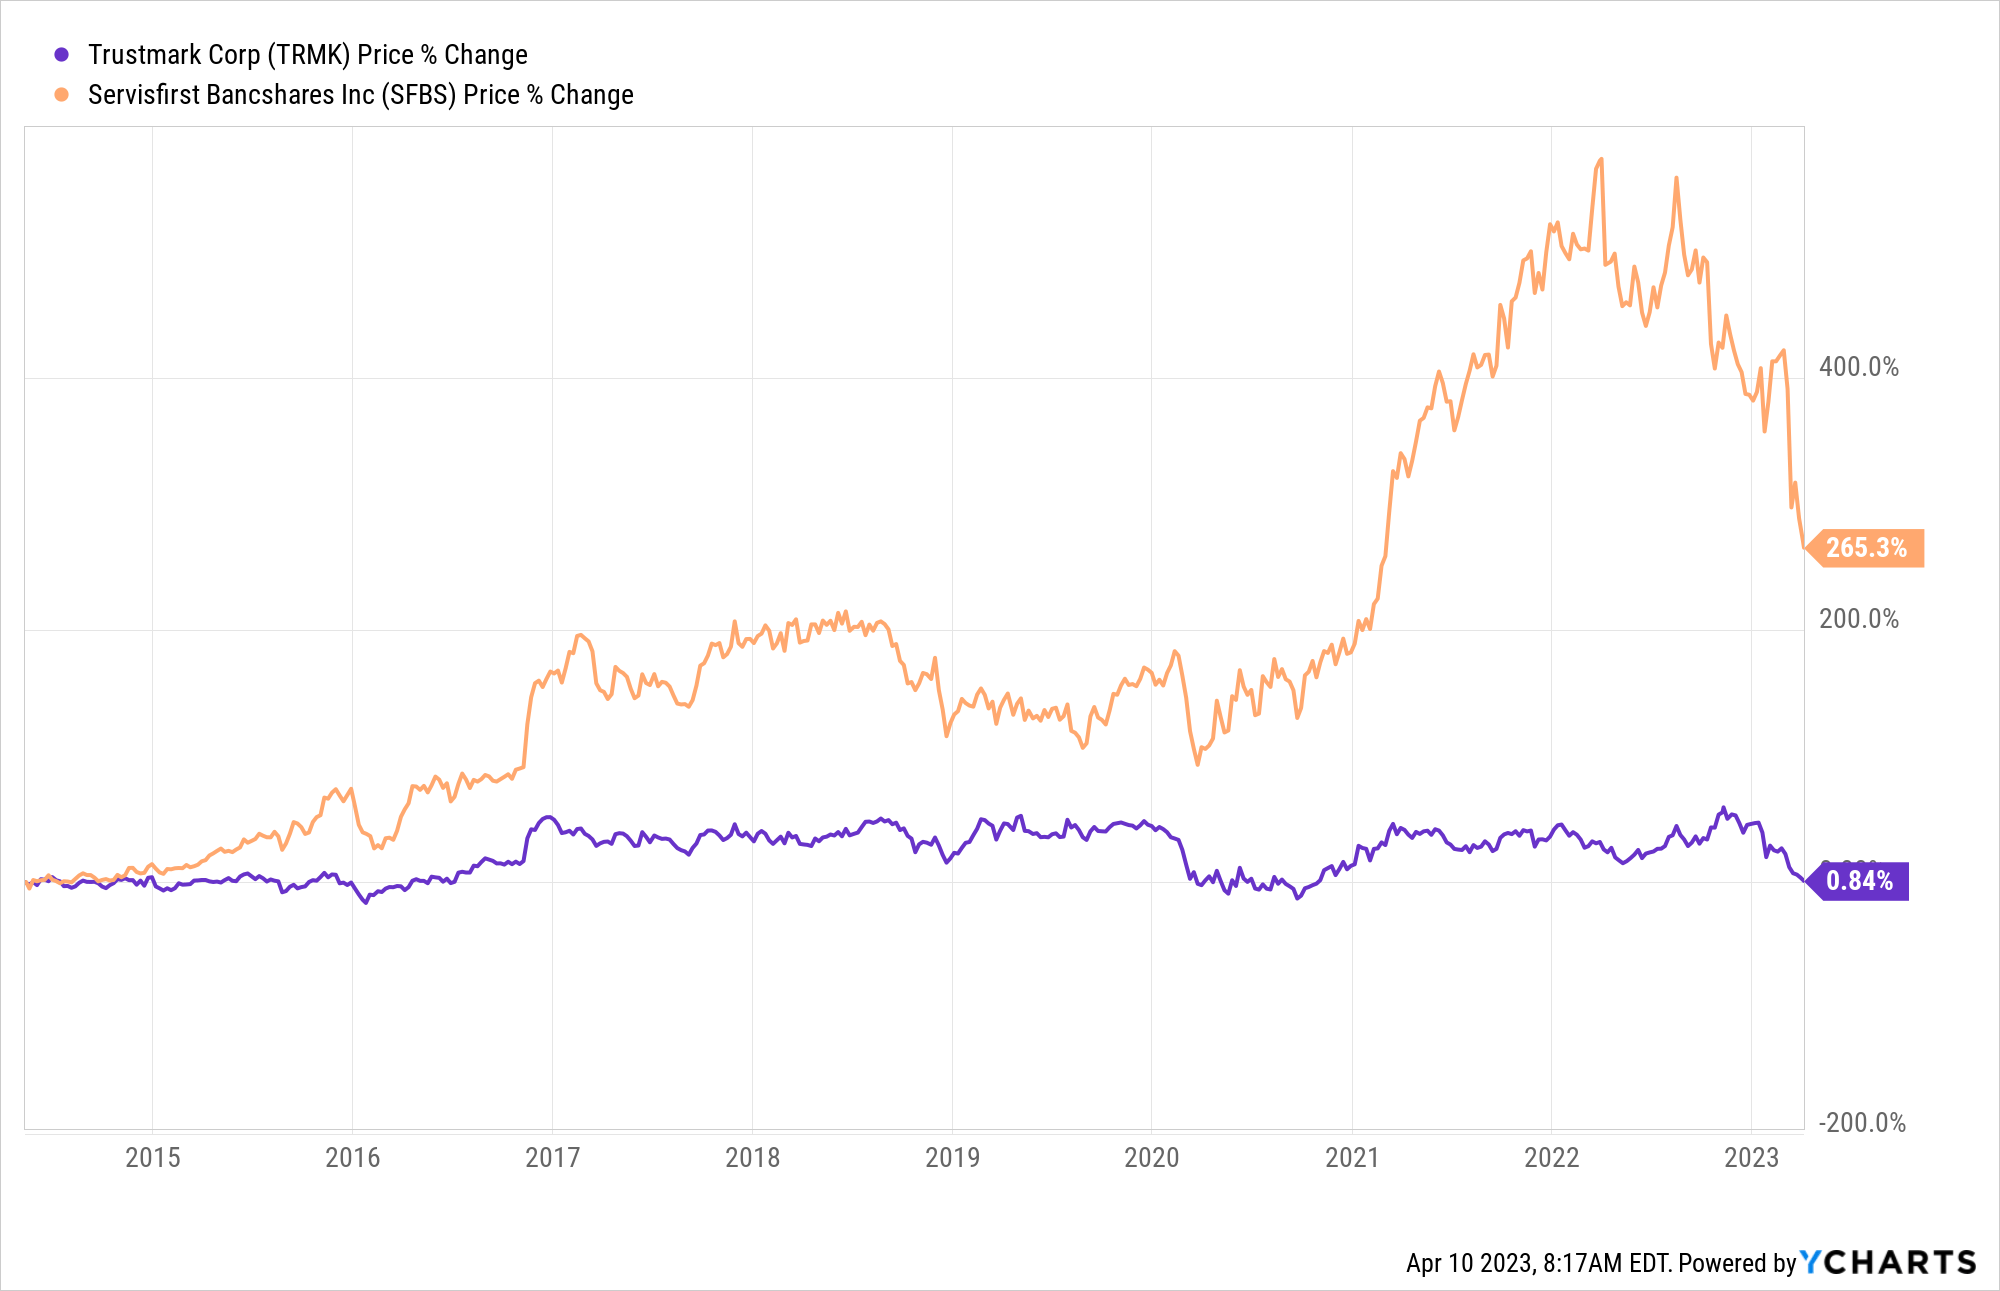
Trustmark Compared to ServisFirst
Contrast Trustmark director ownership with that of ServisFirst Bancshares, Inc. ( SFBS ). Located one state over from Trustmark, Alabama's ServisFirst is slightly smaller than Trustmark at $14.5 billion in assets at YE 2022.
- No SFBS director owns less than $1 million in SFBS shares.
- Two own between $1-$5 million.
- Three own between $20-$30 million.
- One owns >$70 million.
- And the CEO owns shares currently valued at $42 million.
By the way, SFBS independent directors earn fees less than those paid to TRMK independent directors. And two directors bought open market shares during the past 30 days.
For full disclosure, I was paid back in 2016 or 2017 to speak to the SFBS board about my bank investing research.
In my view, SFBS is the model bank board construct. The directors not only own a meaningful number of shares, but they also know the banking industry intimately enough to risk a substantial part of their personal net worths.
This next chart speaks for itself. Note SFBS went public in May 2014.
Price Change: SFBS & TRMK since May 2014 (Ycharts)
Change in Control
Trustmark's CEO, according to the 2023 Proxy , will get paid $6.1 million if the bank is sold (aka, "change in control").
Other named executives will each earn ~$2.1 million on average.
Closing Thoughts
While this article focuses on Trustmark, it serves a broader purpose.
Trustmark is not alone among US banks struggling with profitability. Nor is it alone in my outlook for tougher days ahead.
Significance of Critical Audit Matter
The Critical Audit Matter addresses the enormous complexity associated not only with new accounting standards for determining the Allowance for Credit Losses, but moreover, the higher bar outside auditors have set for bank directors and management.
Independent directors of US banks often lack the professional experience and knowledge to interpret and respond to complex banking issues like Critical Audit Matters.
As former directors at Signature Bank and SVB Financial Group learned, the job of being a (part-time) independent bank director requires enormous skill.
Independent directors serve themselves (and their bank's shareholders) well by asking themselves whether they have the skill to navigate an increasingly complex industry that carries significant downside risk if they fail to govern effectively.
Heightened Regulatory Supervision Expectations
Bankers and directors can assume that regulatory supervisory expectations will heighten meaningfully and appropriately in the immediate aftermath of the liquidity crisis associated with two bank failures in March.
My view is that bank regulators are about to turn up the heat on bank boards. Directors will look back at 2021-2022 as the "good old days."
Consolidation Inevitable
To respond to the challenges facing the industry, I believe US banks must and will accelerate the pace of consolidation which has averaged a 3.7% annual decline in the number of banks since 1987.
As difficult as it has been for the past 15 years for banks to earn back their cost of capital, that challenge will be exacerbated over the next several years.
Back to Trustmark and Banks Like It
While I would love to see a path forward for Trustmark and banks like it to achieve returns exceeding a 10%+ cost of capital over the next few years, I just do not see it.
Capital costs are on the rise. Expense challenges will be exacerbated by emerging technologies and public policies that will separate bank winners from the losers. Banks lacking next-generation talent, scale, and highly skilled directors will fall further and further behind industry leaders. And their shareholders will be big losers.
I believe banks like Trustmark will sooner than later be sold.
That said, knowing banks are sold, not bought, I will avoid Trustmark shares. Should I see a significant increase in share ownership by directors and management, I may change my view. Now more than ever, bank investors need highly skilled (in banking) directors whose interests align to shareholders.
My best guess is that TRMK and other bank stock prices flounder for the next six months as recession risks loom large and Fed future policy actions remain uncertain.
Current shareholders earn a dividend yield of 3.8%. But bear in mind that Seeking Alpha gives Trustmark a C- safety rating.
When risk-free CD rates today yield 4%+ for one to five years, it is not a difficult decision to swap the flat dividend for a higher yielding safe CD. Of course, if and when there is a recession, CD rates will decline, possibly significantly. But then again, recessions always cause bank credit metrics to deteriorate.
My next post will explain in greater detail why I see the next decade as "The Great Consolidation." I will also identify the chief obstacles that could slow much needed consolidation.
CAVEATs
Investors need to do their own research before buying bank stocks.
The data presented in this analysis is correct to the best of my knowledge but recognize that I rely on banks and third-party sources for all data. Investors should do their own independent analysis to confirm.
Investors are prudent to quantify their appetite for bank risk given this sector's history of volatility. My in-house cap is 4-10% of total investable assets. The actual weighting is dependent on market conditions. My current direct exposure to bank stocks is less than 5% of investable assets, reflecting my view of current industry risks and the relative attractiveness of risk-free alternatives.
In addition, I recommend investors diversify bank holdings across a minimum of ten banks. These banks should encompass different strategies/customer segments, sizes, and geographies. As a rule, I prefer to own High Quality banks with a long history of generating returns in excess of cost of capital.
For further details see:
Trustmark Bank Sale Inevitable: High Costs, Low Returns