AGGH - TUA: Hidden Bet On The Yield Curve
2023-09-20 16:00:00 ET
Summary
- The Simplify Short Term Treasury Futures Strategy ETF aims to match or outperform the ICE US Treasury 7-10 Year Bond Index through leveraged long positions in 2-Year treasury futures.
- The ETF has lagged behind the 7-10 Index in terms of returns, potentially due to differences in the yield curve movements.
- Unless they are comfortable with this yield curve bet, I recommend investors avoid the TUA ETF.
Recently, I reviewed the Simplify Aggregate Bond ETF ( AGGH ) and came away less than impressed. In this article, I will review another fixed income ETF from Simplify, the Simplify Short Term Treasury Futures Strategy ETF ( TUA ).
The TUA ETF attempts to match or outperform the ICE US Treasury 7-10 Year Bond Index by holding leveraged long positions in 2 year treasury futures to duration match the index. While in theory, this strategy frees up capital that can be invested in treasury bills to earn additional yield, in practice, TUA's strategy introduces risk from changes in the yield curve.
In simple terms, the TUA is placing a bet on a steepening yield curve. When the yield curve steepens, the TUA ETF should outperform. Conversely, the TUA ETF should underperform when the yield curve flattens like they have in the past few quarters as 2 year yields have risen faster than longer-term yields.
Unless investors understand and are comfortable with this risk, I recommend they avoid this ETF.
Fund Overview
The Simplify Short Term Treasury Futures Strategy ETF seeks to match or outperform the ICE US Treasury 7-10 Year Bond Index ("7-10 Index") on a calendar quarter basis. This index is the underlying index for the popular medium-term bond ETF, the iShares 7-10 Year Treasury Bond ETF ( IEF ).
The TUA ETF aims to achieve its objective by buying leveraged positions in treasury futures at the short end of the yield curve using 2-Year treasury futures contracts to match the duration of the 7-10 Index.
According to TUA's marketing pitch, the TUA ETF "is designed to provide significant duration from only a modest capital allocation while simultaneously attempting to harvest yield curve efficiencies from the short end of the curve".
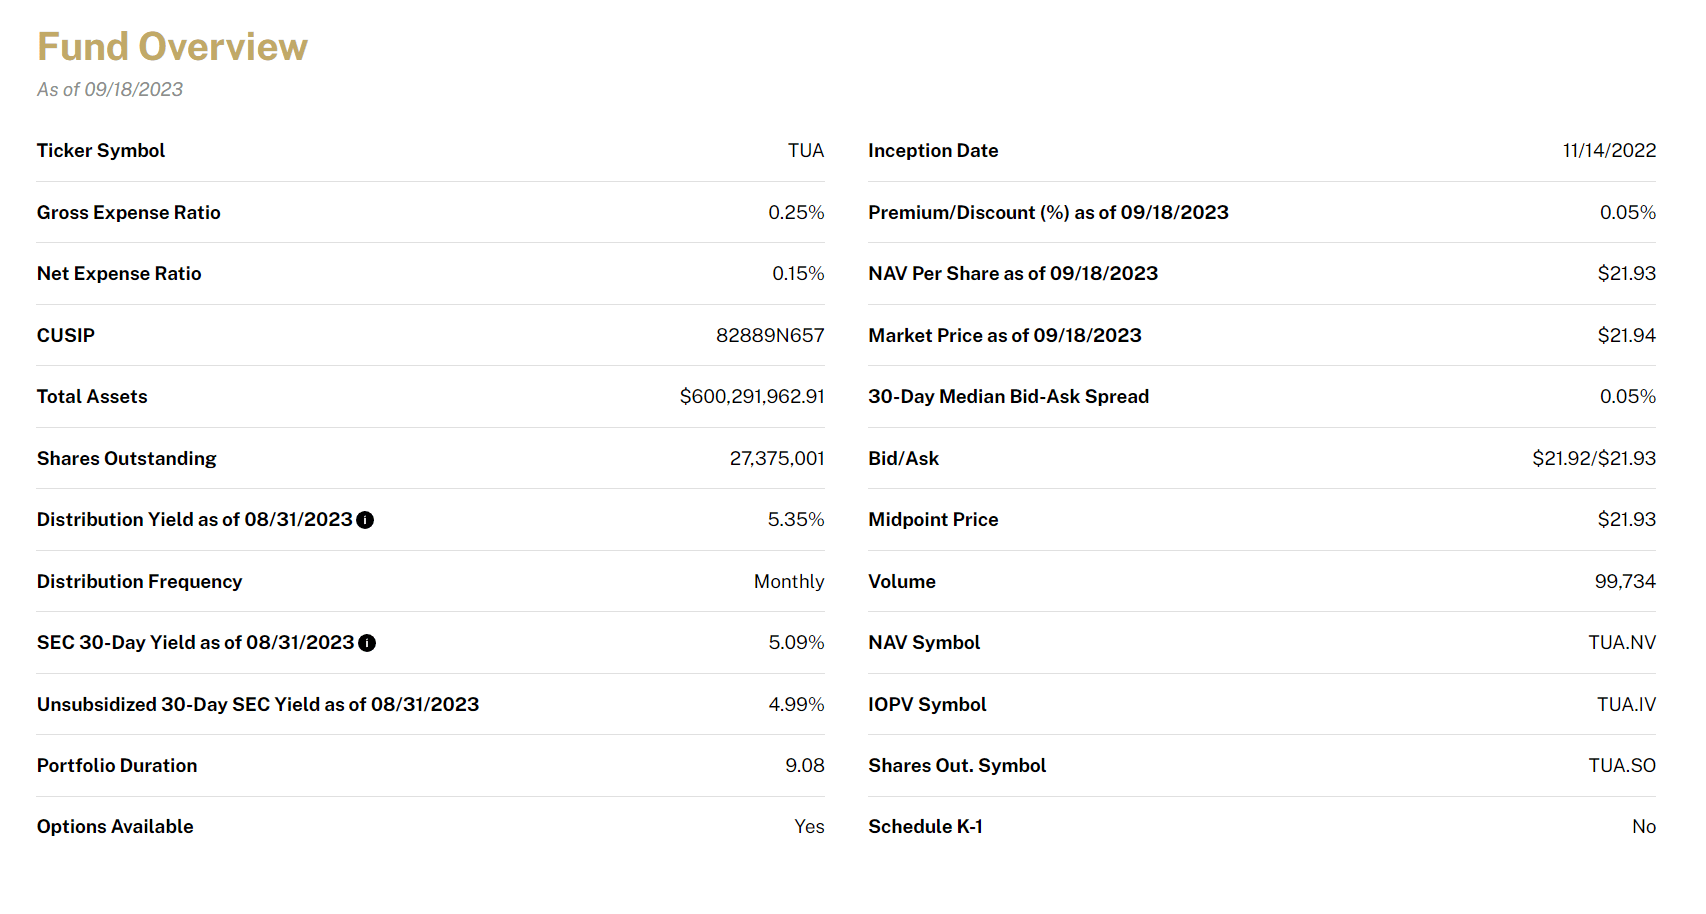
The TUA ETF has garnered $600 million in assets while charging a 0.15% net expense ratio (after fee waivers effective until October 2023) (Figure 1).
Figure 1 - TUA overview (simplify.us)
Portfolio Holdings
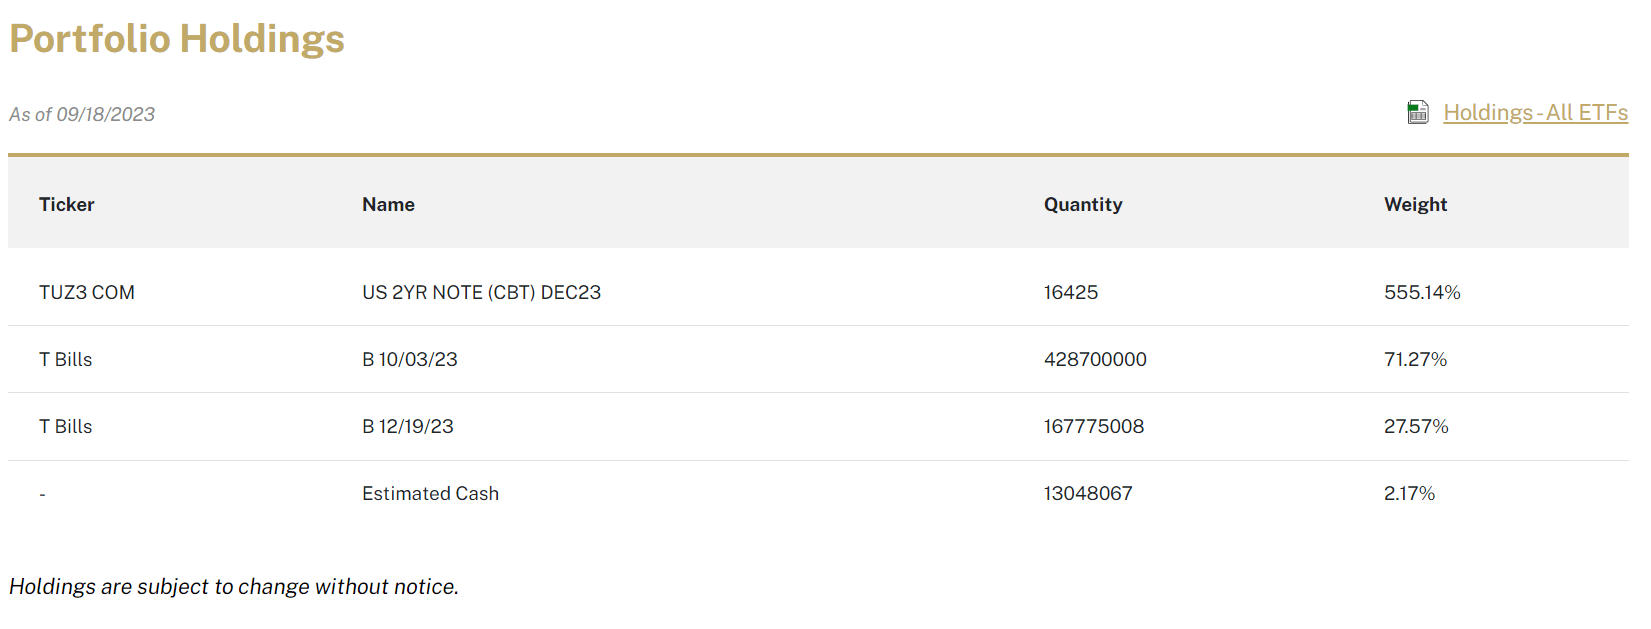
As designed, the TUA ETF holds a leveraged long position in 2-Year treasury futures as well as treasury bills (Figure 2).
Figure 2 - TUA holdings (simplify.us)
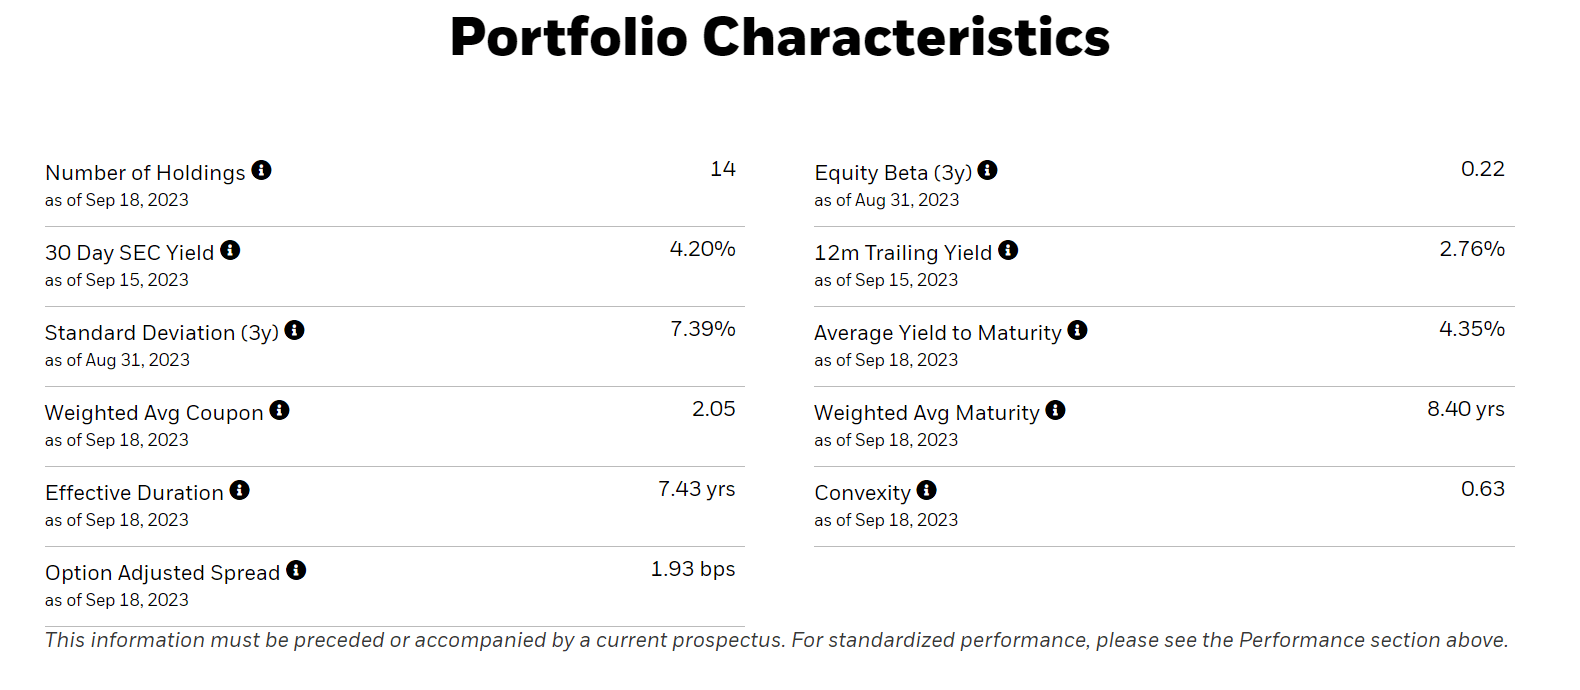
Currently, the TUA portfolio has a 9.1 year duration (Figure 1 above), which is actually longer than the effective duration of the IEF ETF (Figure 3).
Figure 3 - IEF portfolio overview (ishares.com)
If I understand the TUA ETF's strategy correctly, it is trying to deliver returns equivalent to the 7-10 Index by matching the index's duration, while investing spare 'cash' in treasury bills to earn additional yield.
Distribution & Yield
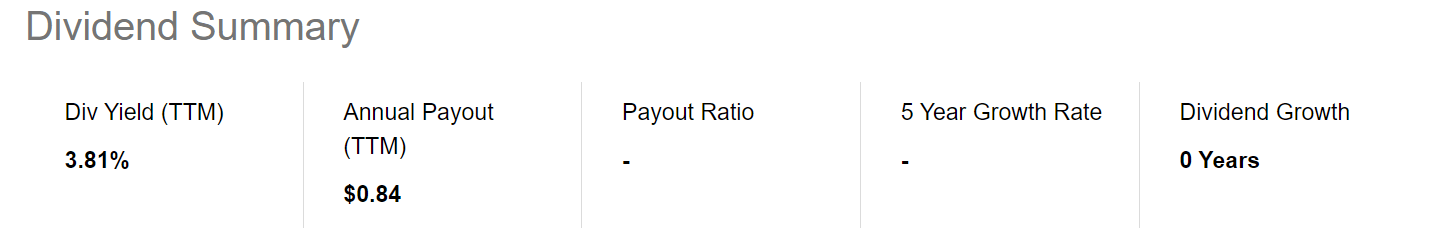
In terms of income, the TUA ETF pays an attractive $0.10 monthly distribution or a forward yield of 5.5%. The fund's trailing yield of 3.8% on Seeking Alpha is a little misleading as the fund was incepted in November 2022 and only began paying a regular distribution in January (Figure 4).
Figure 4 - TUA distribution (Seeking Alpha)
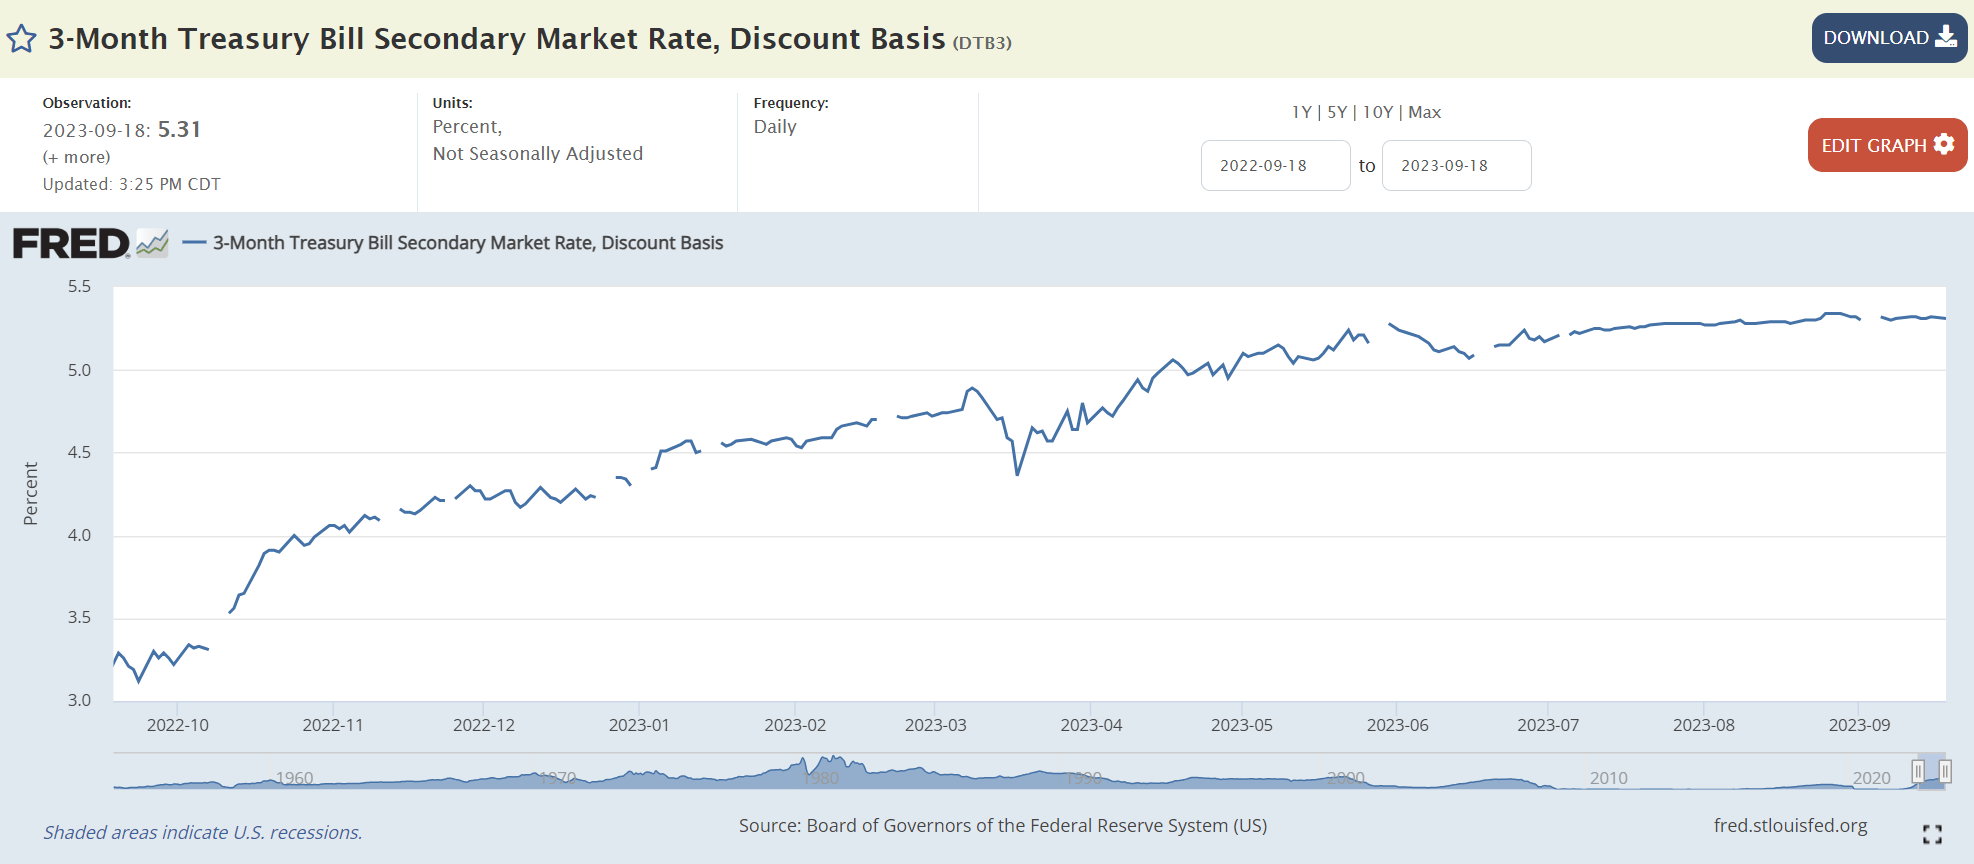
A 5.5% forward yield is actually a little better than the yield on 3 month treasury bills currently (Figure 5).
Figure 5 - 3 month treasury bills (St Louis Fed)
However, before investors declare the TUA 'experiment' a success, they need to also consider the total returns of the ETF.
Returns
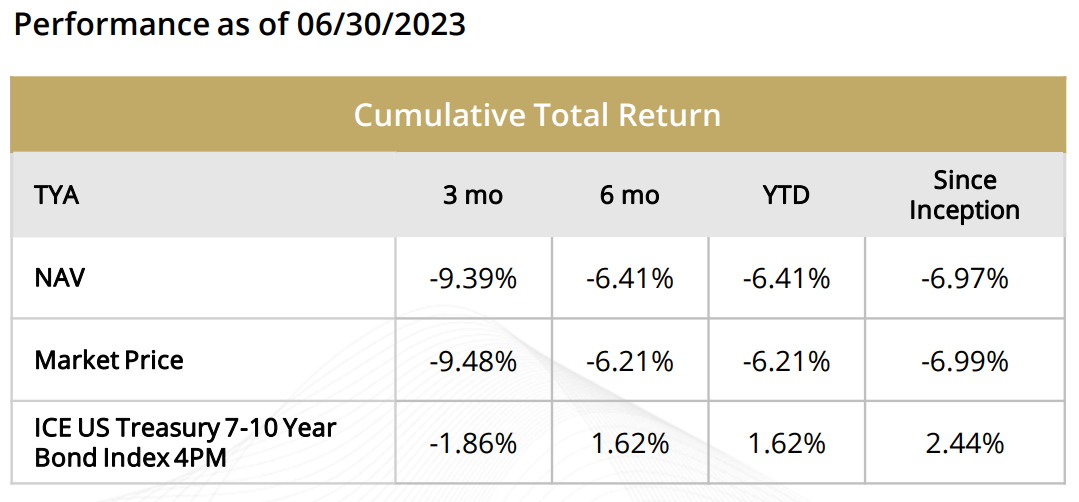
So far in its short existence, the TUA ETF has lagged horribly against the 7-10 Index, with a -9.4% 3 month return and -6.4% 6 month return to June 30, 2023 compared to -1.9% and 1.6% respectively for the index (Figure 6).
Figure 6 - TUA has lagged significantly compared to index (TUA factsheet)
The biggest problem is that the TUA ETF is leveraging the short-end of the yield curve (5.5x leverage, according to Figure 2) in order to match the duration of the 7-10 Index. 'Duration matching' the futures position against the 7-10 Index is only matching first order effects and does not take into account that 2 year yields do not move in the same way as 7-10 year yields, as they are driven by different factors.
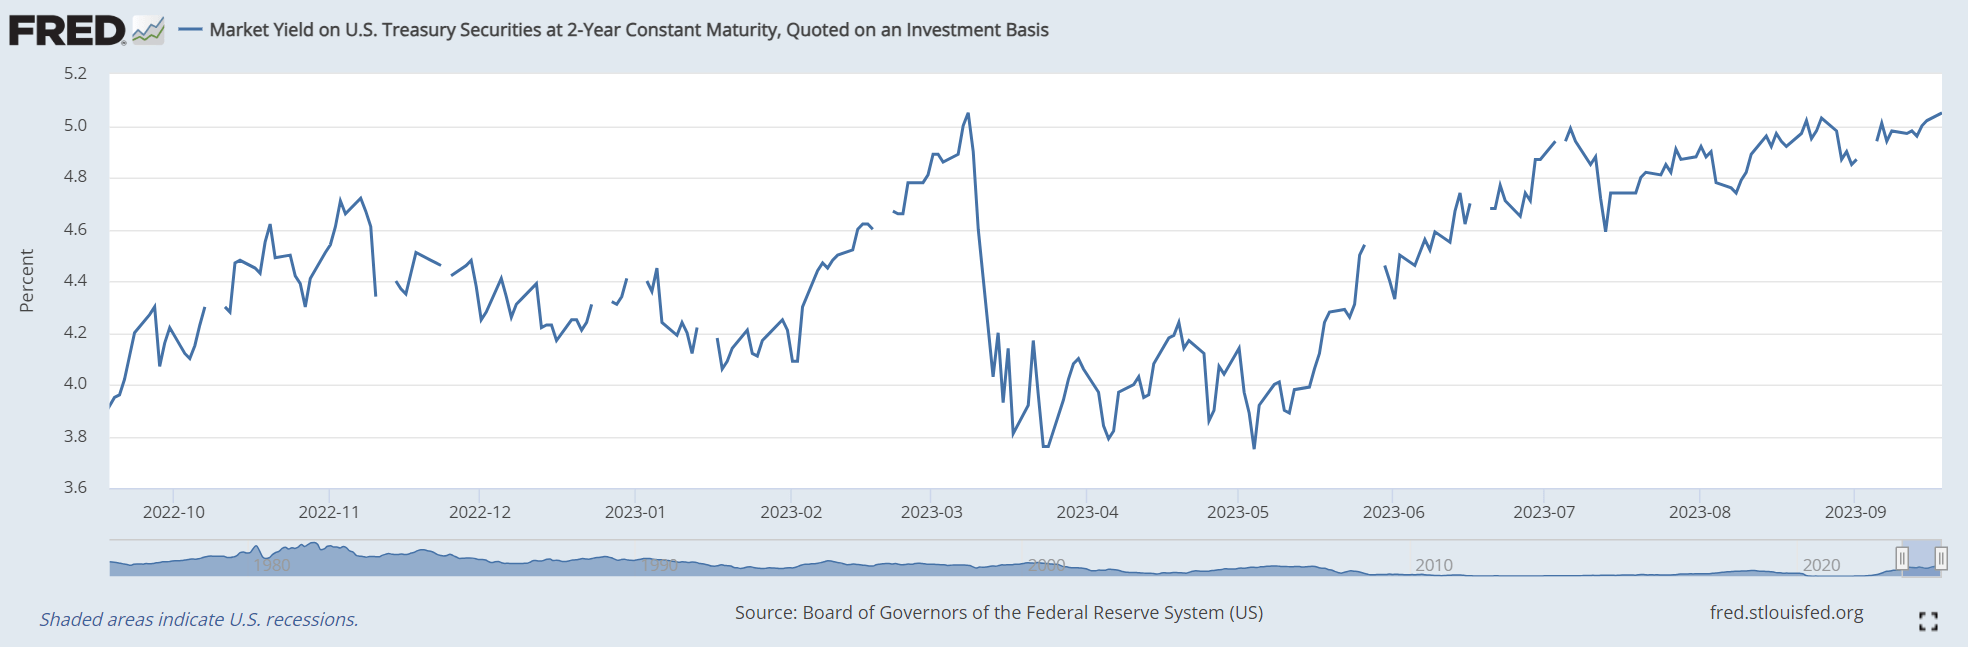
The 2 year yield is one of the shorter duration tenors in the yield curve and is mostly driven by expectations of short-term Federal Reserve monetary policies. In the past 2 years, as the Federal Reserve raised its policy interest rates to fight inflation, the 2 year treasury yield increased by close to 500 bps to 5.05%. In particular, in the past 12 months, 2 year yields have increased from 3.95% to 5.05%, or an increase of 110 bps (Figure 7).
Figure 7 - 2 year yields have risen by 110 bps (St Louis Fed)
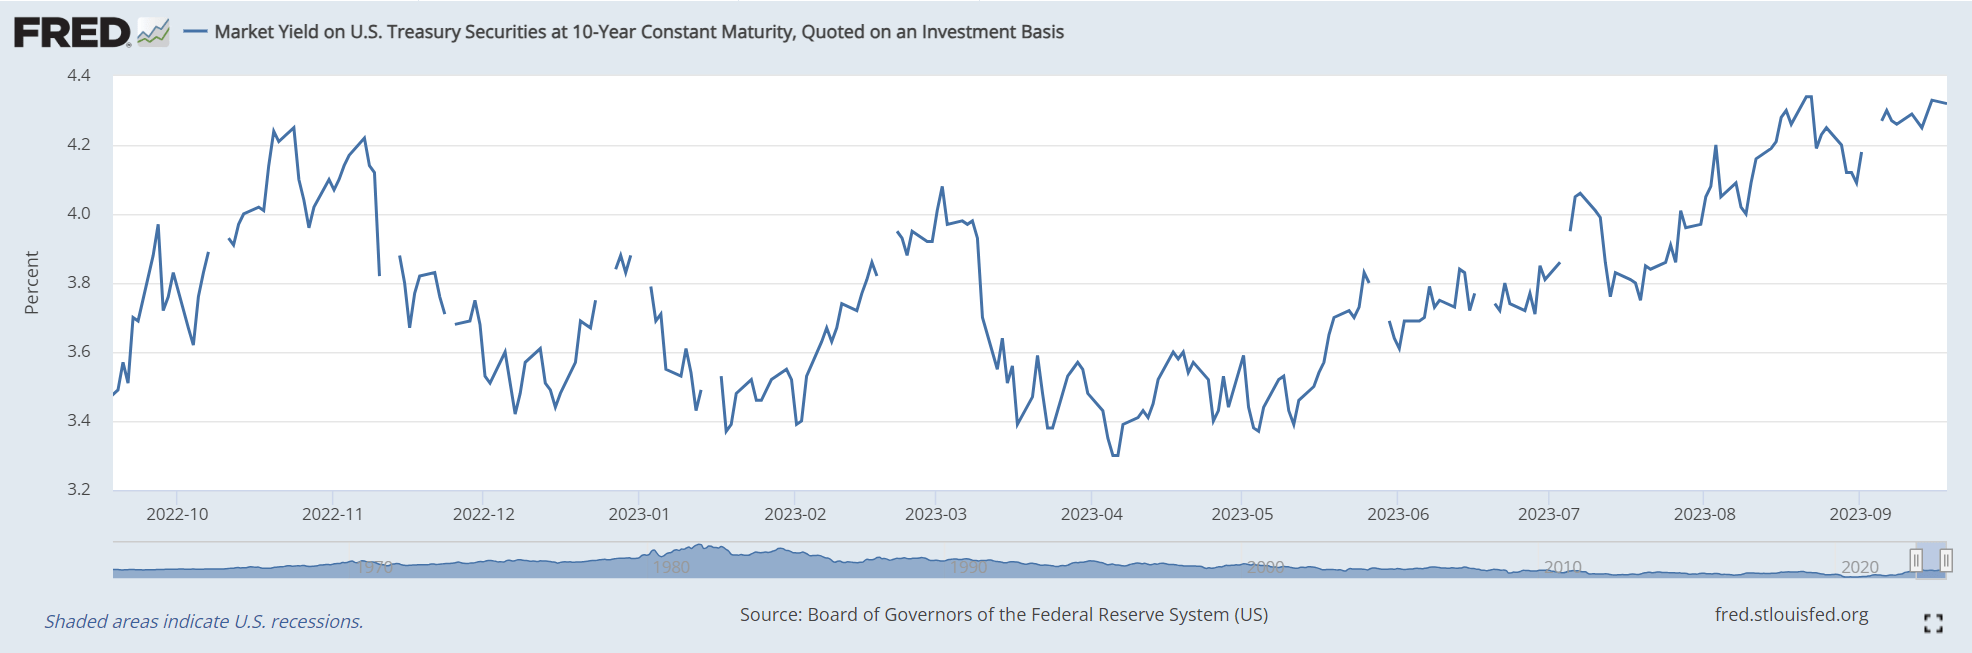
On the other hand, the belly of the yield curve, the 7 to 10 year tenors referenced by the 7-10 Index, are more affected by future economic growth prospects and term premiums. For example, although the 10 year treasury yield have also increased, they have not risen as much as 2 year yields, rising only from 3.5% to 4.3% or 80 bps in the past year (Figure 8).
Figure 8 - 10 year yields have only risen by 80 bps (St Louis Fed)
In fact, unless the yield curve moves in parallel, i.e. every tenor rising and falling by the same amount at the same time, TUA's strategy of leveraged long on 2 year futures to duration match the 7-10 Index is bound to introduce 'basis risk' because 2 year yields do not behave the same as 7-10 year yields.
When yield curves are flattening (short-term yields increase faster than long-term yields or long-term yields decrease faster than short-term yields), TUA's strategy will underperform. This has been the case so far since TUA's inception.
Conversely, when yield curves steepen (short-term yields increase slower than long-term yields or short-term yields decrease faster than long-term yields), TUA's strategy should outperform.
Another Deeply Disappointing Product From Simplify
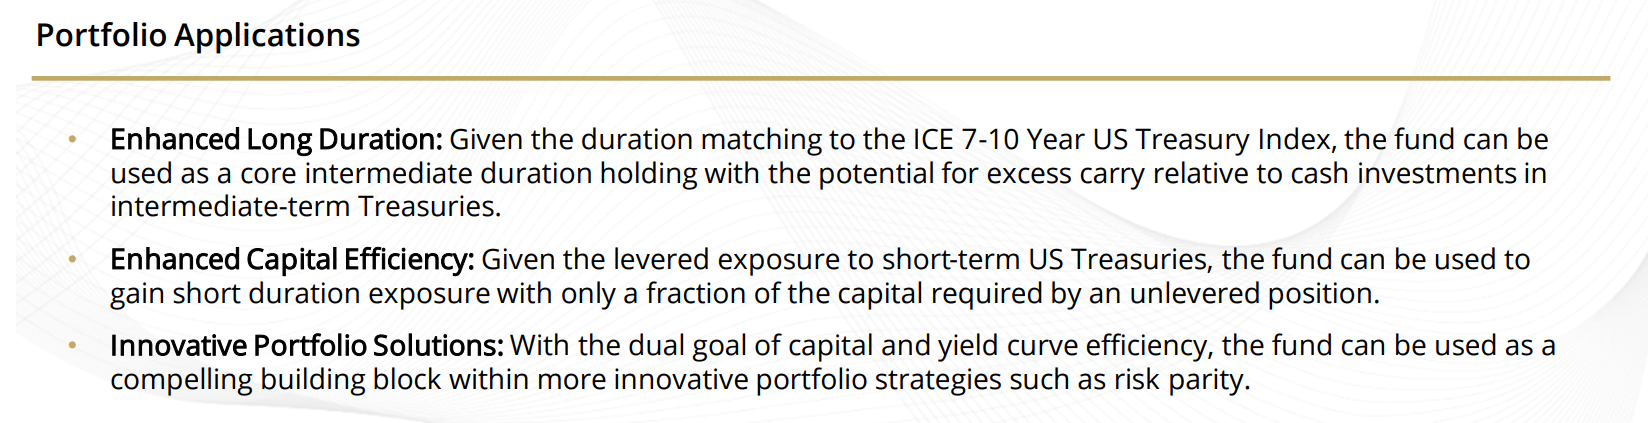
However, it is deeply disappointing that nowhere in Simplify's marketing documents or prospectus for the TUA ETF is this risk discussed or mentioned. Instead, the marketing materials only claim that the TUA ETF is an innovative portfolio solution that provides enhanced long duration with enhanced capital efficiency (Figure 9). These are all industry jargon with little meaning.
Figure 9 - TUA marketing document (TUA factsheet)
Conclusion
The TUA ETF is a fixed income ETF from Simplify that aims to replicate the duration of 7-10 year treasuries using a leveraged long position on 2 year futures. This strategy introduces basis risk as 2 year yields may behave differently from 7-10 year treasury yields due to yield curve steepening and flattening. Unless investors know exactly what they are getting into, I would recommend they avoid this product.
For further details see:
TUA: Hidden Bet On The Yield Curve