TY - TY: Low-Cost Balanced CEF Available At A Nice Discount To NAV
2023-09-15 05:44:01 ET
Summary
- Tri-Continental Corporation is an attractive closed-end fund selling at a 13% discount.
- TY is a balanced fund with a focus on long-term capital growth and current income.
- The fund has a very low expense ratio, uses modest fixed-cost leverage, and is an excellent core holding for investors concerned about market overvaluation.
Tri-Continental Corporation (TY) is one of the oldest closed-end funds and has been around almost 100 years. It was created in 1929 during the closed-end fund "mania" of the time. The Fund's investment manager is now Columbia Management Investment Advisers LLC, which is a wholly-owned subsidiary of Ameriprise Financial (AMP).
I last wrote an article on TY back in Nov. 2021, and I think the fund is now quite attractive again selling at a 13% discount.
TY is a balanced fund. It targets long term capital growth and current income. The portfolio largely consists of large cap equities with a value tilt, but the Fund also have the flexibility to invest across the capital structure to produce the best risk/reward profile.
In many ways, TY is similar to Vanguard's Wellington Fund, but because of its closed-end structure it can use leverage and it usually trades at a discount to net asset value. That is not the case with the Wellington Fund which uses no leverage and always trades at NAV.
As a balanced fund, TY is less volatile than most of its equity CEF peers.
Here is the 12 month market volatility of TY compared to some other large cap equity CEFs:
12 Month Standard Deviation
| TY |
| 15.31% |
| GAM |
| 17.82% |
| STEW |
| 19.12% |
| CET |
| 14.06% |
| GDV |
| 19.60% |
| ADX |
| 17.13% |
Source: Morningstar
Investment Process
For the equity portion of the fund, TY uses a quantitative model to rank stocks based on three broad factors: Quality, Valuation and Catalysts.
- Quality looks for earnings strength and consistency.
- Valuation looks at various ratios, earnings and cash flow trends.
- Catalysts looks at price momentum and business momentum.
A portion of the fund is primarily computer driven and uses proprietary models. This portion of the fund is fully invested and doesn't factor in human judgment or macro economic trends.
The other portion of the fund is driven by human judgment and uses bottom up analysis. They take a holistic view, exploring all types of securities issued by one company to determine the best risk/reward profile for the portfolio.
The managers try to deliver consistent competitive returns, regardless of market conditions, with a fairly low degree of risk.
Distribution Policy
TY has paid dividends on its common stock for 80 consecutive years.
The fund has an earned distribution policy which means it makes distributions that are approximately equal to the distributions from the underlying portfolio, less the fund's expenses and dividends payable on the preferred stock.
Here is the distribution history since 2015:
| YEAR |
| INCOME |
| CAP GAINS |
| RETURN OF CAPITAL |
| TOTAL |
| 2015 |
| $0.81 |
| $0.00 |
| $0.00 |
| $0.81 |
| 2016 |
| $0.91 |
| $0.00 |
| $0.00 |
| $0.91 |
| 2017 |
| $1.07 |
| $0.10 |
| $0.00 |
| $1.17 |
| 2018 |
| $0.96 |
| $0.95 |
| $0.00 |
| $1.91 |
| 2019 |
| $1.016 |
| $0.918 |
| $0.00 |
| $1.934 |
| 2020 |
| $1.0657 |
| $0.5698 |
| $0.00 |
| $1.6355 |
| 2021 |
| $1.0549 |
| $3.6352 |
| $0.00 |
| $4.6901 |
| 2022 |
| $1.0828 |
| $1.1502 |
| $0.00 |
| $2.2330 |
So far in 2023, the fund has distributed $0.576.
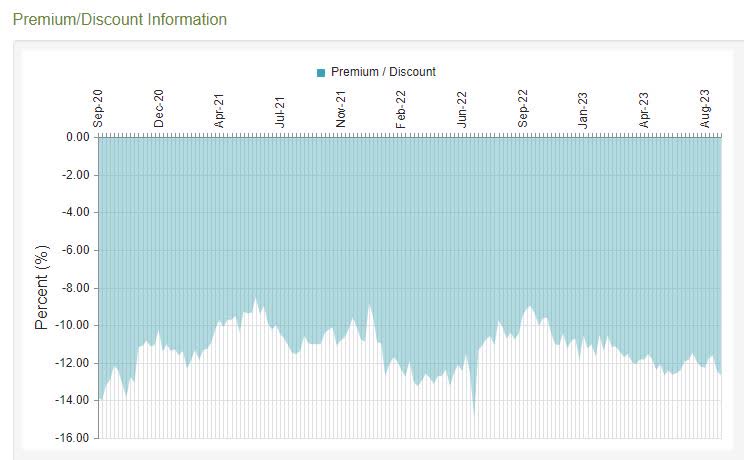
TY: Three year Discount History
Total Return Performance
Here is the trailing total return NAV and price performance record of TY compared to its peers in the Moderately Aggressive Allocation category from Morningstar.
| TY NAV Performance |
| TY Price Performance |
| Category NAV |
| Rank in Category ((NAV)) |
| 3-month |
| 2.48 |
| 2.10% |
| 2.30% |
| 25 |
| YTD |
| 10.53% |
| 9.26% |
| 12.22% |
| 75 |
| 1-Year |
| 8.29% |
| 5.77% |
| 9.70% |
| 75 |
| 3-Year |
| 9.98% |
| 11.40% |
| 10.63% |
| 75 |
| 5-Year |
| 7.86% |
| 8.42% |
| 8.37% |
| 50 |
| 10-Year |
| 9.81% |
| 10.82% |
| 9.37% |
| 25 |
| 15-Year |
| 8.99% |
| 8.97% |
| 8.61% |
| 25 |
Source: Morningstar (as of Sep. 13, 2023)
TY- Top Ten Holdings vs. S&P 500 (as of 7/31/2023)
The top ten holdings comprise 20% of the fund's 239 total holdings. The fund tends to hold many of the biggest stocks in the S&P 500, but tends to underweight some richly valued growth stocks like AAPL and MSFT and completely avoids TSLA and NFLX. The overweight holdings relative to the S&P 500 are in bold face.
| Holding |
| Fund % |
| S&P 500 % |
| ( AAPL ) |
| 3.98 |
| 7.58 |
| ( MSFT ) |
| 3.07 |
| 6.52 |
| ( GOOGL ) |
| 2.68 |
| 2.06 |
| ( XOM ) |
| 1.76 |
| 1.13 |
| ( META ) |
| 1.60 |
| 1.84 |
| ( CSCO ) |
| 1.59 |
| 0.56 |
| ( MS ) |
| 1.46 |
| 0.31 |
| ( QCOM ) |
| 1.32 |
| 0.38 |
| ( BMY ) |
| 1.31 |
| 0.34 |
| ( ADBE ) |
| 1.20 |
| 0.65 |
NAV Calculation is Understated Because of Preferred Stock
There is an odd "quirk" in the way that closed-end funds compute NAV when they have preferred stock in the capital structure.
From an economic viewpoint, the preferred is similar to a short position in the preferred, so you would think the market value of the preferred would be subtracted from total assets to compute NAV. But that is not the way it works. The rules require the par value of the preferred to be subtracted when computing the NAV.
For example this is how the NAV for TY was computed in the semi-annual report dated June 30, 2023:
Net Assets= $1,700,078,362
Preferred Stock= $ 37,637,000
752,740 shares outstanding ============
Net Assets for Common Stock = $1,662,441,362
The $37,637,700 amount listed for the preferred was computed by multiplying the number of shares of preferred by the par value of $50.
But the closing price for the TY preferred on June 30 was actually $48.85. If the closing market price for the preferred was used (instead of the $50 par value), the negative NAV adjustment for the preferred would have been only $36,771,349. One could make the case that the NAV for TY was effectively understated by almost $1 million. The current market price of TY-P has fallen to $47.41, so the NAV is more understated now.
Because of this calculation "quirk", any share repurchases of the TY preferred when it trades below the $50 par value would be accretive to NAV.
NAV Correlations Compared to Other Funds
I looked at the NAV correlations of TY compared with some other CEFs and ETFs. TY falls into the large cap value style box on Morningstar. The NAV ticker for TY is XTYCX.
TY versus TILT 99% Flexshares Market Factors Tilt Index Fund
TY versus FVAL 98% Fidelity Value Factor ETF
TY versus SPY 98% S&P 500
TY versus CII 98% Blackrock Enhanced Capital & Income CEF
TY versus JVAL 97% JP Morgan US Value Factor ETF
TY versus VWELX 96% Vanguard Wellington Fund
TY versus QQQ 86% Invesco QQQ Trust
Source: Portfolio Visualizer
Tri-Continental Corporation
Total Investment Exposure= $1.705 Billion
Total Common Assets= $1.667 Billion
Baseline Expense ratio= 0.46%
Expense ratio plus preferred dividend= 0.57%
Discount= -13.20%
Annual Distribution Rate (market price) = 3.85%
Distribution Frequency= Quarterly
Effective Leverage= 2.21%
Average Daily Volume= 42,758
Average Dollar Volume= $1,160,000
Summary
TY is an excellent core holding for investors who want to stay invested in the stock market, but are concerned that the markets may be somewhat overvalued and due for a pullback.
I would look to purchase TY at a discount of 12% or higher.
TY has one of the lowest expense ratios in the closed-end fund universe. It uses a very modest amount of leverage which has a fixed cost. It is fairly liquid, although I would recommend using smaller size limit orders to buy the stock.
The fund often pays out large year-end capital gains distributions. It paid out capital gains distributions of $3.6352 in 2021 and $1.1502 in 2022 in addition to its normal quarterly income distributions.
For further details see:
TY: Low-Cost Balanced CEF Available At A Nice Discount To NAV