BNO - U.S. August Oil Production At Record High
2023-11-03 01:05:00 ET
Summary
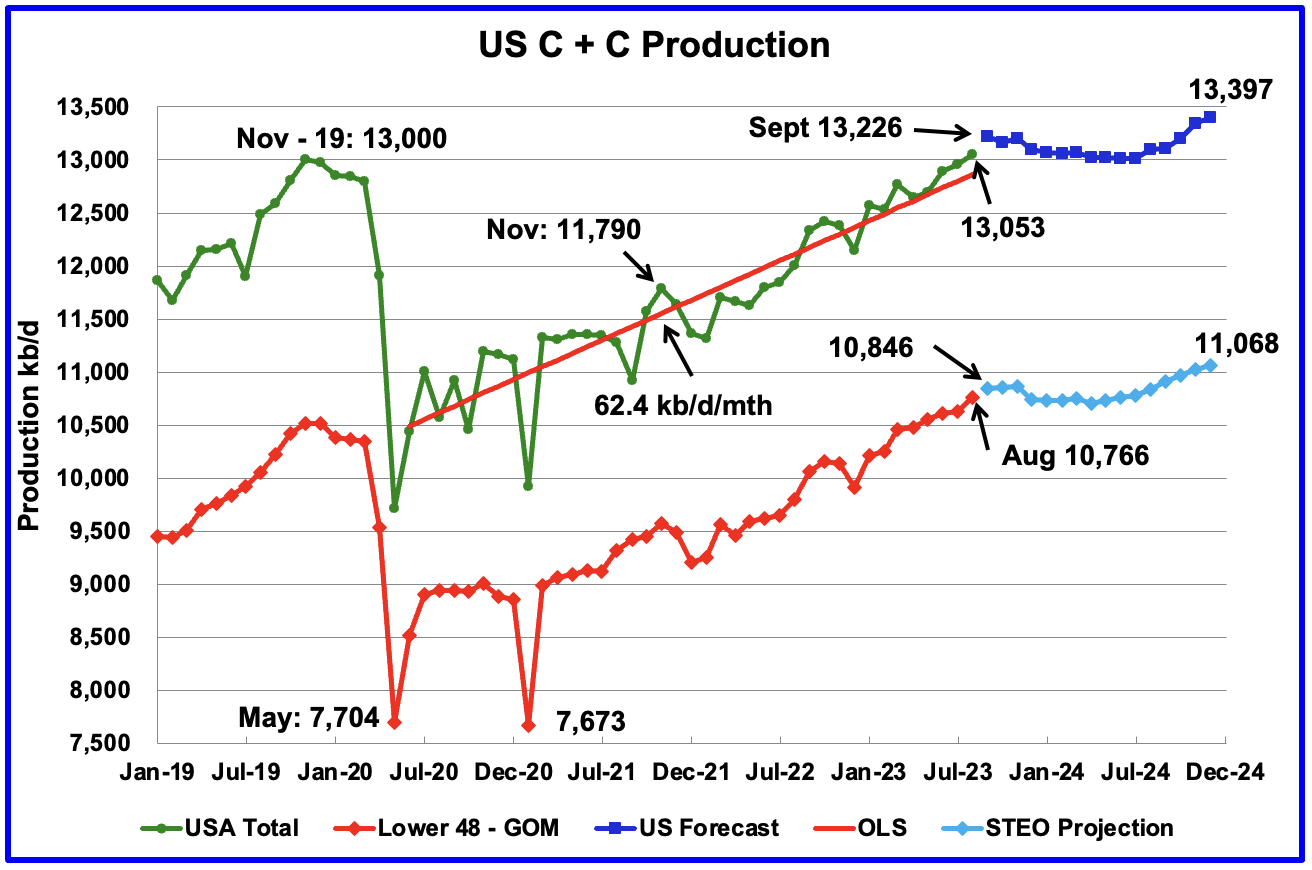
- U.S. August oil production increased by 94 kb/d to 13,053kb/d, a new record high by 53 kb/d over November 2019.
- On a YoY basis, US production increased by 1,051 kb/d with the majority, 895 kb/d coming from Texas, New Mexico and North Dakota.
- The gap between completed and drilled wells in the Permian is now very small compared to late 2022 and early 2023.
A guest post by Ovi
All of the Crude plus Condensate (C + C) production data for the US state charts comes from the EIA?s Petroleum Supply monthly - PSM, which provides updated information up to August 2023.
U.S. August oil production increased by 94 kb/d to 13,053kb/d, a new record high by 53 kb/d over November 2019. The increase was primarily due to increases in Texas, New Mexico and North Dakota. Note that July production was revised down from 12,991 kb/d to 12,959 kb/d, which accounts for 32 kb/d of the 94 kb/d August increase .
The dark blue graph, taken from the October 2023 STEO, is the forecast for U.S. oil production from September 2023 to December 2024. Output for December 2024 is expected to be 13,397 kb/d which is 60 kb/d lower than forecast last month.
The red OLS line from June 2020 to August 2023 indicates a monthly production growth rate of 62.4 kb/d/mth or 749 kb/d/yr. Clearly, the growth rate going forward into the rest of 2023 and 2024, shown by the dark blue graph, is lower than seen in the previous July 2020 to June 2023 time period. From September 2023 to December 2024, production is expected to grow by 171 kb/d. Production is expected to fall from September 2023 to July 2024 before beginning to rise.
While overall US oil production increased by 94 kb/d, the Onshore L48 had a production increase of 137 kb/d to 10,766 kb/d in August.
The light blue graph is the STEO projection for output to December 2024 for the Onshore L48. From September 2023 to December 2024, production is expected to increase by 222 kb/d to 11,068 kb/d.
Oil Production Ranked by State
Listed above are the 10 states with the largest US oil production along with the Gulf of Mexico. These 10 states accounted for 82.5% of all U.S. oil production out of a total production of 13,053 kb/d in August 2023.
Here is an overview of where oil production growth is occurring in the onshore L48 which had an overall increase of 137 kb/d, Big Two 65 kb/d, North Dakota 37 kb/d and the Rest 35 kb/d. Oklahoma was the state with the largest production drop in August.
On a YoY basis, US production increased by 1,051 kb/d with the majority, 895 kb/d coming from Texas, New Mexico and North Dakota. GOM was down 42 kb/d MoM but up 108 kb/d YoY.
State Oil Production Charts
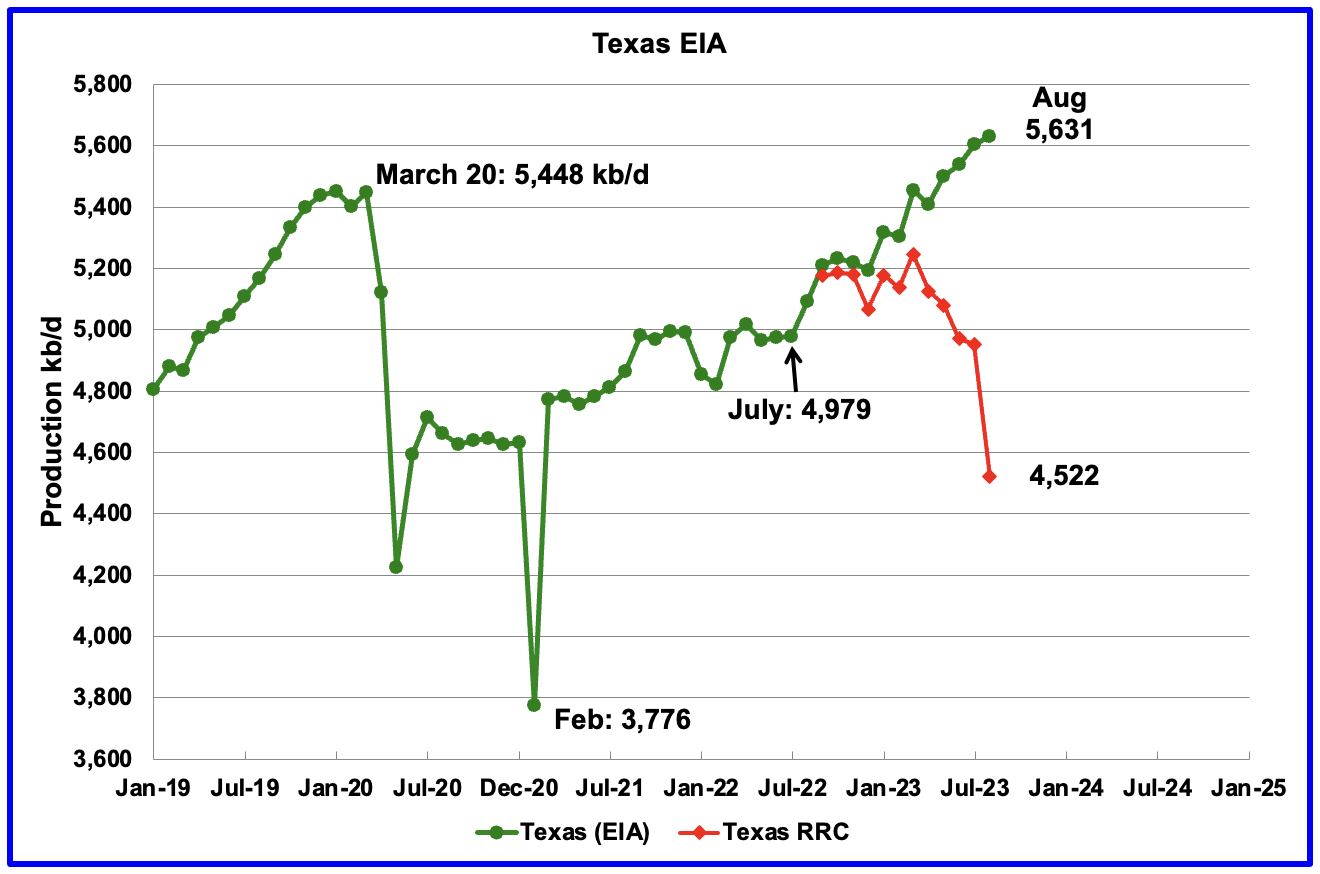
Texas production increased by 25 kb/d in August to 5,631 kb/d. However, relative to July production reported last month, 5,628 kb/d, August output is only up 3 kb/d . In the EIA's August report, June was revised down by 18 kb/d and July was revised down by 22 kb/d, from 5,628 kb/d to 5,606 kb/d.
The Texas RRC August production report has been added to this chart to compare it with the EIA data. While the first three red markers, September, October and November 2022 are reasonably close to the EIA's production, the August 2023 gap of 1,109 kb/d is big and appears to be typical. Revisions to the Texas first month production will continue for about 18 months.
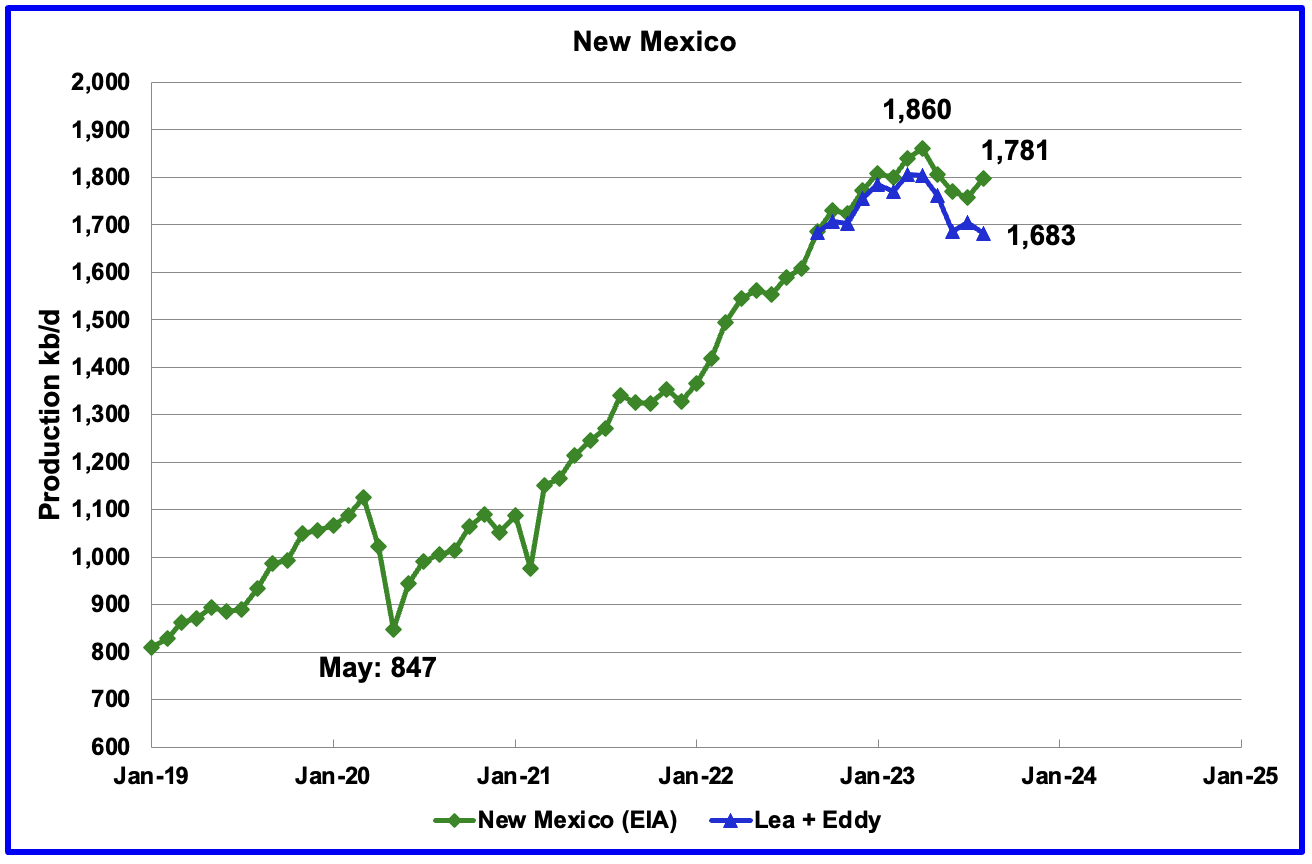
New Mexico's August production rose by 40 kb/d to 1,781 kb/d. Lea + Eddy counties dropped by 23 kb/d. Interesting that the L + E trends have been in the opposite direction to those from the EIA for the last two months. Prior to that, the trends were the same.
Of the EIA's 1,781 kb/d output from New Mexico, 1,683 kb/d (95%) came from the Lea and Eddy counties. The Lea and Eddy County production data for August is not complete and will be updated over the next three months. The first blue marker is September's total production from NM's Lea and Eddy counties. Their combined output was 1,683 kb/d compared with 1,686 kb/d reported by the EIA for all of New Mexico, a difference of 3 kb/d.
More production information from these two counties is reviewed in the special Permian section further down.
August's output increased by 37 kb/d to 1,217 kb/d. This is the first post-pandemic month in which North Dakota's output exceeded the October 20 rebound production of 1,214 kb/d. Output over the next few months may slow as the rig count stays relatively unchanged close to 30 rigs.
According to this source , production growth going forward will be smaller.
"But Helms said this may be the last time for a while where there would be this kind of increase.
"When we look at the number of completions, and we look at the number of wells waiting on completion, we can see that we don't have a large inventory of wells waiting," Helms said. "And we're just going to be completing wells as they're drilled."
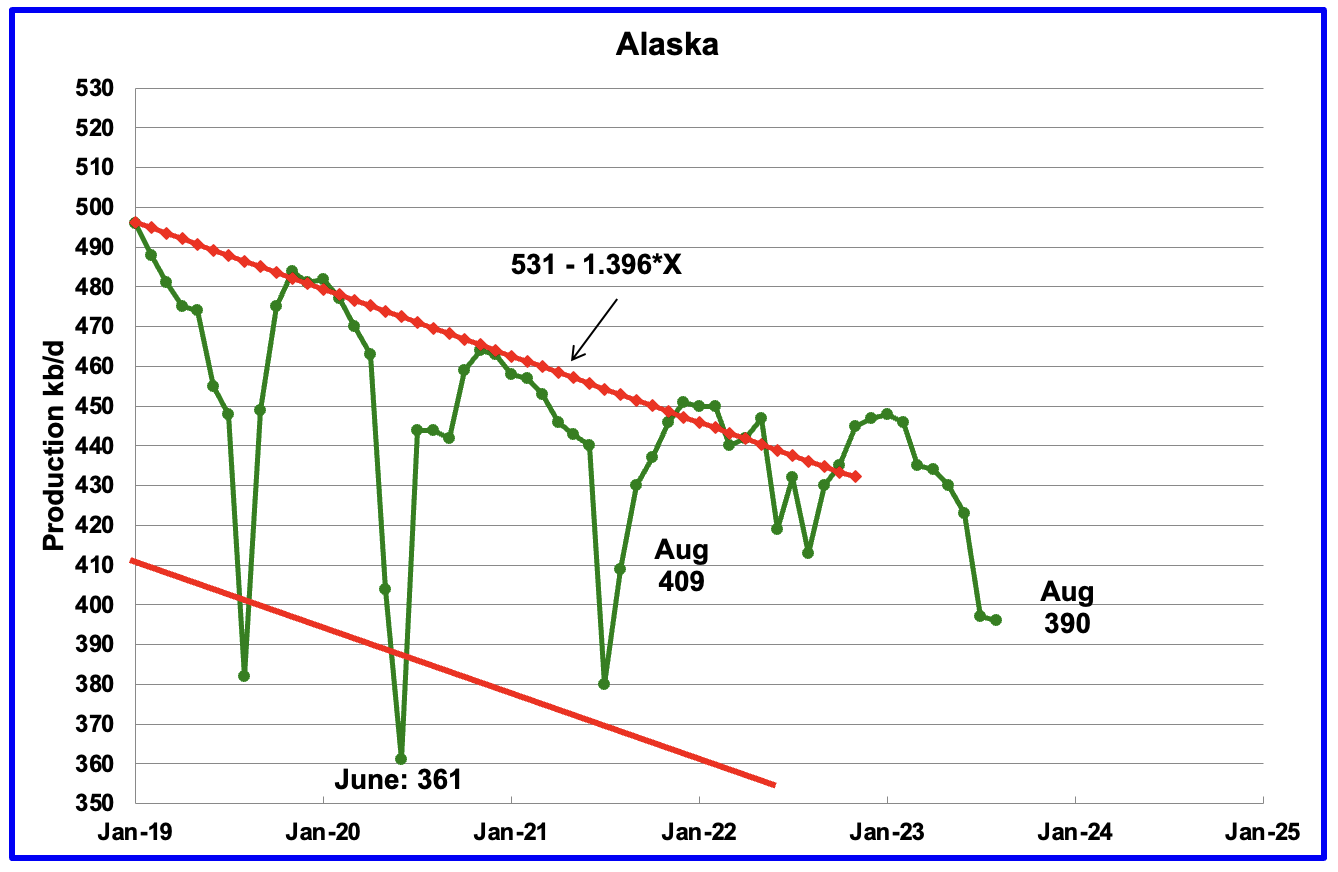
Alaska?s August output decreased by 1 kb/d to 396 kb/d. Production YoY is down by 17 kb/d and down 19 kb/d from two years ago.
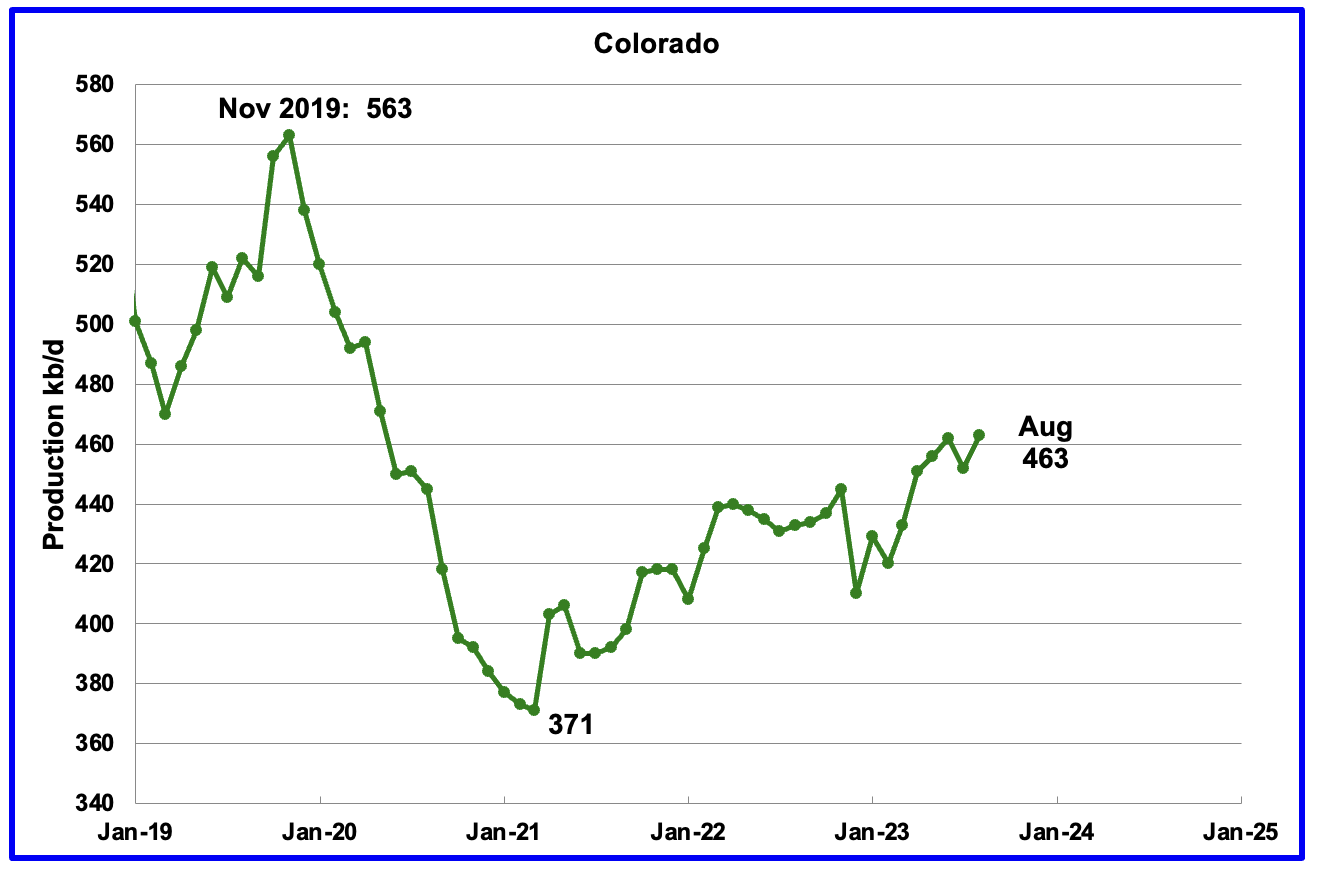
Colorado?s August production increased by 11 kb/d to 463 kb/d.
Oklahoma's output in August decreased by 10 kb/d to 428 kb/d. Production remains 48 kb/d below the post-pandemic July 2020 high of 476 kb/d and output may be in a plateau phase.
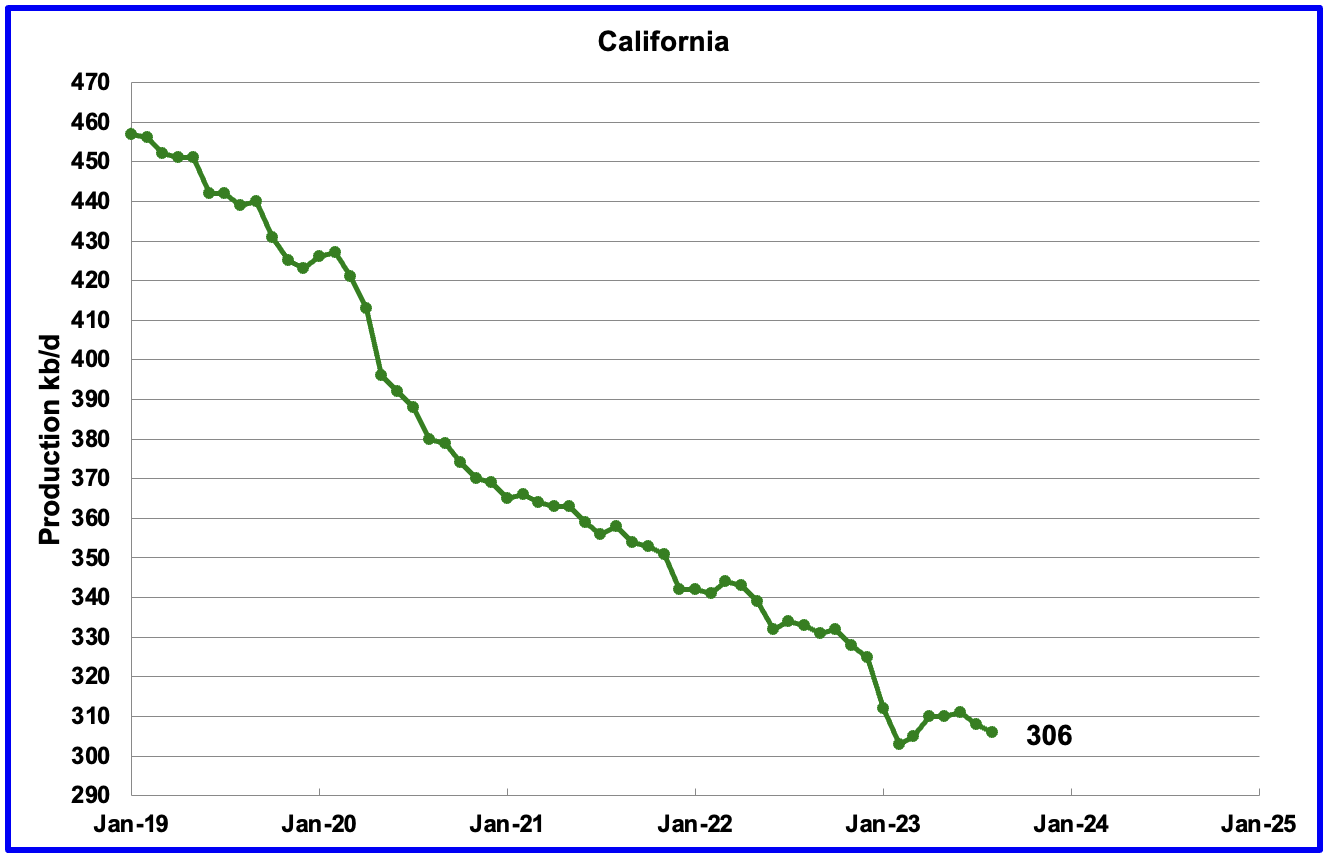
California's overall slow output decline trend has resumed. August production dropped by 2 kb/d to 306 kb/d.
Wyoming's oil production in October and November 2022 reached a post-pandemic high of 270 kb/d. Wyoming's production has been rebounding since February 2023 and August's oil production added 10 kb/d to 273kb/d, 3 kb/d higher than November 2022.
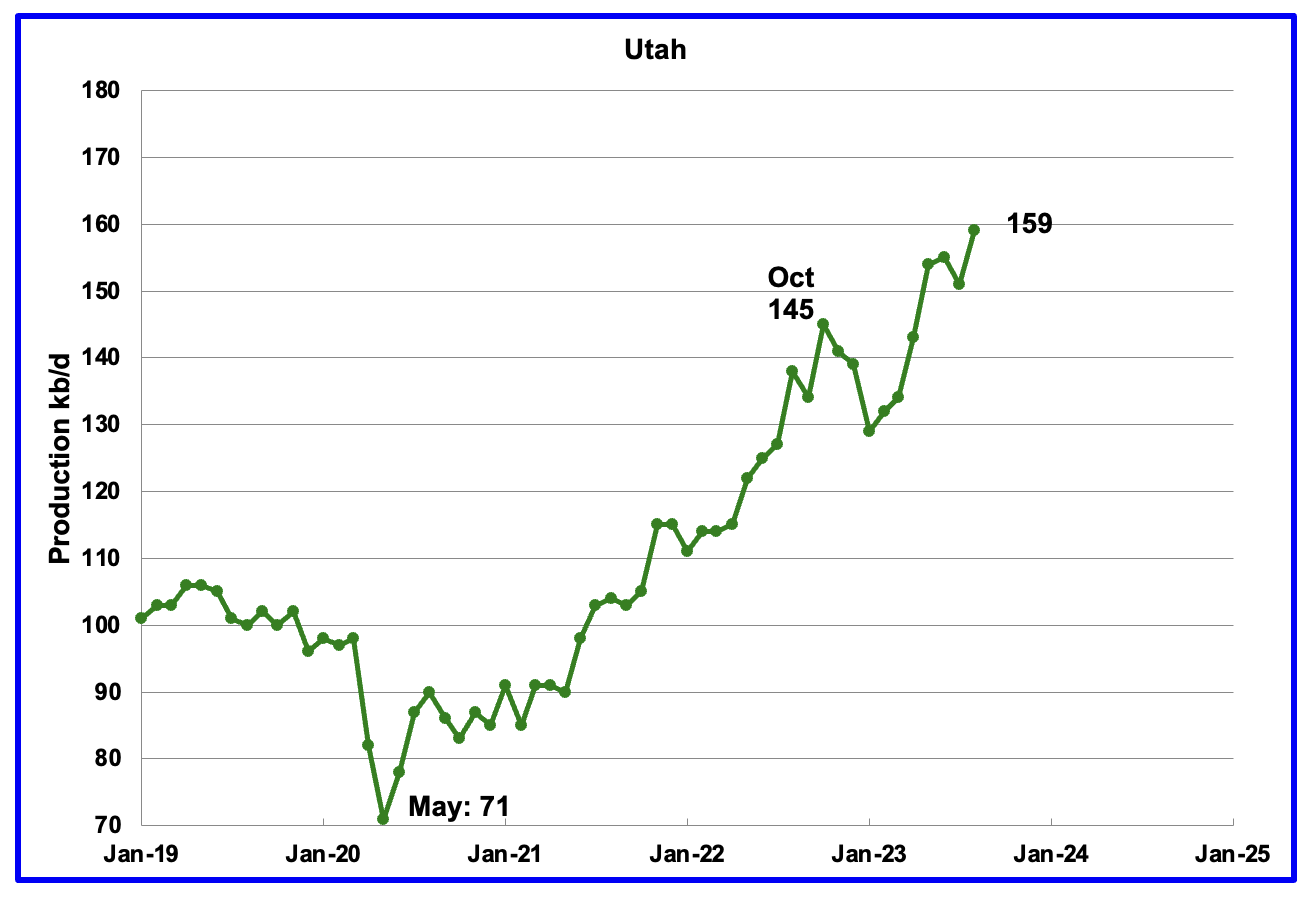
August's production increased by 8 kb/d to 159 kb/d to another record high. For the first 4 months of 2023, Utah had 7 rigs operating. Since May the number of operational rigs has bounced between 8 and 9, which may account for the increased production.
The increased production since February has come from the Uinta basin .
Louisiana's output entered a slow decline phase in November 2022. August's production increased by 3 kb/d to 96 kb/d and is 8 kb/d lower than May 2022.
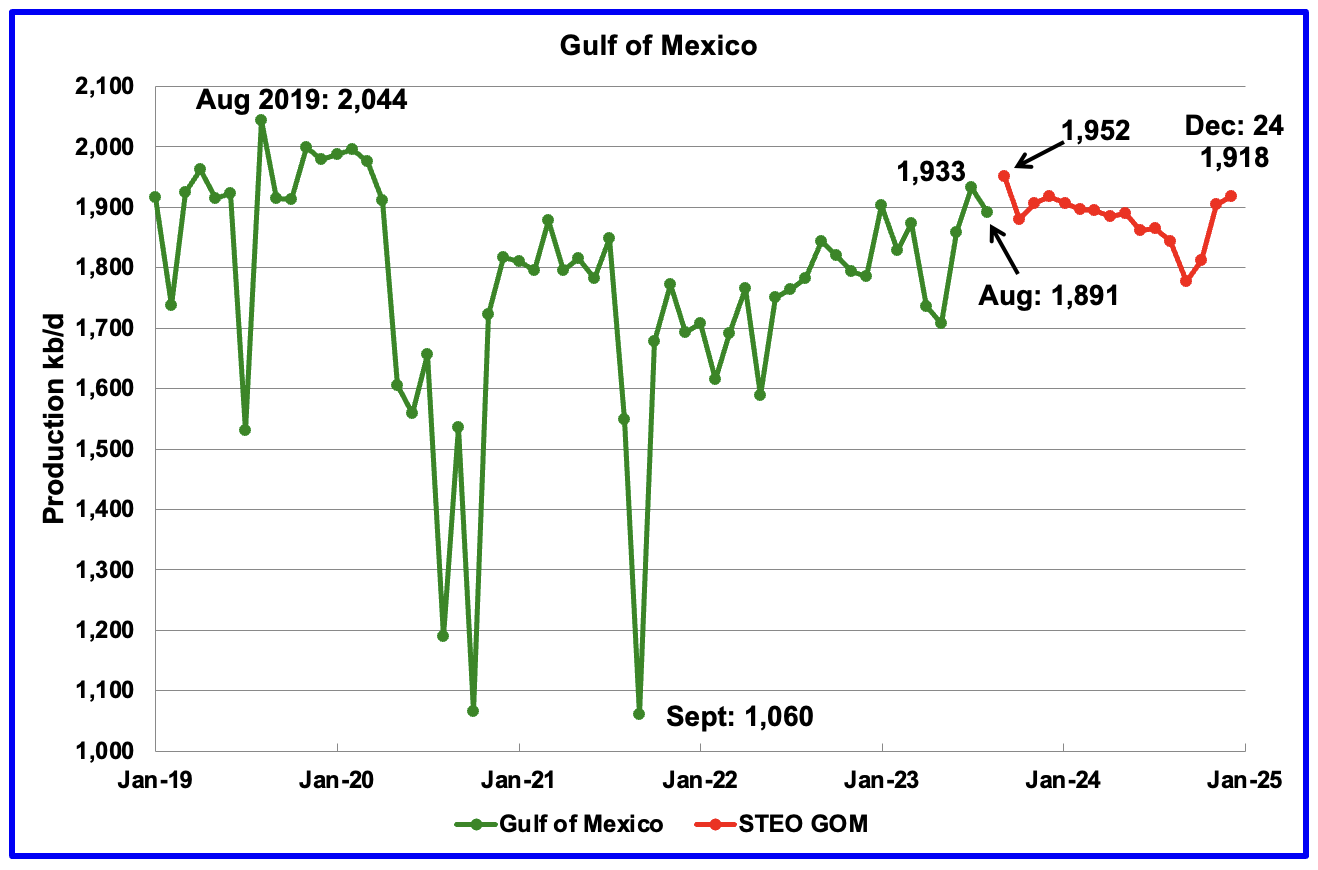
GOM production decreased by 42 kb/d in August to 1,891 kb/d. Over the two months, June and July, GOM output grew by 225 kb/d to 1,933 kb/d and is close to its peak for the next 16 months.
The October 2023 STEO projection for the GOM output has been added to this chart and it projects that output in September 2024 will drop to 1,777 kb/d before rebounding to 1,918 kb/d in December 2024.
The output rise from June to September to 1,952 kb/d is a combination of the Vito platform and Mad Dog 2 field coming on-line .
It is not known if the GOM decline shown after September 2023 is related to a combination of extensive maintenance and general depletion of wells.
A Different Perspective on US Oil Production
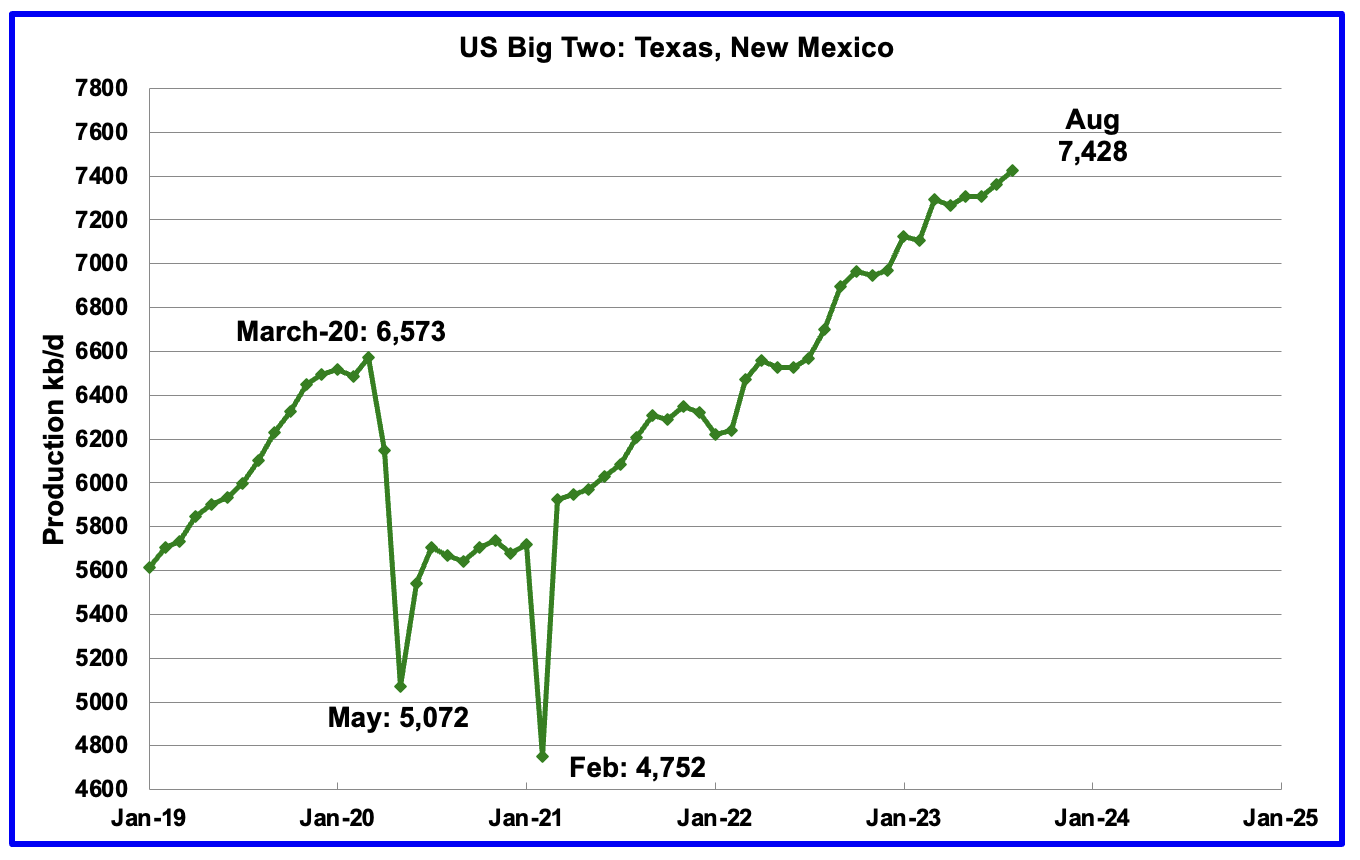
The Big Two states' combined oil output for Texas and New Mexico.
August's production in the Big Two states increased by a combined 65 kb/d to 7,428 kb/d with Texas adding 25 kb/d while New Mexico added 40 kb/d. Part of the increase is due to a downward revision to July's production.
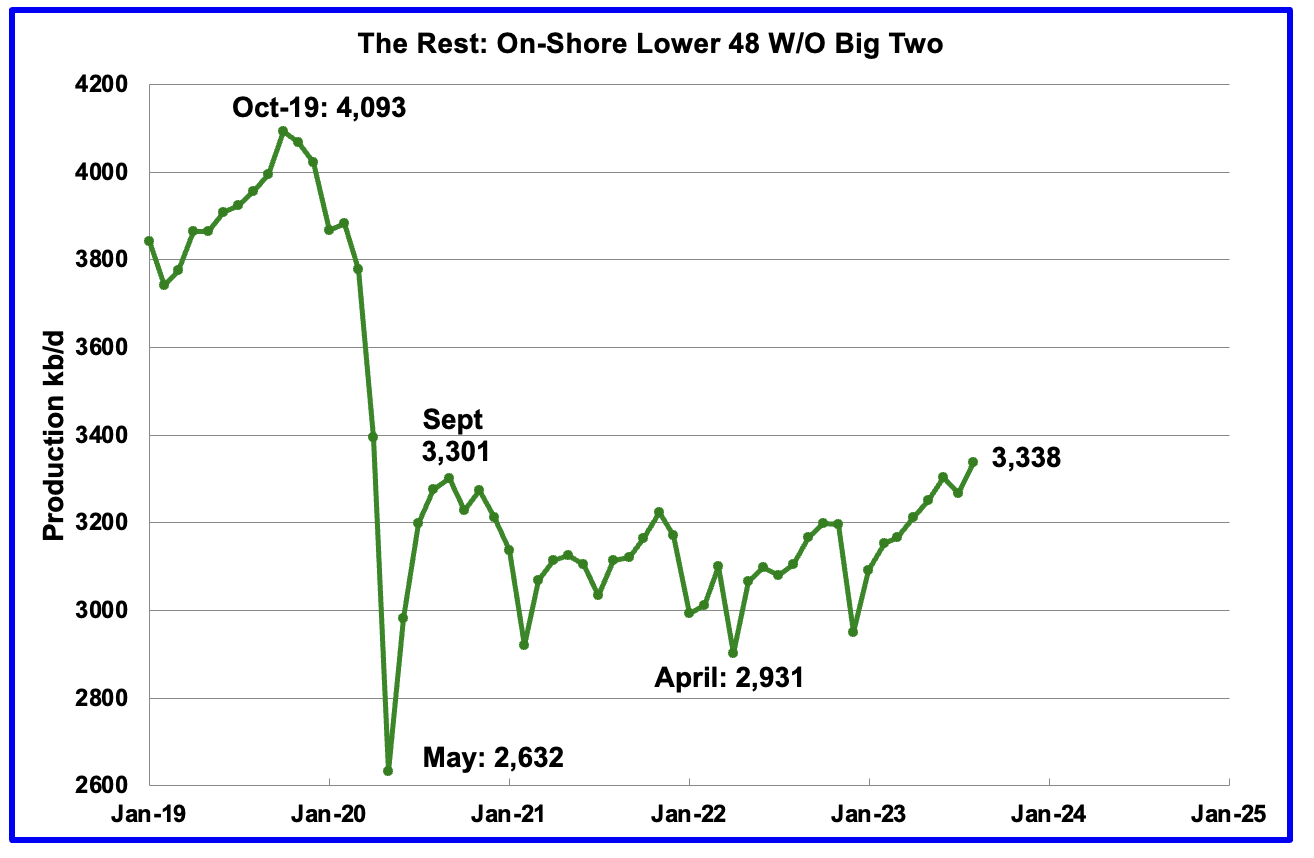
Oil production by The Rest
August's production in The Rest increased by 72 kb/d to 3,338 kb/d. This is a new high relative to the September 2020 high of 3,301 kb/d. More importantly, production increases in the rest are becoming significant and it should be noted that the August increase was greater than the increase in the Big Two .
The main takeaway from The Rest chart is that current production is 755 kb/d below the high of October 2019 and this appears to be a permanent loss that will never be recovered.
Permian Basin Report by Main Counties
This monthly Permian section has been added to the US report because of a range of views on whether Permian production will continue to grow or will peak over the next year or two. The issue was brought into focus recently by the Goehring and Rozencwajg Report which indicated that a few of the biggest Permian oil-producing counties were close to peaking or past peak. Also, comments by posters on this site have similar beliefs from hands-on experience.
This section will focus on the four largest oil-producing counties in the Permian, Lea, Eddy, Midland and Martin. It will track the oil and natural gas production and the associated Gas Oil Ratio (GOR) on a monthly basis. The data is taken from the state's government agencies for Texas and New Mexico . Typically the data for the latest two or three months is not complete and is revised upward as companies submit their updated information. Note that the natural gas production shown in the charts that is used to calculate the GOR is solely the gas coming from the oil wells .
Of particular interest will be the charts which plot oil production vs GOR for a county to see if a particular characteristic develops that indicates the field is close to entering the bubble point phase. While the GOR metric is best suited for characterizing individual wells, counties with closely spaced horizontal wells may display a behaviour similar to individual wells due to pressure cross-talking. For further information on the bubble point and GOR, there are a few good thoughts on the intricacies of the GOR in an earlier POB comment . Also, check this EIA topic on GOR.
This chart shows oil production from the 11 largest counties in the Permian. In the New Mexico Permian, there are two main counties, Lea and Eddy. The remaining nine are in Texas; Midland, Martin, Reeves, Andrews, Loving, Howard, Reagan, Glasscock and Upton. The graphs are updated to August.
The red markers show production from the two NM counties while the blue markers show total production for NM from the EIA monthly report. The EIA must have some correction factors to increase NM's output from NM's official site. The brown markers show output from the 9 biggest Permian counties in Texas.
The orange markers are production as reported last month for the Permian 11. The biggest change occurred with July, an increase of 357 kb/d due to updated reporting.
The OLS line for the Permian 11 was calculated over the range of July 21 to January 2023. After January 2023, we should begin to see production breaking away from that line, possibly starting in July if production is peaking. It will take another 4 to 5 months of production data to see if July production is relatively flat compared with January 2023. We are essentially looking for lower production growth after January 2023 to confirm that peaking is near.
New Mexico Permian
Over the past 6 weeks, drilling activity in Lea and Eddy County has been dropping. The rig count is down by 15 from a high of 104 in August. Rigs are leaving New Mexico.
Over the last three months, gas production has risen faster than oil production in Lea County. July oil production saw an increase of 7 kb/d to 1,020 kb/d because Lea County production was updated in August.
After much zigging and zagging, oil production in Lea County stabilized above 1,000 kb/d while the GOR started to increase in February and exceeded the semi-bounded GOR in July while production slowed and possibly has begun to decline. The data for the last two months, July and August, is incomplete.
This pattern of a zigging and zagging GOR within a semi-bounded GOR while oil production increases to some stable level and then moves out to a higher GOR to the right has shown up in a number of counties . See an additional three cases below. This is the second month in which Lea County has registered a GOR outside the semi-bounded GOR range .
Eddy County oil production is showing early signs that it has peaked .
The Eddy County GOR pattern is similar to Lea County except that Eddy has broken out from the semi-bounded range for a longer period. Does the breakout indicate that most of the wells in this county have entered the bubble point phase?
Texas Permian
During October, drilling activity has been increasing in Martin County while it has been dropping in Midland County. Since these two counties are adjacent, could these rigs just be moving between counties?
Natural Gas production is increasing while oil production drops in Midland County. Cannot find any explanation for the July spike in oil and gas production.
Oil production dropping and GOR staying constant. Has Midland entered the bubble phase?
Natural Gas production is increasing while oil production is dropping.
A slight rise in oil production and a small change in the GOR outside of the semi-bounded range. Note that Midland County is adjacent to Martin County and the pressure could be dropping in both fields.
All of the oil production vs GOR charts above are exhibiting characteristics indicating that the four largest oil-producing counties in the Permian are in the bubble point phase and are close to or past their peak.
Eagle Ford's Biggest Oil-Producing County
Both oil and gas production are falling in Karnes County and both are down close to 30% from the peak.
This is the GOR vs oil production for Karnes County but the GOR is still within its typical range while production is dropping. This may indicate that Karnes County wells have not entered the bubble point phase or weren't very gassy to start with.
Drilling Productivity Report
The Drilling Productivity Report (DPR) uses recent data on the total number of drilling rigs in operation along with estimates of drilling productivity and estimated changes in production from existing oil wells to provide estimated changes in oil production for the principal tight oil regions. The October DPR report forecasts production to November 2023 and the following charts are updated to November 2023. The DUC charts and Drilled Wells charts are updated to September 2023.
Above is the total oil production projected to November 2023 for the 7 DPR basins that the EIA tracks. Note that DPR production includes both LTO oil and oil from conventional wells.
The DPR is projecting that oil output for November 2023 will decrease by 51 kb/d to 9,553 kb/d. This is the third drop in a row since the August peak of 9,684 kb/d. The drop is due to the reduced drilling and completions that began earlier this year.
While the green graph shows DPR production dropping since August, it also had a significant upward revision to production since the last report, red graph. For October, total DPR production has been revised up by 213 kb/d, from 9,391 kb/d to 9,604 kb/d with the biggest increase occurring in the Permian basin.
According to the EIA's DPR report, Permian output continued to drop in November. It is expected to decrease by 30 kb/d to 5,901 kb/d. The last four months of production data clearly shows a dropping trend in monthly production.
However, while there is a projected drop for November, Permian production has been revised up. October production in the previous report has been revised from 5,773 kb/d to 5,931 kb/d, an increase of 142 kb/d.
During September, 441 wells were drilled and 451 were completed in the Permian. (Note that September is the latest month for DUC information). The completed wells added 369 kb/d to September's output for an average of 819 b/d/well. The overall decline was 391 kb/d which resulted in a net decrease for Permian output in September of 21 kb/d. Of the 451 completed wells in September, 477 would have been required to offset the decline, 26 fewer than the 451 completed.
Even though WTI has been over $80/b for most of August through October, drilling activity continues to decline. Is this spending prudence or fewer Tier 1 locations or both?
This chart shows the average first month total production from Permian wells tracked on a monthly basis. The total monthly production from the newest Permian wells in November is expected to be 366 kb/d. Recall that this production of 366 kb/d is offset by a decline of 396 kb/d for a net decline of 30 kb/d.
Output in the Eagle Ford basin has been in a downtrend since August. November's forecast projects output is expected to decrease by 19 kb/d to 1,119 kb/d. The Eagle Ford output was also revised up from the previous report.
At the beginning of the year 2023, 68 rigs were operating in the Eagle Ford basin. The rig count began to drop in mid-March to 60 and slowly dropped further to 47 in October .
The DPR forecasts Bakken output in November will be 1,270 kb/d unchanged from October. November production is now projected to be 25 kb/d higher than the post-pandemic peak of 1,245 kb/d in October 2020.
The North Dakota government reported that August production increased by 38 kb/d to 1,219 kb/d. Note that in the Bakken chart above, August production shows a similar spike in production, 46 kb/d.
Output in the Niobrara continues to increase slowly. November's output increased by 4 kb/d to 684 kb/d.
Production increased due to the addition of rigs into the basin but stabilized at 16 ± 1 rigs in March and April. However, from August to October, the rig count dropped to14.
DUCs and Drilled Wells
The number of DUCs available for completion in the Permian and the four major DPR oil basins has fallen every month since July 2020 and continued to decrease in September. September DUCs decreased by 46 to 2,472. Of the 46 DUCs decrease, 14 came from the Bakken and 15 from the Niobrara.
In these 4 basins, 742 wells were drilled while 696 were completed. Both drilled wells and completions are down from higher levels in late 2022 and early 2023.
In the Permian, the monthly completion rate has been showing signs of slowing since the October 2022 high of 535.
In September 2023, 451 wells were completed while 441 new wells were drilled. The gap between completed and drilled wells in the Permian is now very small compared to late 2022 and early 2023.
The Permian, as of September, had 839 DUCs remaining and the completion rate was 451 wells/mth. This means the current cycle time between drilling and completions is 1.86 months or 57 days.
Editor's Note: The summary bullets for this article were chosen by Seeking Alpha editors.
For further details see:
U.S. August Oil Production At Record High