USOI - U.S. March Oil Production At Post-Pandemic High
2023-06-05 04:39:00 ET
Summary
- U.S. March oil production increased by 171 kb/d to 12,696 kb/d, a new post-pandemic high.
- On a YoY basis, US production increased by 995 kb/d with the majority, 778 kb/d having come from Texas and New Mexico.
- The May DPR production report is essentially the same as the April report with minimal changes, due to downward revisions to the April report.
A guest post by Ovi
All of the Crude plus Condensate (C + C) production data for the US state charts comes from the EIA's Petroleum Supply monthly PSM, which provides updated information up to March 2023.
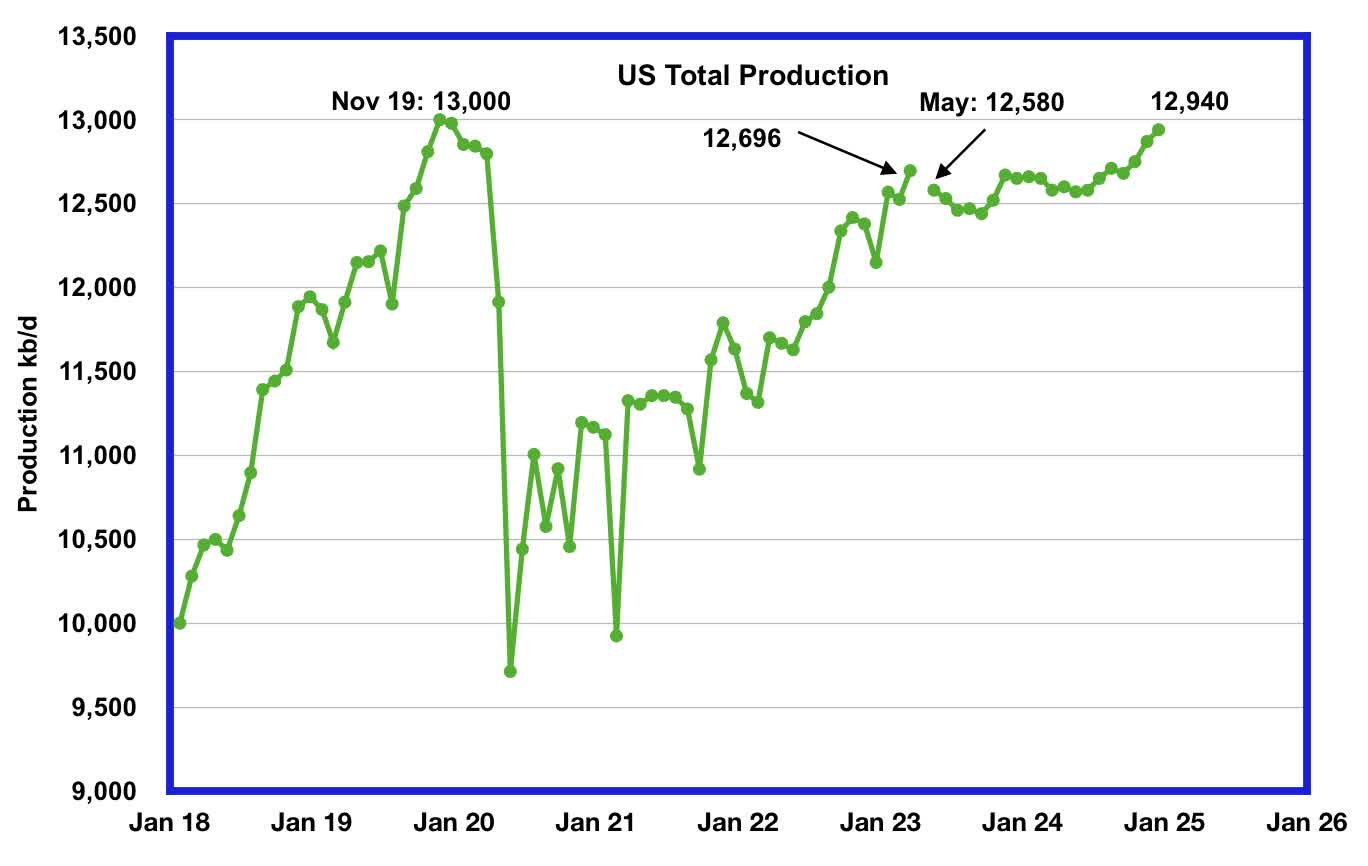
U.S. March oil production increased by 171 kb/d to 12,696 kb/d, a new post-pandemic high. Note that February’s output was also revised up by 42 kb/d from 12,483 to 12,525 kb/d. So, relative to the initial EIA February report, production is up by 213 kb/d.
The EIA’s forecast production drop that starts in May 2023 could be associated with the drop in completions that started in early May, combined with a projected drop in GOM production.
In March, seven of the ten states had production gains, with Texas having the largest.
The green graph from May 2023 onward is taken from the May 2023 STEO and is the forecast for U.S. oil production from May 2023 to December 2024. Output for December 2024 is expected to be 12,940 kb/d which is 60 kb/d lower than the November 2019 peak of 13,000 kb/d. Production will be essentially flat from May 2023 to September 2024.
Oil Production Ranked by State
Listed above are the 10 states with the largest US oil production along with the Gulf of Mexico. These 10 states accounted for 82.0% of all U.S. oil production out of a total production of 12,696 kb/d in March 2023. Note that New Mexico oil production, if it keeps increasing as it did over this past year, could surpass the GOM in the near future.
On a YoY basis, US production increased by 995 kb/d with the majority, 778 kb/d having come from Texas and New Mexico.
State Oil Production Charts
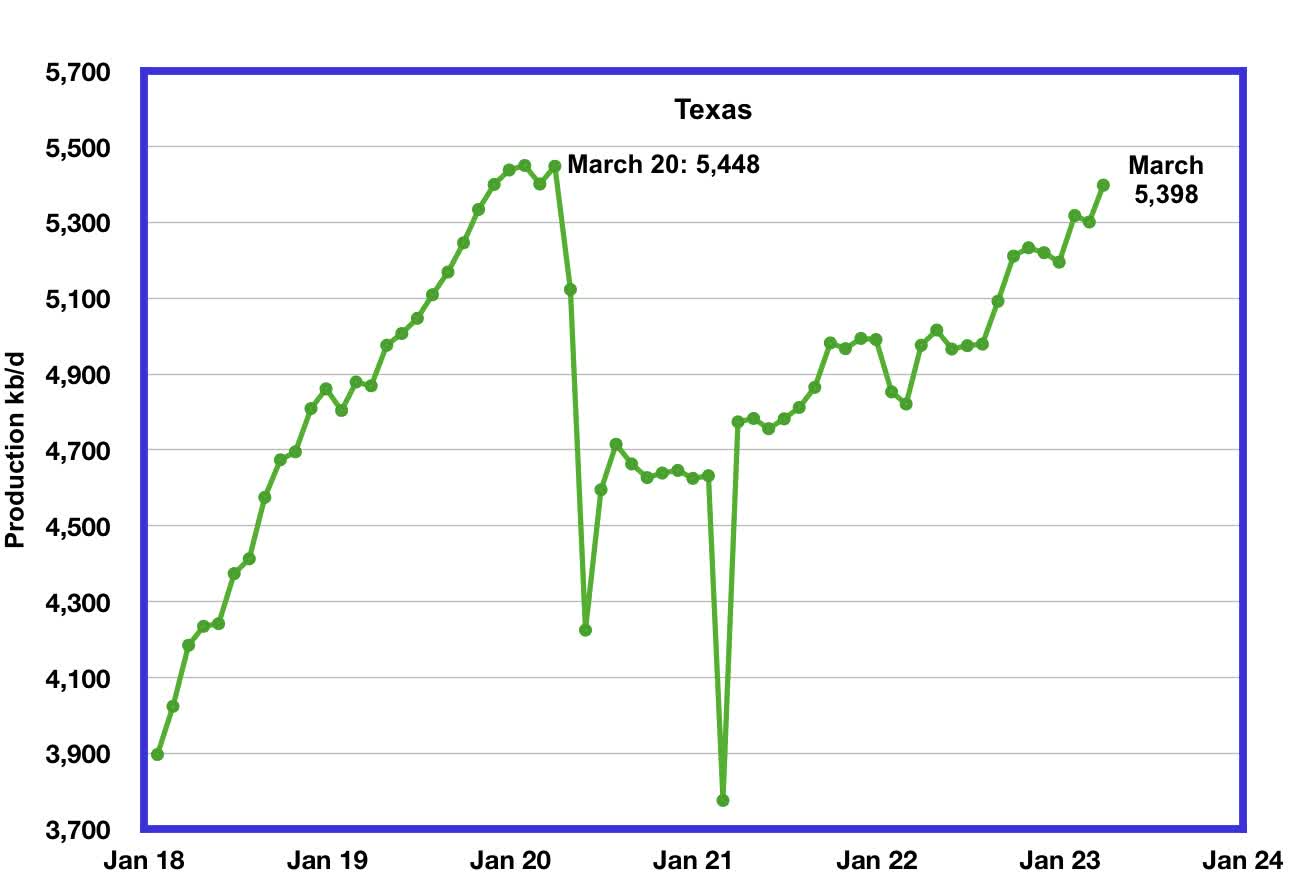
Texas production increased by 97 kb/d in March to a new post-pandemic high of 5,398 kb/d. March’s output is 50 kb/d short of the March 2020 high of 5,448 kb/d.
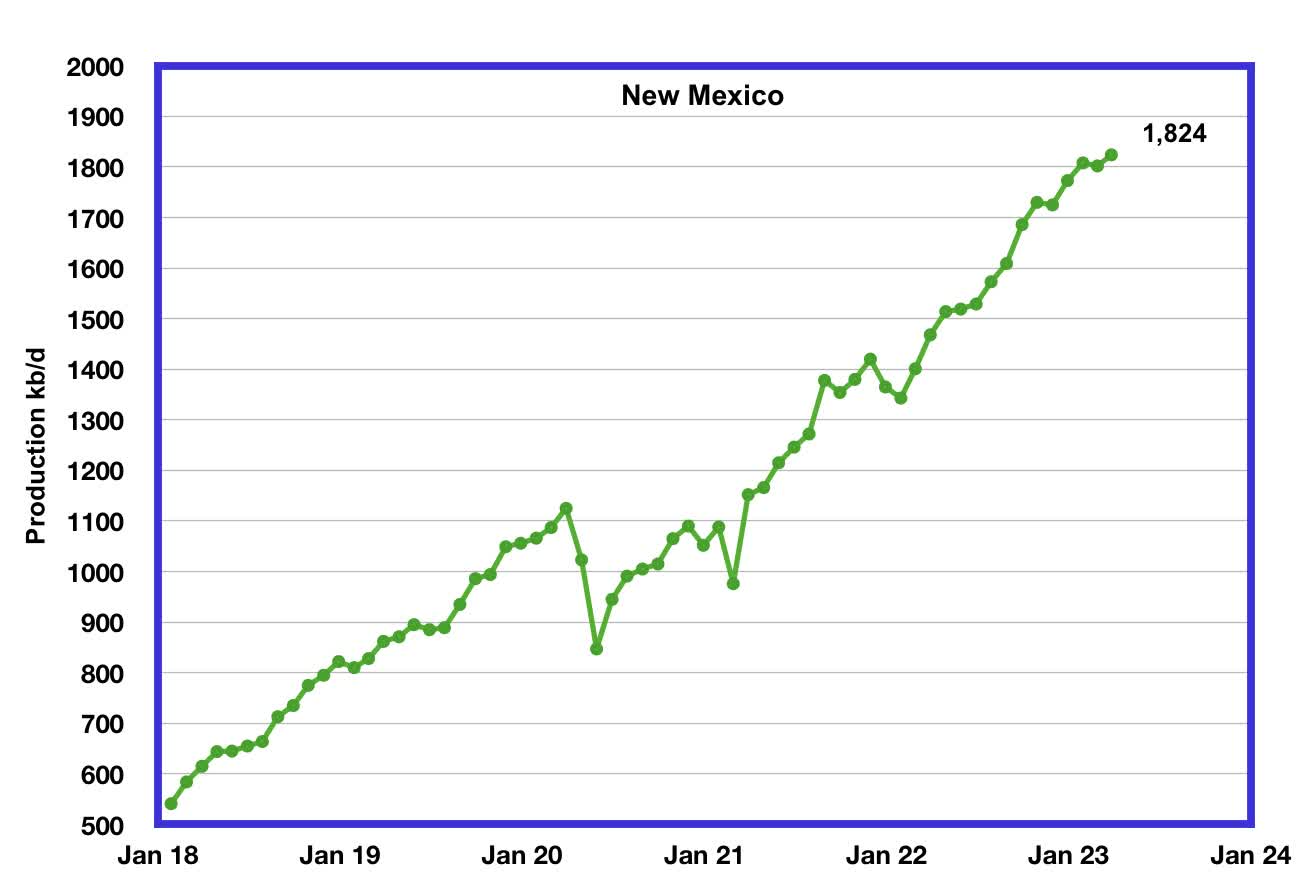
New Mexico’s March production continued at a record level but was little changed from February. March’s production increased by 22 kb/d to 1,824 kb/d.
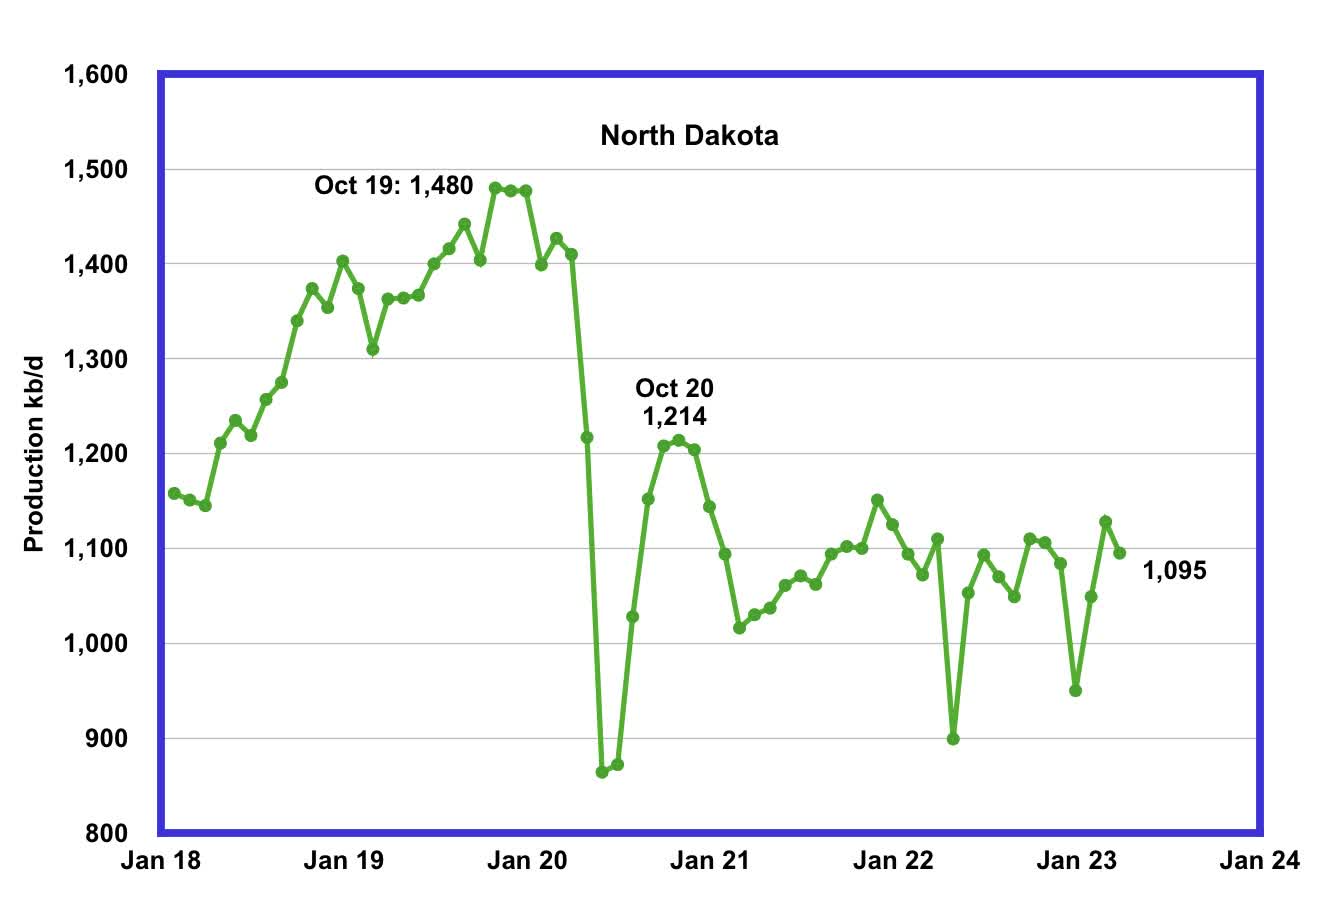
North Dakota’s March oil production has recovered from December’s extreme cold weather-impacted production. However, March’s output decreased to 1,095 kb/d, a drop of 33 kb/d from February. Current production is unchanged from January 2021 and production over the past two years is showing signs of being on a plateau.
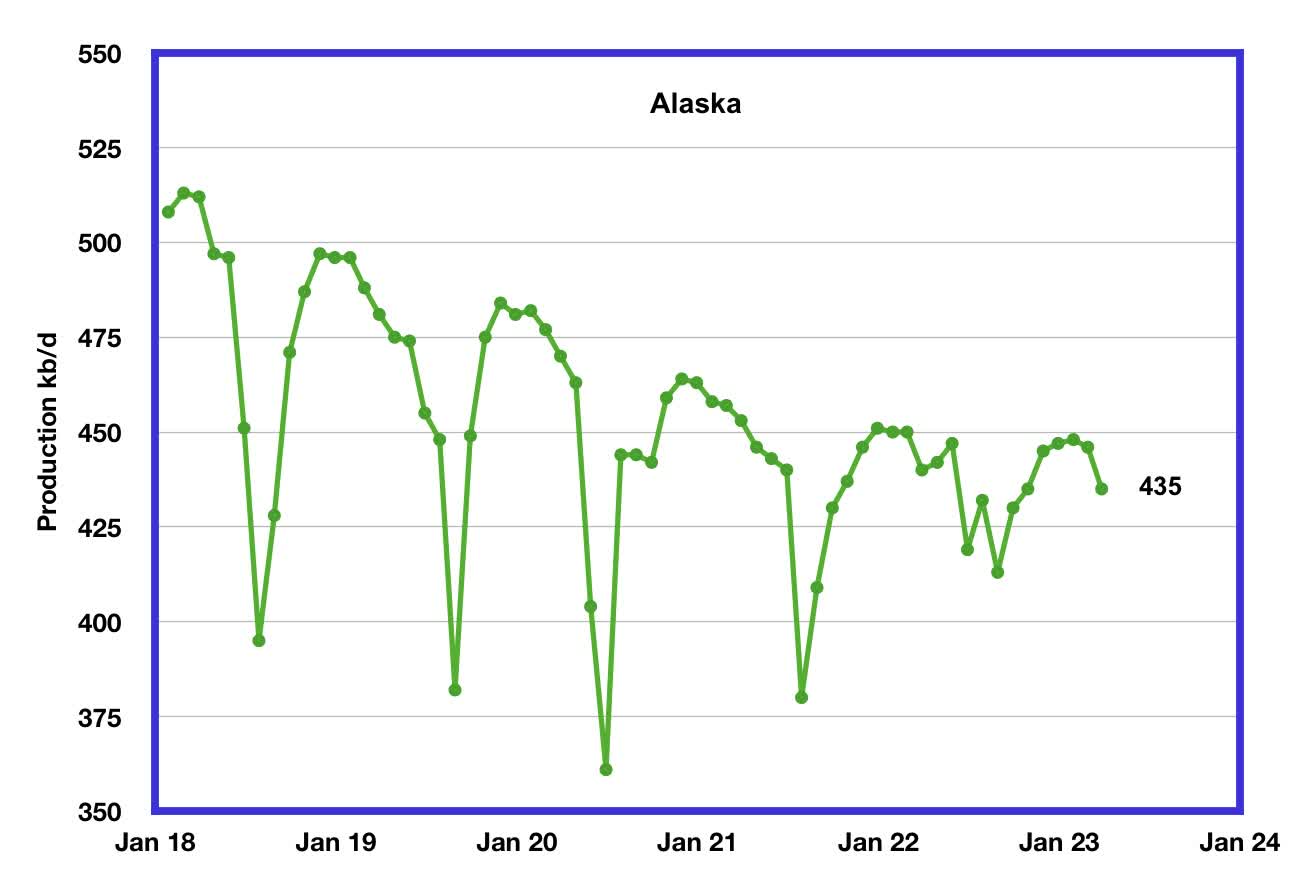
Alaska?s March output decreased by 11 kb/d to 435 kb/d. February/March is the beginning of Alaska’s annual production declining phase.
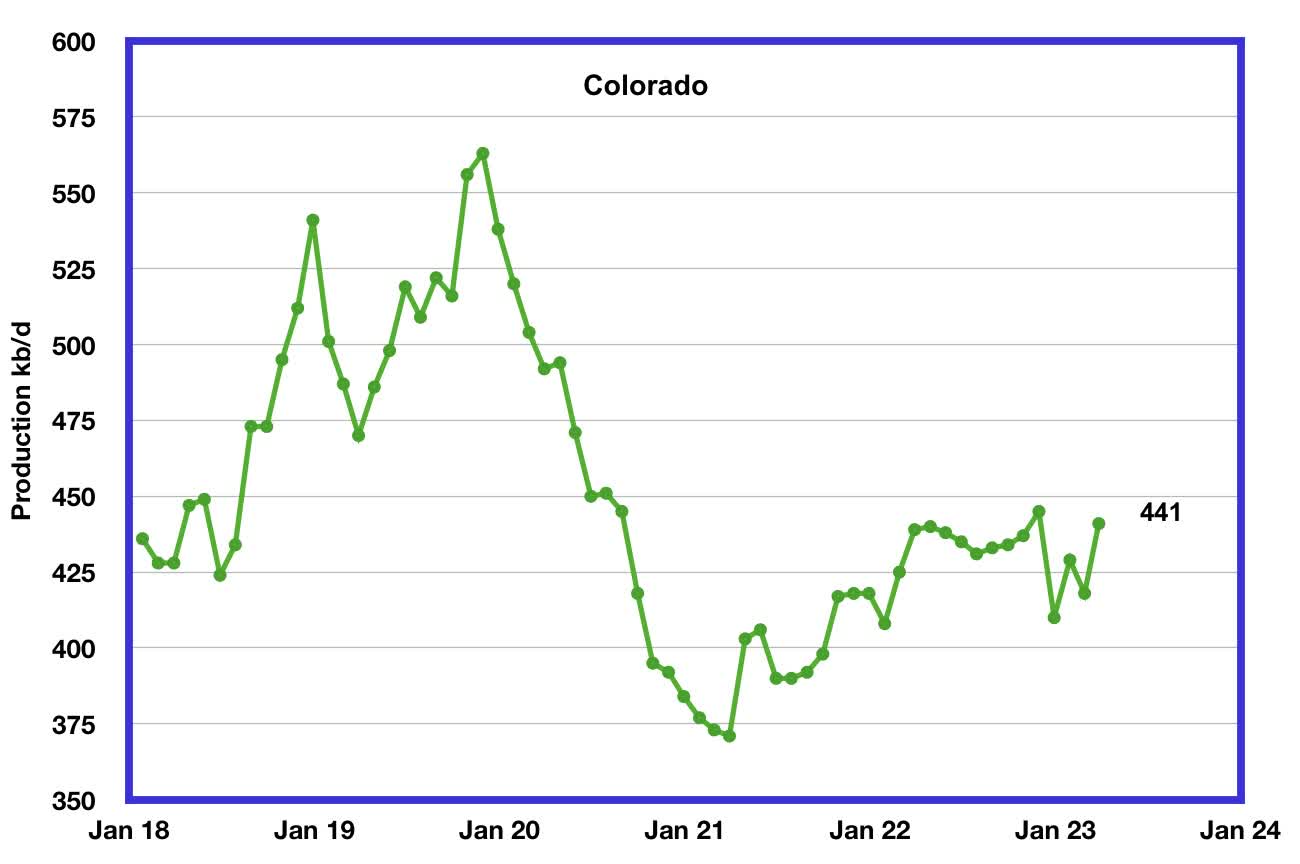
Colorado?s March production increased by 23 kb/d to 441 kb/d.
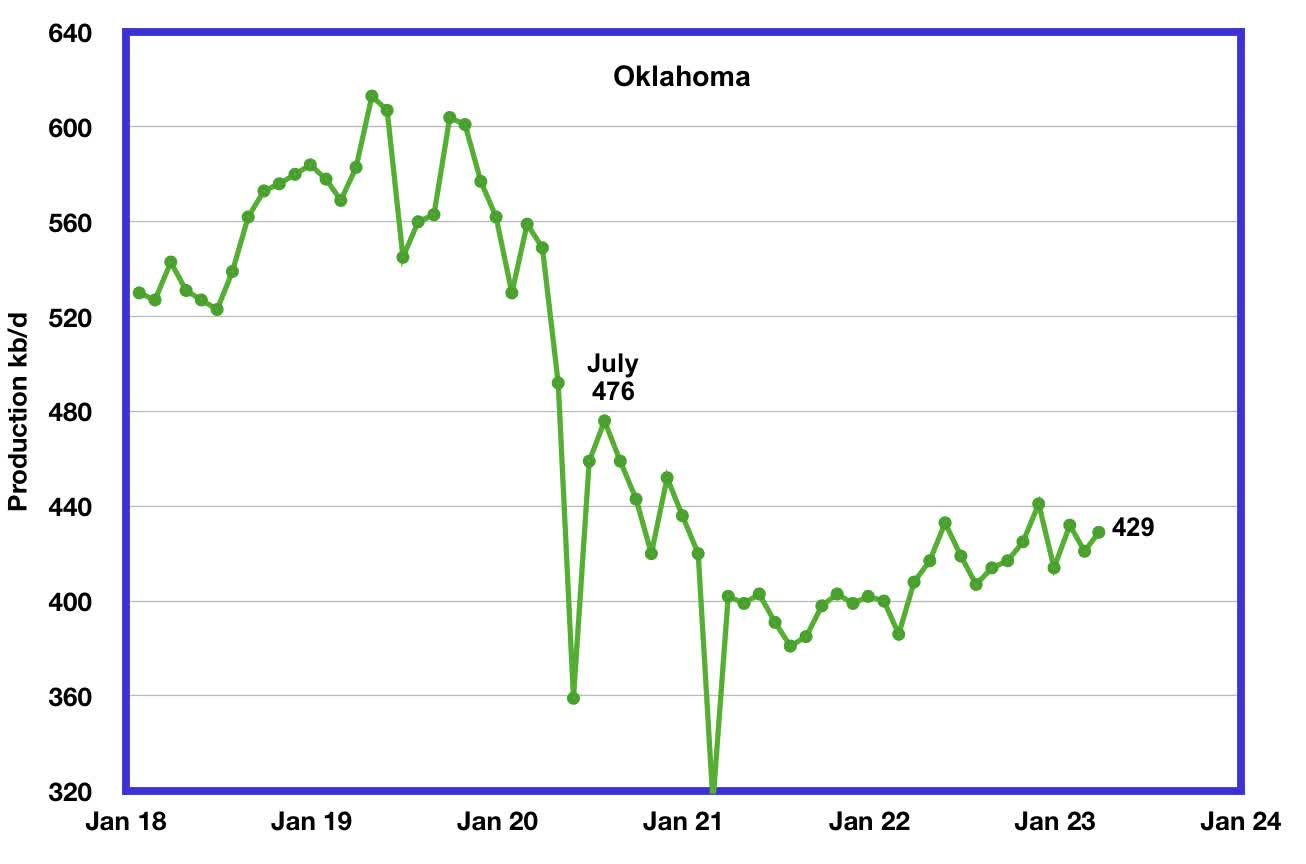
Oklahoma’s output in March rose by 8 kb/d to 429 kb/d. Production remains 47 kb/d below the post-pandemic July 2020 high of 476 kb/d.
California?s overall slow output decline trend accelerated in January and February. However, for March, production rose by 2 kb/d to 305 kb/d.
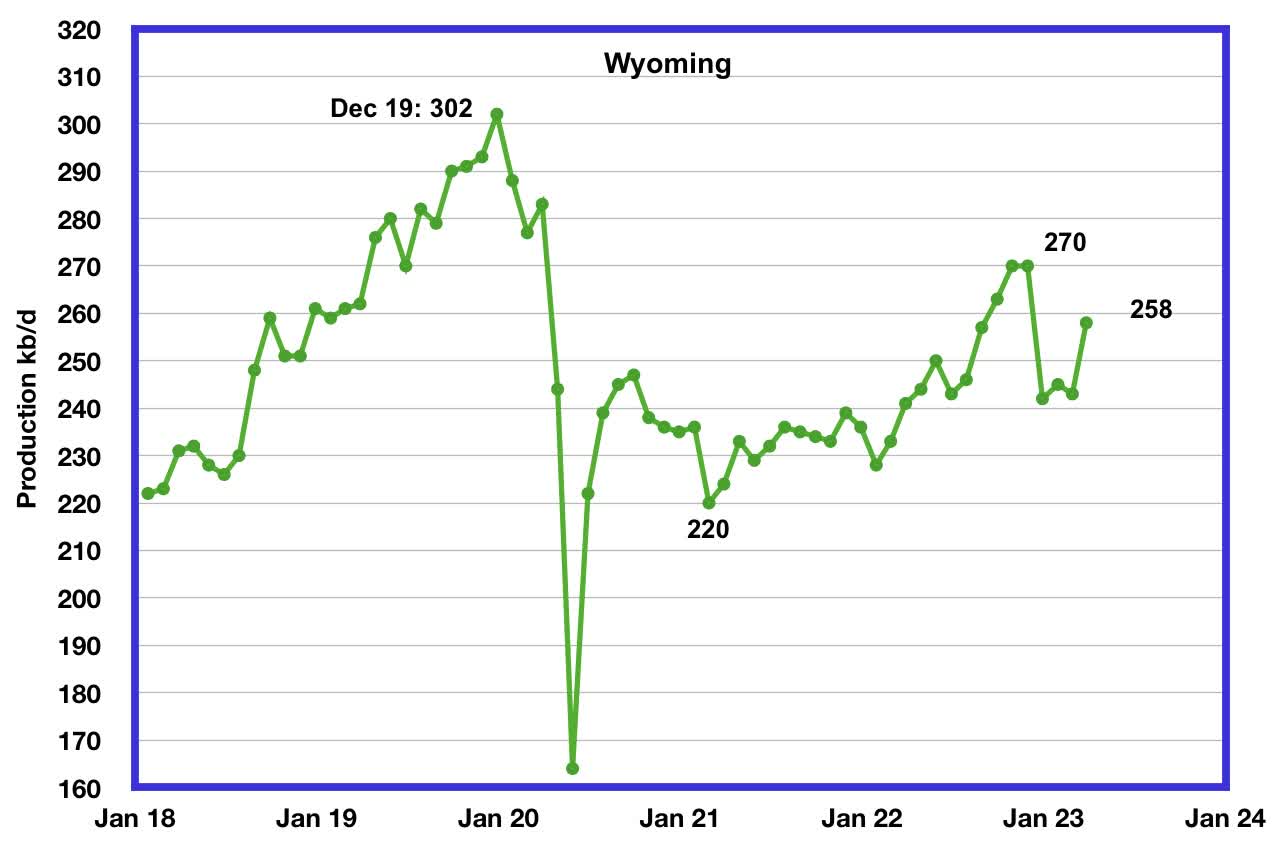
Wyoming’s oil production has been on a slow unsteady uptrend from the low of 220 kb/d in February 2021 due to increased drilling. October and November 2022 output reached a post-pandemic high of 270 kb/d. March’s oil production increased by 15 kb/d to 258 kb/d.
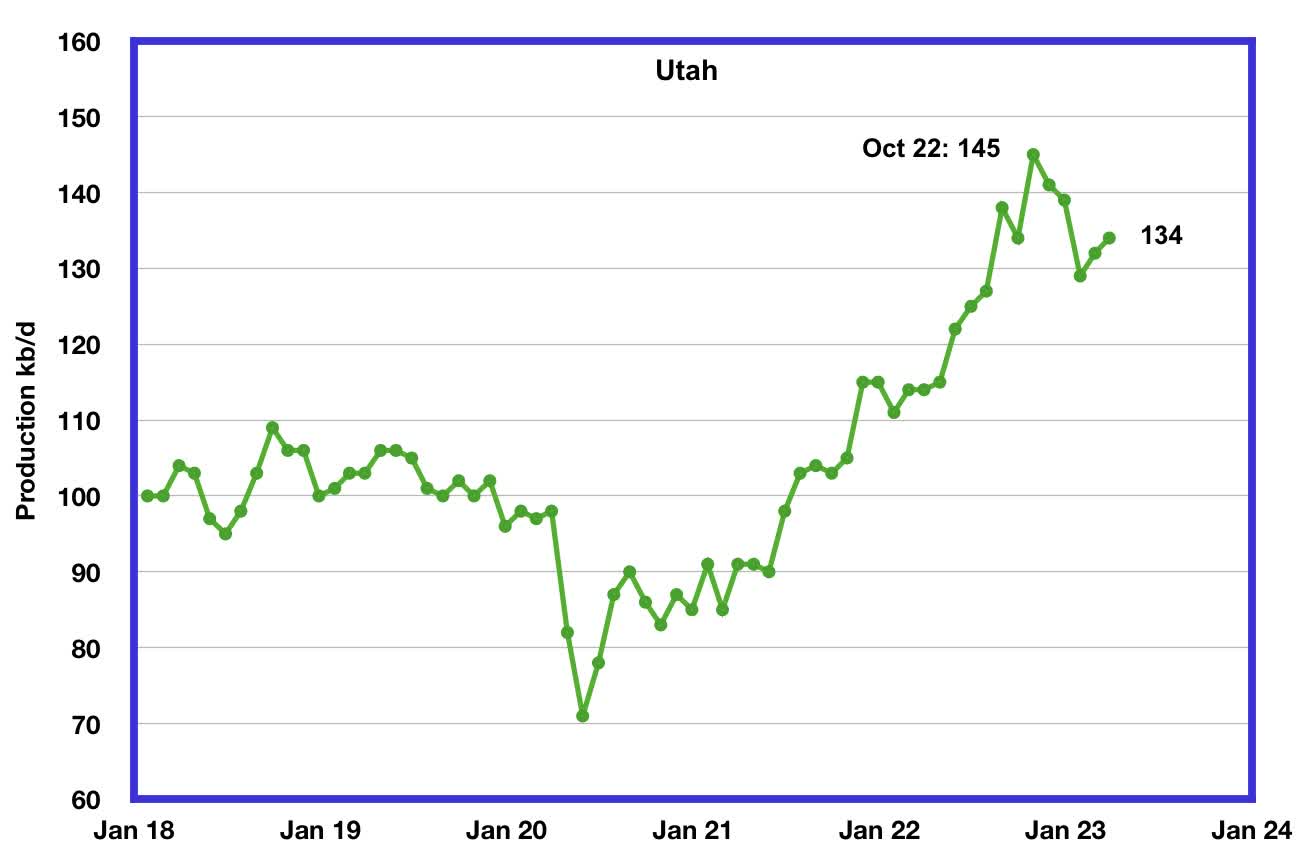
Utah’s oil production increased steadily since early 2021 and reached a new high of 145 kb/d in October 2022. However, since then, production has declined by 11 kb/d to 134 kb/d in March.
Louisiana’s output rose from the low of 63 kb/d in September 2021 to 104 kb/d in May 2022. Since then output has entered a slow decline. March’s production dropped by 2 kb/d to 97 kb/d and is 7 kb/d lower than May 2022.
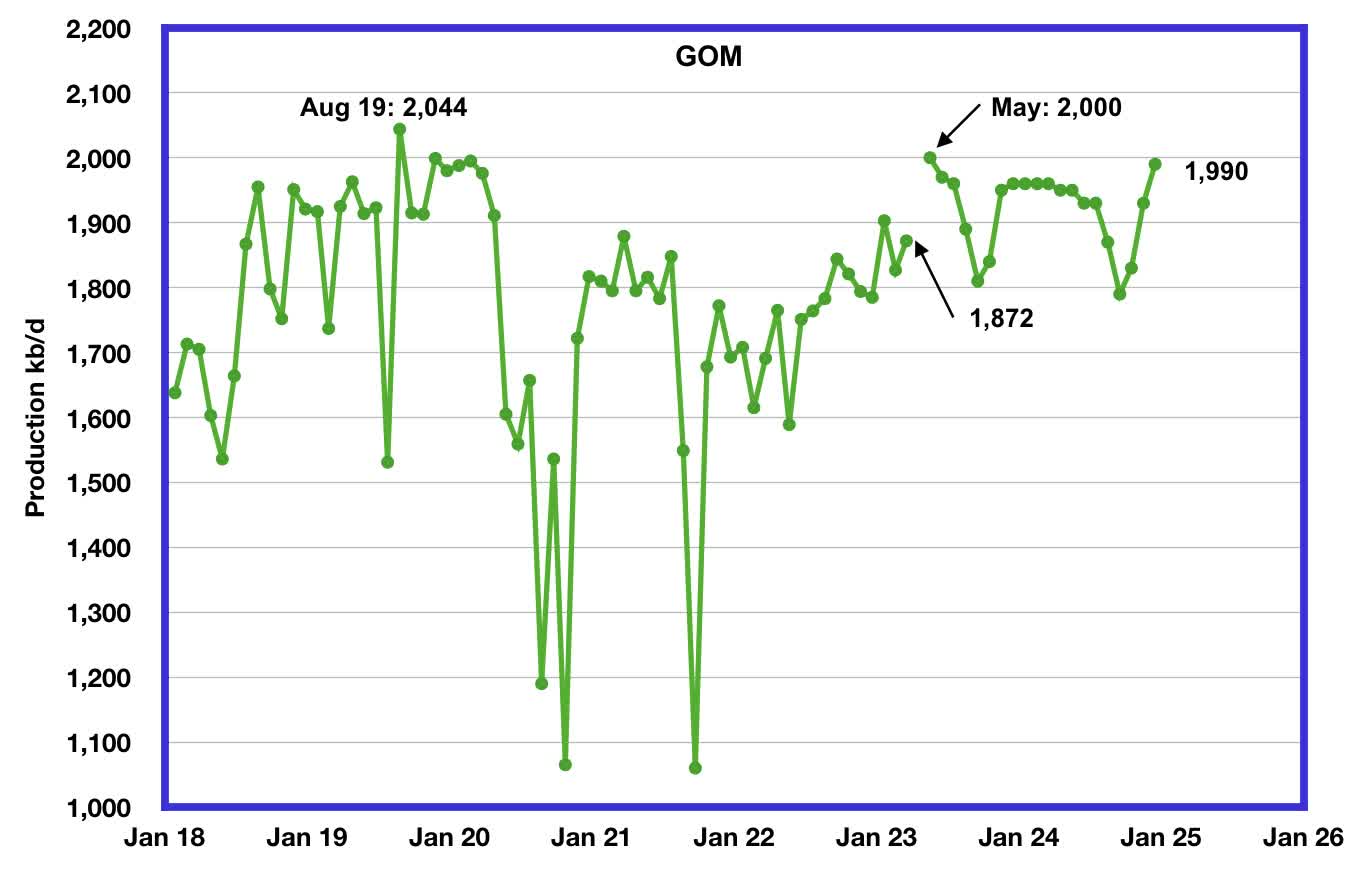
GOM production increased by 45 kb/d in March to 1,872 kb/d. If the GOM was a state, its production would normally rank second behind Texas.
The May 2023 STEO projection for the GOM output has been added to this chart and projects that output in May 2023 will rise to 2,000 kb/d. This could be a reasonable estimate since Shell announced that the Vito platform had begun production on February 15, 2023.
According to this source , GOM production is expected to reach 2,000 kb/d in 2023. “Annual GOM production fell from an all-time high of 1.9 MMBpd in 2019 due to the pandemic and hurricane-related interruptions, but production should be setting new records soon. For 2023, the Bureau of Ocean Energy Management ((BOEM)) expects a 14.7% increase in oil production from 2022 levels to 2.0 MMBpd. As shown in the chart below, (Note: Chart is shown in the link) production is forecasted to increase to 2.1 MMBpd in the middle of this decade and then level off at 1.9 MMBpd in 2030.”
It is not known if the GOM decline shown after May 2023 is related to extensive maintenance.
A Different Perspective on US Oil Production
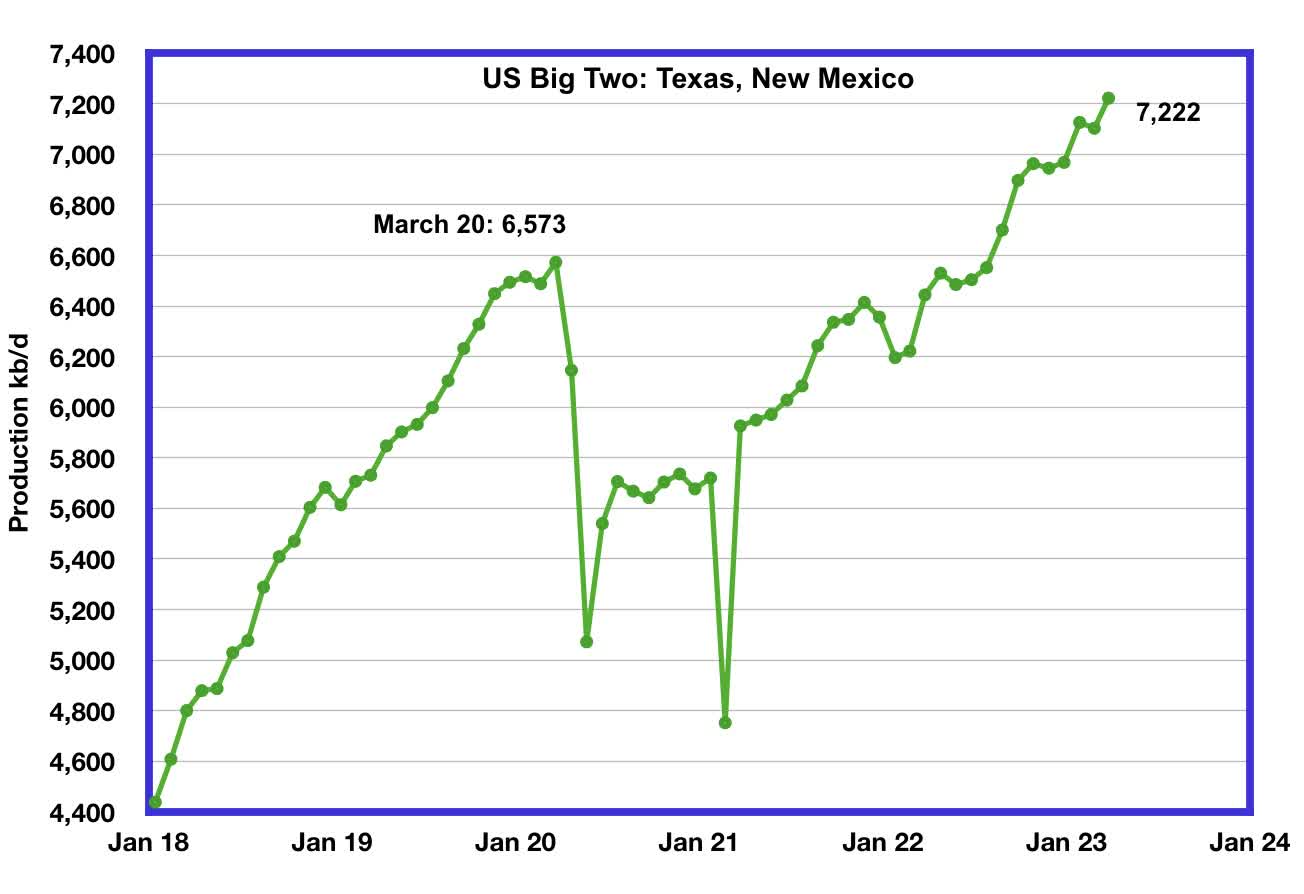
The Big Two states’ combined oil output for Texas and New Mexico.
March’s production in the Big Two states increased by a combined 119 kb/d to 7,222 kb/d with Texas contributing 97 kb/d while New Mexico added 22 kb/d.
Oil production by The Rest
In March production in The Rest rose by 18 kb/d to 3,167 kb/d. From May 2021, oil production in The Rest has been range bound between 3,000 kb/d and 3,200 kb/d and has not given any clear indication of being in decline or rising.
The main takeaway from The Rest chart is that current production is 926 kb/d below the high of October 2019. The question we need answered is “Is this a permanent loss that will never be recovered? ” All indications continue to be that this is a permanent loss.
Frac Spreads
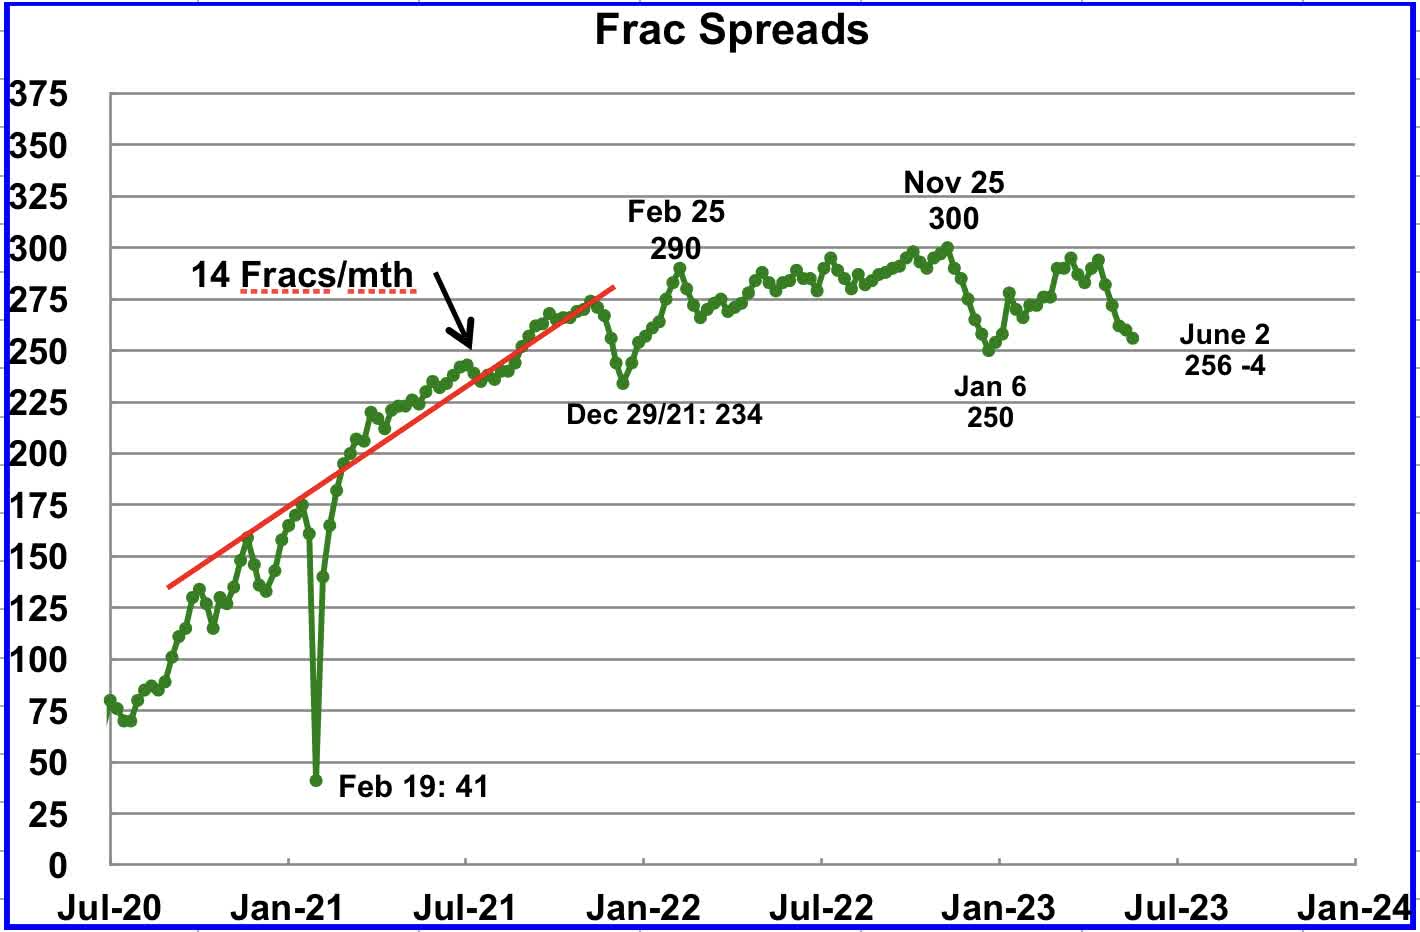
For frac spreads, the general trend since the week of January 6, 2023 can best be described as recovering from the slowdown associated with the 2022 Thanksgiving and Christmas holidays. This trend is a repeat of what happened last year. However, there is one difference. Last year the recovery took place over 9 weeks while this year it took 16 before the current plunge started.
Frac spreads have dropped by 10 for the last two weeks to 262 and are down 26 from a year ago and down 38 from the high of 300 in November 2022. Note that both Hz oil rigs and frac spreads hit a high in November 2022.
For the week ending June 2, the Frac count decreased by 4 to 256 and down 44 from the high of 300 in November 2022. When will the decrease in frac spreads result in a reduced oil production rate?
Note that these 256 frac spreads include both gas and oil spreads.
Drilling Productivity Report
The Drilling Productivity Report ((DPR)) uses recent data on the total number of drilling rigs in operation along with estimates of drilling productivity and estimated changes in production from existing oil wells to provide estimated changes in oil production for the principal tight oil regions. The May DPR report forecasts production to June 2023 and the following charts are updated to June 2023. The DUC charts are updated to April.
Above is the total oil production projected to June 2023 for the 7 DPR basins that the EIA tracks. Note that DPR production includes both LTO oil and oil from conventional wells.
The May DPR production report is essentially the same as the April report with minimal changes, due to downward revisions to the April report. For instance, May output, red markers, was revised down by 38 kb/d from 9,328 kb/d to 9,290 kb/d. The DPR is projecting that oil output for June 2023 will increase by 42 kb/d to 9,332 kb/d, a new all-time high but still just 4 kb/d higher than was forecast in April.
Note the rolling-over production trend over the past five months. See next chart.
This chart shows the DPR total production increments tracked on a monthly basis. What is notable is the reduced month-to-month volatility since February 2023. The January 2023 spike is due to the weather-related December oil production drop.
The more interesting trend to notice is the declining monthly changes in the production rate. March’s production increase was 86 kb/d/mth while June’s increase dropped by 44 kb/d/mth to 42 kb/d/mth. This short-term trend is hinting at an upcoming plateau in Permian production since it is the dominant producer. Even output at 42 kb/d/mth translates to 504 kb/d/yr, which is high.
The issue is whether this slowing trend is the result of management’s decision on how to deploy its revenue, investors vs production, or is it related to geology, fewer Tier 1 locations along with the Permian gassing out?
Permian output continues to rise in June. It is expected to increase by 15 kb/d to 5,707 kb/d.
If the Permian were part of OPEC, at 5,707 kb/d it would be the second largest producer after Saudi Arabia. June’s output is 791 kb/d higher than the pre-pandemic high of 4,916 kb/d.
In March, the monthly production increase was 31 kb/d/mth. In June it drops to 15 kb/d/mth. This plateauing trend in the chart is very visible over the last four months , which is similar to the overall trend for the combined production in all of the DPR basins.
During April, 474 wells were drilled and 510 were completed in the Permian. (Note that April is the latest month for DUC information). The completed wells added 372 kb/d to April’s output for an average of 730 b/d/well. The overall decline was 350 kb/d which resulted in a net increase for Permian output of 22 kb/d. Of the 510 completed wells, 479 were required to offset the decline.
Note the increased use of DUCs to maintain production. For June, well completions exceeded drilled wells by 36 while for May, it was 32.
The DPR monthly increments for the Permian have been very volatile over the past year and a half but have settled down over the past 4 months and indicate that Permian production appears to be slowly rolling over as noted in the previous chart.
As can be seen in March, Permian production increased by 32 kb/d. In June it is expected to increase by 15 kb/d, 1/2 the March rate. May’s rate was 13 kb/d.
This chart shows the average first-month total production from Permian wells tracked on a monthly basis. The total monthly production from the newest Permian wells in June continues to be at the 375 kb/d level. To achieve that production level in June, drillers completed 36 more wells than were drilled. In other words, the Permian DUC count dropped by 36 and more DUCs are required to maintain production at a steady rate.
Output in the Eagle Ford basin has been in a generally flat trend since March 2021, fluctuating over a range of between 1,050 kb/d to 1,150 kb/d. Since the December 2022 weather-induced production drop, production has been recovering slowly. June’s output is expected to increase by 2 kb/d to 1,108 kb/d. Revisions to May’s report have led to June’s output being 33 kb/d lower than the reported 1,141 kb/d in the May report.
At the beginning of the year 2023, 68 rigs were operating in the Eagle Ford basin. The rig count began to drop in mid-March to 60 and dropped further to 59 in Mid-May.
The DPR forecasts Bakken output in June will be 1,232 kb/d, an increase of 13 kb/d over May.
Output in Niobrara continues to increase slowly. June’s output increased by 5 kb/d to 650 kb/d.
Production increased due to the addition of rigs into the basin but now has stabilized at 16 ± 1 rigs in April and May.
DUCs and Drilled Wells
Again there has been a significant revision to the DUC data. In the May report, the total number of DUCs over the last five months was reduced by approximately 200. In the June report the DUCs have been revised back up by approximately 150.
The number of DUCs available for completion in the Permian and the four major DPR oil basins has fallen every month since July 2020 and continued to decrease in April. April DUCs decreased by 49, 21 more than in March. The biggest decrease came from the Permian where DUCs decreased by 36 while Bakken DUCs dropped by 12 and the Niobrara added 7.
The Permian basin had the similar revisions as the four basins. Permian DUCs were revised down in May and up in June. In June Permian DUCs were revised up by 150 and the monthly trend reverted to decreasing. April Permian DUCs decreased by 36 to 915 because 474 wells were drilled and 510 were completed.
In these 4 basins, 780 wells were drilled while 829 were completed for a net decrease of 49 DUCs in April.
In the Permian, the monthly completion rate has been showing signs of stabilizing since the October high of 520. This is consistent with the frac spread chart shown above where there has been slow growth in frac spreads since February 2022. The number of wells drilled in the Permian is now showing signs of plateauing at the 475 level.
In April, 510 wells were completed, an increase of 5 over March. During April, 474 new wells were drilled, an increase 11 over March. The gap between completed and drilled wells in the Permian has now opened up to 36.
The Permian, as of April had 915 DUCs and the completion rate was 510 wells/mth. This means that the current cycle time between drilling and completion is 1.79 months or 55 days.
Editor's Note: The summary bullets for this article were chosen by Seeking Alpha editors.
For further details see:
U.S. March Oil Production At Post-Pandemic High