META - Undervalued Dividend Stocks Watchlist - Five Dividend Growth Stocks Leading The Way
2023-07-23 09:00:00 ET
Summary
- The majority of companies on the Undervalued Dividend Stocks Watchlist have seen positive price performance, with East West Bancorp, EOG Resources, Intercontinental Exchange, Nordson, and T. Rowe Price showing impressive growth.
- Investors should consider dividend yield, earnings growth, and debt metrics when determining if a company is undervalued and worth investing in.
- Next week will include earnings announcements of some big players that could push the market higher or alternatively cut the party short.
It is closing in on one full month since my last update on t he Undervalued Dividend Stocks Watchlist and it shouldn't surprise readers to know that the stocks on this list have performed well overall. When looking at the three big indexes it makes sense that the majority of stocks on the watchlist have seen some level of improvement.
The image below provides some insight into how these indexes have performed since that article was published.
I wanted to compare how the notable names below compared to the big three indexes from June 1, 2023, to July 17th, 2023.
How Has The Watchlist Performed?
The majority of companies on the watchlist have seen positive price performance with the exception of the insurance sector, utilities/pipelines, and REITs (specifically referring to telecom companies Crown Castle International ( CCI ) and American Tower ( AMT )). Outside of these sectors, we saw some pretty impressive price improvements from the following companies:
- East West Bancorp ( EWBC )
- EOG Resources ( EOG )
- Intercontinental Exchange ( ICE )
- Nordson ( NDSN )
- T. Rowe Price ( TROW )
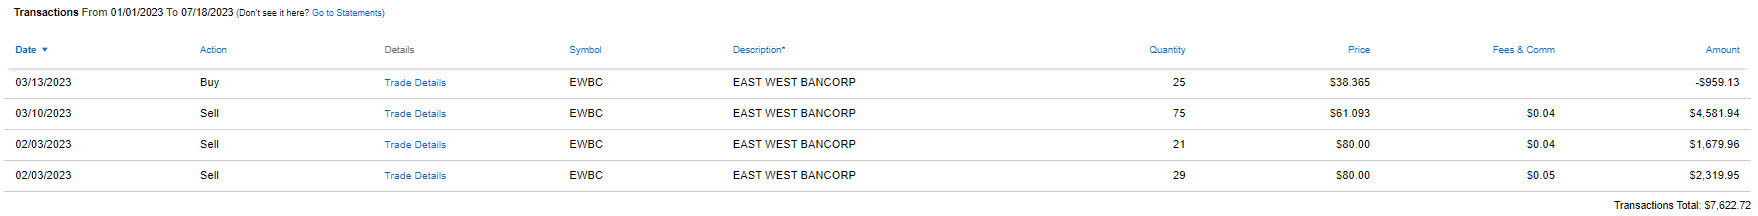
East West Bancorp - In less than a month the stock price is up 16.2% and when compared to the S&P Regional Banking ETF ( KRE ) the price improvement since May 1st has been about 2.5x with the performance deviation starting after mid-June. It should be noted that there have been significant insider purchases (in addition to the stock awarded as part of compensation) in early May. This was about the same time that we purchased additional shares of EWBC after selling off the high-cost shares during the panicked sell-off.
Here is the transaction history related to EWBC during 2023.
EOG Resources - In my recent article for Jane's Retirement Accounts I noted that recent production cutbacks and higher oil demand from developing countries are contributing towards rising oil prices. EOG is likely to benefit from this and I am more bullish on them than I would be with any of the majors such as Exxon ( XOM ), Chevron ( CVX ), etc. We are looking to add more shares on any weakness, specifically if the stock price moves below $110/share. We are willing to play the long game with the expectation that oil demand will remain high even as the major economies deal with reduced demand as a result of economic slowdown.
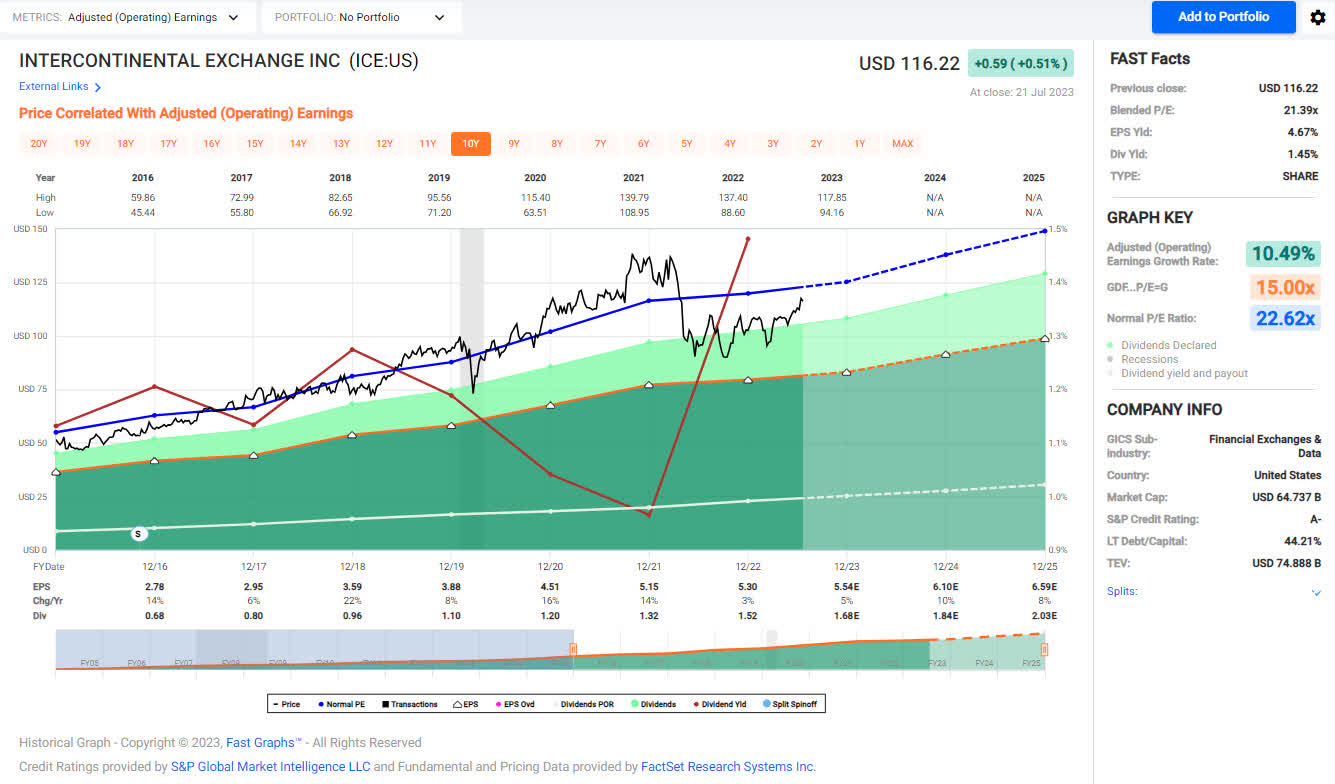
Intercontinental Exchange - ICE has reached 52-week highs and is trending towards pushing record-high share prices. There is a lot of uncertainty around the potential acquisition of Black Knight ( BKI ) although the recent announcement to sell BKI's Optimal Blue business to Constellation Software ( OTCPK:CNSWF ) definitely improves the chance that they will gain regulatory clearance to let the deal go through.
ICE comes with a five-year dividend CAGR of 12.70% and supports future dividend growth of high single-digit/low double-digit dividend increases. Based on its 10-year historical P/E ratio the stock is still currently undervalued although it is very close to fairly valued at $125/share. I believe this number would be modestly higher pending the completion of BKI.
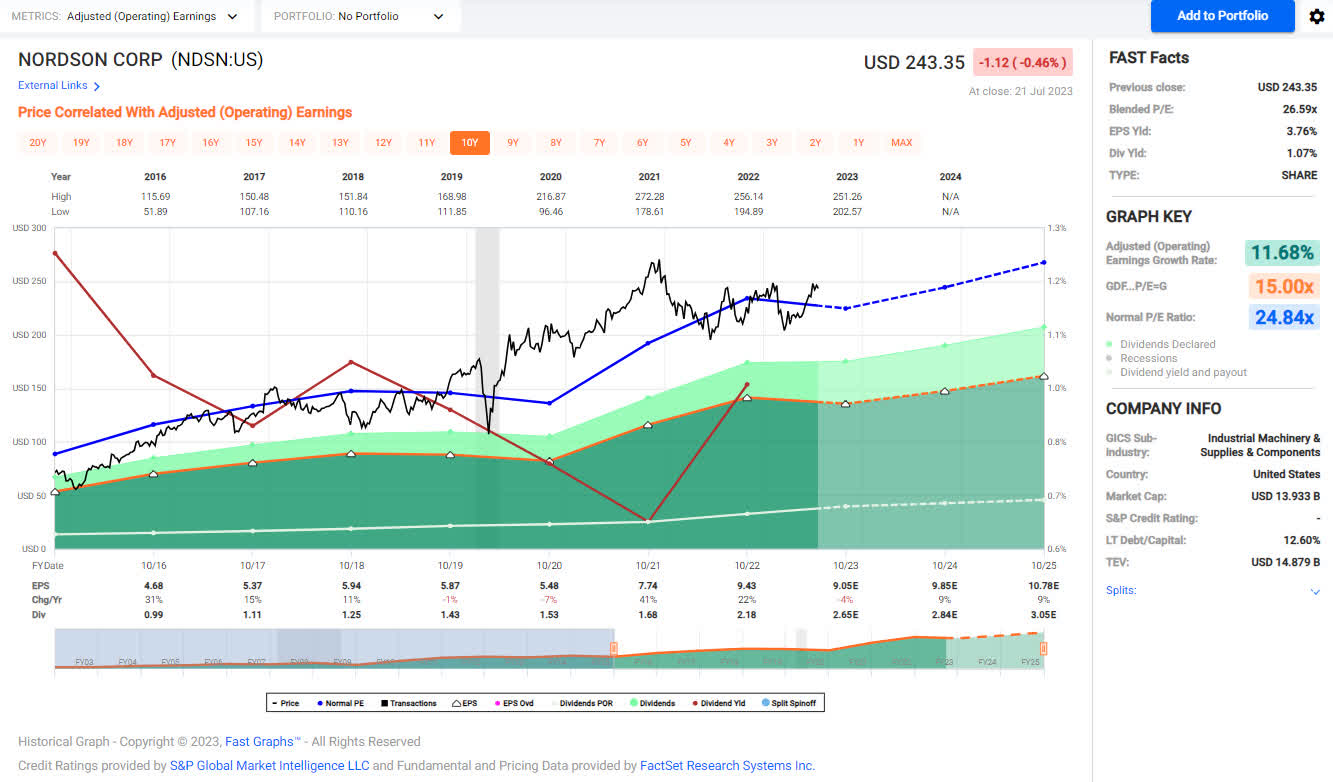
Nordson - This is one of my favorite industrial powerhouses and as you can see I really like picking up shares any time the stock price reaches $210/share. With NDSN the key indicator I have used to determine an entry point is the dividend yield at $210/share which works out to be just under 1.25%. Over the last decade, NDSN hasn't traded at a yield greater than 1.25% except during the initial phase of COVID and a period of weakness in 2016.
What makes this an effective measurement is that NDSN boasts an incredible 10-year Dividend CAGR of 15.8% which means the only way to keep the yield low is by growing share price. The 10-year average P/E ratio for NDSN is 24.8x which is outstanding for a dividend king that has shown no signs of slowing down.
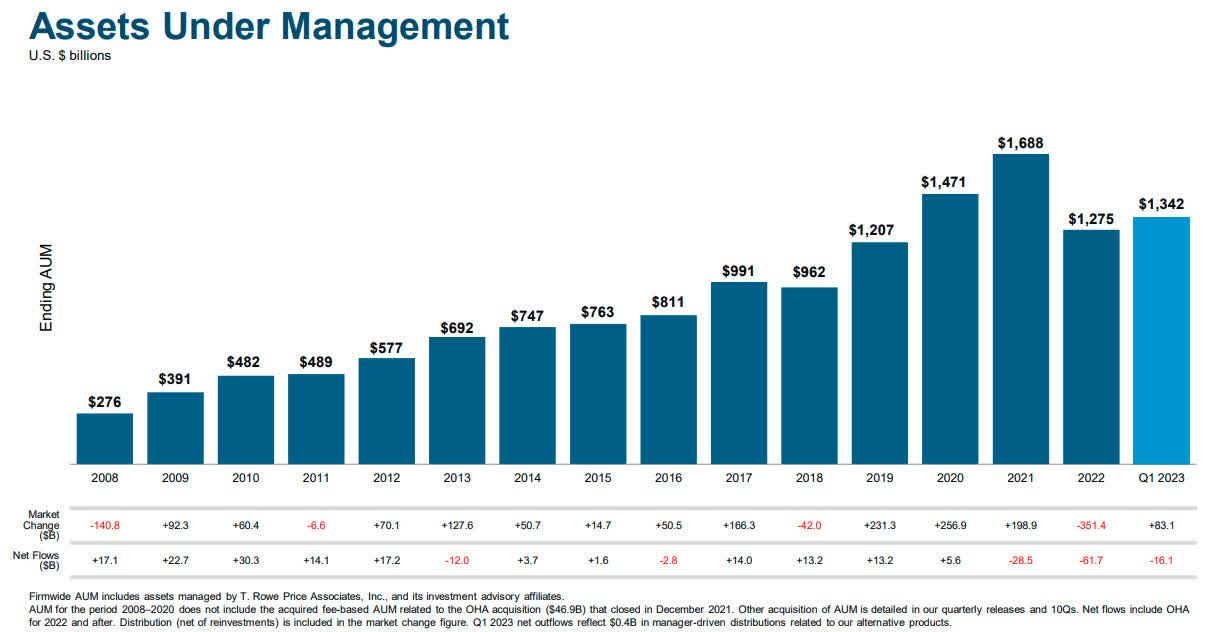
T. Rowe Price - When you compare TROW against the main indexes you can see patterns of similarity and the reason for this is that TROW earnings and performance is heavily dependent on assets under management ((AUM)). TROW's value proposition is very simple, having more AUM allows them to earn more fee income and fund outflows present the greatest risk to the company's earnings.
TROW - Q1-2023 Assets Under Management (TROW - Q1-2023 Earnings Supplement)
This rebound helps explain the substantial improvement in price that took place in July. Investors should also be aware that TROW holds no debt and has always maintained a very friendly stance towards shareholders and has rewarded them with an average dividend growth rate CAGR of 12.89% over the last 10 years.
Watchlist
All tables below are compiled using Seeking Alpha information under the business name Consistent Dividend Investor ('CDI').
The first image represents the short-term and long-term performance of each stock on the list individually. The goal here is that we are looking for companies that are attractively priced relative to historical prices. It is absolutely critical that this only works if you are picking companies that you believe are performing reasonably and are undervalued. Simply put, do not conflate a company's low stock price (relative to historical pricing) with being undervalued because there are a handful of other indicators like the dividend yield, earnings growth, and debt metrics that must be considered.
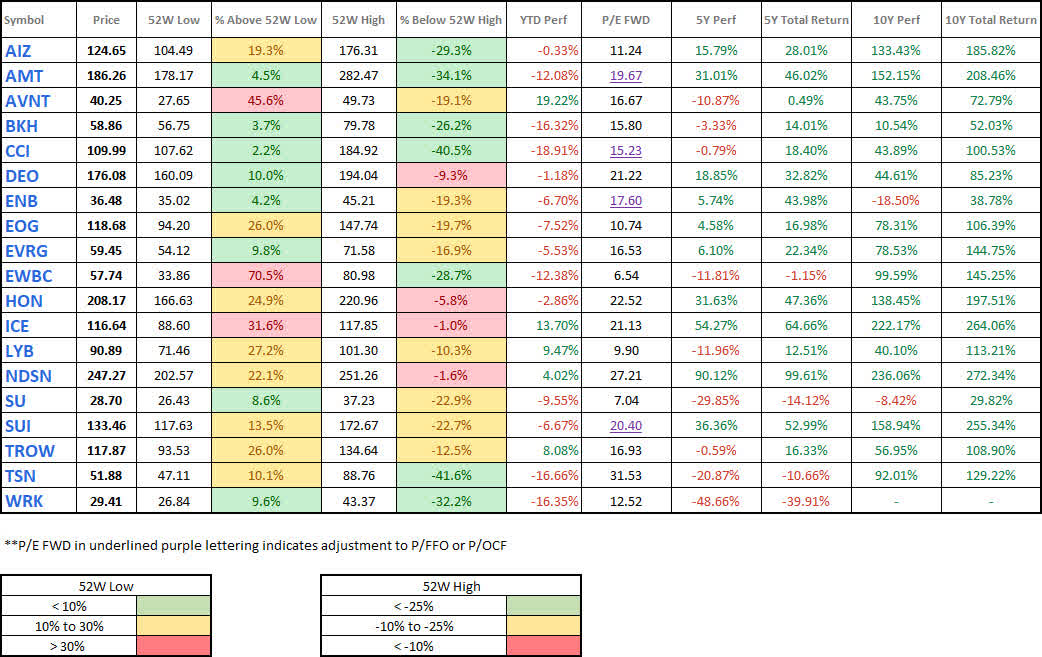
The table below takes a closer look at the dividend yield, growth, and payout ratio to see if the yield is more/less attractive than its historical average and whether or not growth is sustainable.
Watchlist - Dividend - 2023-7-17 (CDI)
The two metrics below represent the debt metrics that I think are worth knowing for each of the companies on the Watchlist. I am still researching additional debt metrics that I would like to monitor. I have always appreciated the Current Ratio and LT Debt To Total Capital.
Current Ratio - This is a liquidity ratio that focuses on a company's ability to pay short-term obligations (typically less than 12 months). A current ratio > 1 is a good starting point (because this means the company has enough funds available to pay all obligations for the next year). Companies that operate in different sectors are likely to have very different current ratios. For example, most of the industrial/manufacturing companies on the list have some of the highest current ratios while companies that are infrastructure (REITs and Pipelines) tend to have a lower current ratio figure.
Long-Term Debt To Total Capital Ratio - This ratio is also industry-specific because there are some industries such as pipelines and REITs that naturally rely more heavily on the use of debt while other companies typically use less leverage. This one will be extremely helpful with the challenging market conditions because the higher the amount of leverage used the more likely it is that a company won't be able to handle its obligations and could go insolvent.
Watchlist - Debt Metrics - 2023-7-17 (CDI)
Lastly, we have our table that compares the current price with the most recent two updates, in this case, we will be directly comparing the stock price performance of the following dates:
- 6/2/2023 to 7/17/2023
- 6/22/2023 to 7/17/2023
Watchlist - Share Price Comparison - 2023-7-17 (CDI)
Conclusion
It makes sense why some of the most notable names on the watchlist have seen substantial improvement over the last month. I mentioned in the previous article that I have a lot of concerns regarding the tech sector and how long the Artificial Intelligence hype can keep the market moving higher. Next week we will see earnings announcements from Microsoft ( MSFT ), Alphabet ( GOOG )( GOOGL ), Meta ( META ) and Intel ( INTC ).
I found the posting on Seeking Alpha named Catalyst Watch which offers a lot of really good stuff when it comes to important events in the upcoming week.
Previous Article
Undervalued Dividend Stocks Watchlist - What Goes Up Must Come Down
John and Jane are currently long on the following positions in the watchlist: American Tower ( AMT ), Avient ( AVNT ), Crown Castle ( CCI ), Enbridge ( ENB ), EOG Resources ( EOG ), East West Bancorp ( EWBC ), Honeywell ( HON ), Helmerich & Payne, Intercontinental Exchange ( ICE ), LyondellBasell ( LYB ), Nordson ( NDSN ), Suncor ( SU ), Sun Communities ( SUI ), T. Rowe Price ( TROW ), WestRock Company ( WRK ).
For further details see:
Undervalued Dividend Stocks Watchlist - Five Dividend Growth Stocks Leading The Way