TROW - Undervalued Dividend Stocks Watchlist - What Goes Up Must Come Down
2023-06-24 09:00:00 ET
Summary
- AI's influence on the Nasdaq has helped it recover, but it still lags behind the DJIA and S&P 500 in terms of performance since the beginning of 2022.
- The market saw significant price improvements through mid-June, but a recent drop has made shares more attractively priced than they were on June 2nd.
- Investors should consider dividend yield, earnings growth, and debt metrics when determining if a company is undervalued and worth investing in.
The Watchlist consists of companies that look interesting for one reason or another. In most cases, I have a modest familiarity with the company including having read recent quarterly earnings releases and reviewed various investor presentations and annual reports.
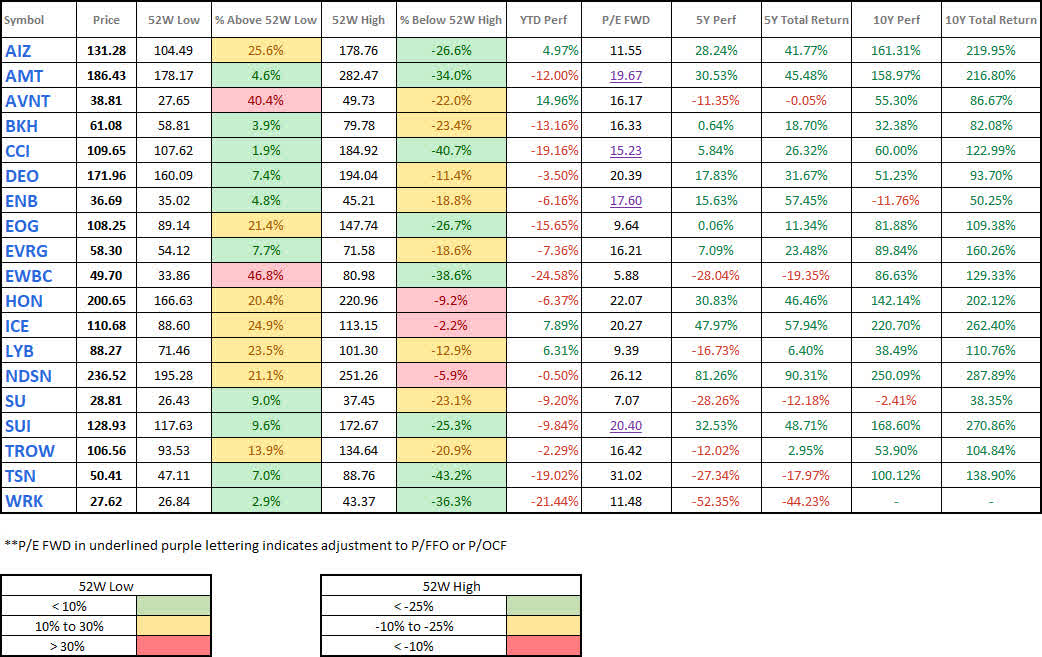
In this update, I found the tables that show the performance of each individual stock price over set periods of time to be the most interesting as we saw sentiments hit a high point on the momentum from AI in the news. The performance of the market has flat-lined recently but the YTD results demonstrate the major recovery experienced by the tech sector.
Now compare this to the performance of the same indexes for FY-2022.
Even though AI appears to be influencing the turnaround for many companies listed on the Nasdaq ( NDAQ ) this is really just getting us closer to a break-even point as compared to where things started on January 1, 2022. With this in mind, the DJIA and S&P 500 have both outperformed the Nasdaq when considering investments held since the beginning of 2022.
How Has The Watchlist Performed?
I found the comparisons over the last month and the last two weeks to be interesting because the image represents the price change over a longer period of time that occurred during a time frame (May 25th - June 22nd) where the market performance at the end of May was poor but saw a rather large benefit in June that resulted in significant gains for a number of companies.
The image below shows what those gains looked like individually for each of the three indexes.
The first image represents a comparable time frame that matches the image above over a one-month period. In the situation below, we can see that most stocks have benefitted modestly over this period of time with only a few stocks seeing even a small decline in share price.
Watchlist - Share Price Comparison - 2023-6-22 VS 2023-5-25 (CDI)
Now, the same shares represented over a shorter period of time (June 2 - June 22) we can see that the price performance (the number of stocks seeing price improvement compared to the number whose prices have worsened) flips to where the majority of stocks are seeing a significant decrease in value while a small handful of others saw stable or improved pricing.
Watchlist - Share Price Comparison - 2023-6-22 VS 2023-6-2 (CDI)
So what does this all mean?
- The market on May 25th was still priced more attractively than the same stocks are priced as of the market close on June 22.
- The market continued to see price improvements through the middle of June.
- Shares are more attractively priced now than they were on June 2nd.
The last point made in #3 is particularly interesting because all three indexes saw significant pricing improvement through the middle of June but as of June 22nd, the price of these shares is now lower than they were on June 2nd. Therefore, even though the indexes saw strong price improvements the drop over the last seven days has been brutal.
This substantial drop over a short period of time makes sense given the recent remarks by Jerome Powell (a good summary of those remarks can be found in the update Nasdaq, S&P end higher, Dow slips by a whisker amid hawkish central bank signals ).
Watchlist
All tables below are compiled using Seeking Alpha information under the business name Consistent Dividend Investor ('CDI').
The first image represents the short-term and long-term performance of each stock on the list individually. The goal here is that we are looking for companies that are attractively priced relative to historical prices. It is absolutely critical that this only works if you are picking companies that you believe are performing reasonably and are undervalued. Simply put, do not conflate a company's low stock price (relative to historical pricing) with being undervalued because there are a handful of other indicators like the dividend yield, earnings growth, and debt metrics that must be considered.
The table below takes a closer look at the dividend yield, growth, and payout ratio to see if the yield is more/less attractive than its historical average and whether or not growth is sustainable.
Watchlist - Dividend - 2023-6-22 (CDI)
The two metrics below represent the debt metrics that I think are worth knowing for each of the companies on the Watchlist. I am still researching additional debt metrics that I would like to monitor. I have always appreciated the Current Ratio and LT Debt To Total Capital.
Current Ratio - This is a liquidity ratio that focuses on a company's ability to pay short-term obligations (typically less than 12 months). A current ratio > 1 is a good starting point (because this means the company has enough funds available to pay all obligations for the next year). Companies that operate in different sectors are likely to have very different current ratios. For example, most of the industrial/manufacturing companies on the list have some of the highest current ratios while companies that are infrastructure (REITs and Pipelines) tend to have a lower current ratio figure.
Long-Term Debt To Total Capital Ratio - This ratio is also industry-specific because there are some industries such as pipelines and REITs that naturally rely more heavily on the use of debt while other companies typically use less leverage. This one will be extremely helpful with the challenging market conditions because the higher the amount of leverage used the more likely it is that a company won't be able to handle its obligations and could go insolvent.
Watchlist - Debt Metrics - 2023-6-22 (CDI)
Conclusion
Due to time constraints and the amount of activity in the accounts for John and Jane, I will be writing the article about trades (including the rationale for buying, selling, and having open trades for others) in a separate article that I plan to publish mid-week.
With the removal of Helmerich & Payne ( HP ), it can be seen that the list is now showing all 10Y Total Returns (last column of the Watchlist - Reasonably Priced) shown above (with the only exception being for WRK which has not existed as an entity for 10 years.
It will be interesting to see how the market processes the recent comments from Jerome Powell because I expect that many of the shares above will become more attractively priced than they currently are. Where I think things will get really interesting is in the Nasdaq for many of the reasons discussed at the beginning of the article regarding the terrible performance of the Nasdaq in 2022. With the tech sector responsible for massive layoffs over the last 12 months there aren't many levers left for them to pull when it comes to protecting their balance sheets, especially if they have loans coming due that will need to be refinanced at much less attractive rates.
For those interested in better understanding the last sentence I think that you would find the article A Credit Event Is Coming That Will Shock The Nouveaux Bulls particularly interesting.
Previous Articles
Undervalued Dividend Stocks Watchlist - Adding LyondellBasell
Undervalued Dividend Stocks Watchlist - May 8th Update
John and Jane are currently long on the following positions in the watchlist: American Tower ( AMT ), Avient ( AVNT ), Crown Castle ( CCI ), Enbridge ( ENB ), EOG Resources ( EOG ), East West Bancorp ( EWBC ), Honeywell ( HON ), Helmerich & Payne, Intercontinental Exchange ( ICE ), LyondellBasell ( LYB ), Nordson ( NDSN ), Suncor ( SU ), Sun Communities ( SUI ), T. Rowe Price ( TROW ), WestRock Company ( WRK ).
For further details see:
Undervalued Dividend Stocks Watchlist - What Goes Up Must Come Down