UMC - United Microelectronics Has Reached A Crossroad
Summary
- UMC has rallied in 2023, continuing the run that started in Q4 2022, but a change in direction could be near.
- A risk-on market rally thanks to the Fed and the outlook for a recovery in H2 has overshadowed the current downturn that has led to weak results.
- The stock has soared higher, but the rally is built on a couple of assumptions that could hurt the stock if they turn out to be misplaced.
- Long UMC has its merits, but there are also good reasons why some may want to be wary of the current rally.
Shareholders of United Microelectronics ( UMC ), one of the leading providers of foundry services to the semiconductor industry, should be pleased with how 2023 has gone thus far. The stock has rallied and outperformed most, in spite of all the headwinds UMC is facing as revealed in the most recent earnings report. However, the stock may have reached a turning point. Why will be covered next.
Why UMC may have found resistance
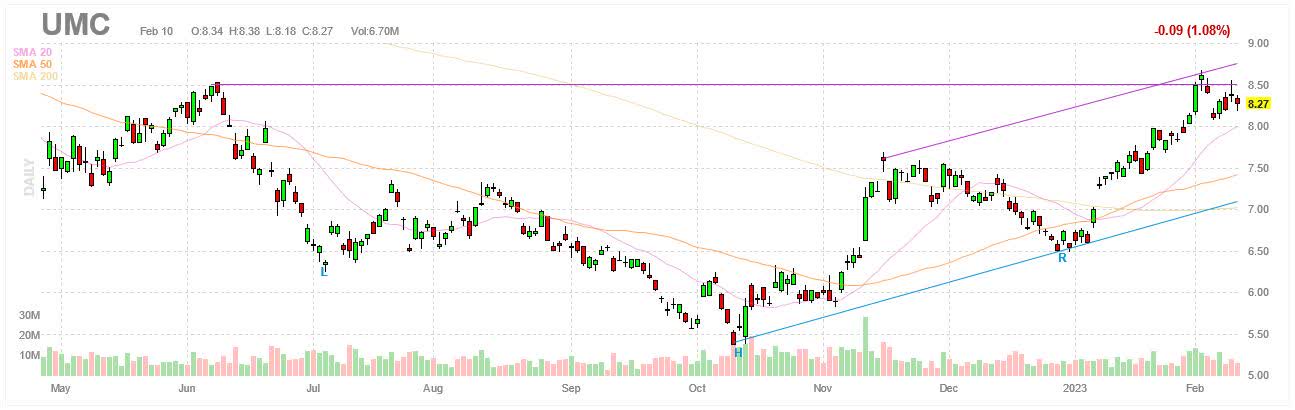
The chart below shows how UMC has continued the rally that started in Q4 of last year. The stock hit bottom on October 11 when it posted a 52-weeks low at $5.36, only to turn it around from that point on. The stock got as high as $8.67 on February 2, which represents a gain of 61.7% in less than four months. For the year, the stock has gained 26.7% YTD. In comparison, the iShares PHLX Semiconductor ETF ( SOXX ) has gained 20% YTD and the SPDR S&P 500 ETF ( SPY ) has gained 6.7% YTD.
UMC has outperformed most semiconductor stocks. In addition, the stock appears to be in an uptrend. Note the higher lows and higher highs in place since the October low, which can be connected to form ascending trendlines that are running parallel to one another. The stock seems to be in an ascending channel, a bullish chart pattern that could encourage additional buyers to step in. The trend is clear and it is pointing up.
However, it’s also worth noting that the stock has stalled in recent weeks after posting the 2023 high on February 2. Granted, the stock was overbought and due for a breather. Nevertheless, the stock seems to be having problems getting through the $8.25-8.75 region, which might not be a coincidence since this happens to be the same region where the stock previously topped out at $8.53 on June 8, 2022. This is just $0.14 away from the 2023 high of $8.67 set on February 2.
The stock seems to have encountered resistance. The stock is also at the upper bound of the channel, which suggests the stock may have to make a trip back to the lower bound of the channel before it can take another stab at new highs for the year. It’s possible the stock continues higher, but the path of least resistance in the near term is for the stock to turn south. Some may want to consider reducing their exposure, especially if they managed to get in on the recent lows and are sitting on substantial gains after the huge rally.
The stock has managed to overcome headwinds
The stock’s outperformance is even more remarkable if one takes into account the circumstances in which the rally took place. The stock has, for instance, looked past the most recent earnings report, which disappointed by missing estimates for the top and the bottom line. The numbers also make it clear the foundry industry is in the midst of a downturn.
Still, UMC ended FY2022 with solid headline numbers. FY2022 revenue increased by 30.8% YoY to NTD278,705M or $9,078M using an exchange rate of 1:30.70 for the U.S. dollar. EPS increased by 55.1% YoY to NTD7.09 or $0.231, which translates to $1.155 per ADS. UMC has room for a dividend as good as the one last year. UMC finished FY2022 with cash and cash equivalents totaling NTD173.82B or $5.66B. All in all, FY2022 was not a bad year for UMC with major gains made.
| (Unit: M NTD except EPS) |
| FY2022 |
| FY2021 |
| YoY |
| Revenue |
| 278,705 |
| 213,011 |
| 30.8% |
| Gross margin |
| 45.1% |
| 33.8% |
| 1130bps |
| Operating margin |
| 37.4% |
| 24.3% |
| 1310bps |
| Operating income |
| 104,292 |
| 51,686 |
| 101.8% |
| Net income |
| 87,198 |
| 55,780 |
| 56.3% |
| EPS |
| 7.09 |
| 4.57 |
| 55.1% |
Source: UMC
However, UMC ended FY2022 on a soft note and there is reason to believe there is more weakness ahead. Q4 revenue still increased by 14.8% YoY, but it also decreased by 10% QoQ to NTD67,836M or $2,210M. Similarly, EPS declined by 29.7% QoQ, even if it increased by 18.5% YoY to NTD1.54 or $0.05, which translates to $0.251 per ADS. Q4 gross and operating margins improved YoY, but they took a step back from the highs reached in the preceding quarter. The tide has turned and the question is when it will come back. The table below shows the numbers for Q4 FY2022.
| (Unit: M NTD except EPS) |
| Q4 FY2022 |
| Q3 FY2022 |
| Q4 FY2021 |
| QoQ |
| YoY |
| Revenue |
| 67,836 |
| 75,392 |
| 59,100 |
| (10.0%) |
| 14.8% |
| Gross margin |
| 42.9% |
| 47.3% |
| 39.1% |
| (440bps) |
| 380bps |
| Operating margin |
| 34.8% |
| 40.0% |
| 29.8% |
| (520bps) |
| 500bps |
| Operating income |
| 23,637 |
| 30,157 |
| 17,616 |
| (21.6%) |
| 34.2% |
| Net income |
| 19,068 |
| 26,996 |
| 15,949 |
| (29.4%) |
| 19.6% |
| EPS |
| 1.54 |
| 2.19 |
| 1.30 |
| (29.7%) |
| 18.5% |
The sequential decline was driven by a 14.8% QoQ decline in wafers shipped to 2,213K 8-inch equivalent, even though UMC increased capacity to 2,543K, which resulted in a 90% utilization rate. The last time UMC did not finish with a 100+% utilization rate was Q4 FY2020 when the rate was 99%, which means a streak of seven quarters was broken. Furthermore, the forecast sees utilization dropping even further to 70% with wafer shipments dropping in the high teens. From the Q4 earnings call:
“Now let's move on to the first quarter 2023 guidance. Our wafer shipment will decline by high teens percentage range. ASP in U.S. will remain flat. Please note that we expect a 3% to 4% adverse impact on foreign exchange on revenue. Gross profit margins will be in the mid 30% range. Capacity utilization rate will be approximately 70%. Our 2023 cash based CapEx will be budgeted at $3 billion.”
A transcript of the Q4 FY2022 earnings call can be found here .
However, UMC managed to offset the weak results by calling for a rebound in the second half of 2023. The trough will be in Q2, if not in Q1.
“For the 2023 outlook. Well, I mean, given the cyclical nature of the semi industry, there is no one that’s immune from the end market downturns. While we were able to mitigate our loading in the second half of our 2022 amidst the downturn, thanks to the growth in our auto business sustain our business momentum and which I also touched and search about 82% year-over-year. But for the first half of 2023, we do foresee a continued softened demand in smartphone PC consumer market that will continue for the inventory digestion reason. Meanwhile, the inventory digestion will continue to be our first priority. Nevertheless, we expect the first half, if not, the Q1 will be the trough.”
This outlook is in line with those of others. For example, TSMC ( TSM ), the leading foundry, has also called for a rebound in demand in H2 2023 with the bottom in H1. Still, UMC expects a decline in the lows teens in FY2023 revenue. Consensus estimates predict UMC will earn $0.71-0.81 on revenue of $7.47-8.43B in FY2023, a YoY decline of 34.8% and 12.2%, respectively, at the midpoint.
Valuations favor UMC
Valuations are another factor that likely helped UMC in the recent rally. UMC compares quite well in terms of multiples against its main competitors in the foundry market, which include TSM and GlobalFoundries ( GFS ). In general, multiples for UMC are significantly lower. On the other hand, multiples have gone up as they used to be much lower not that long ago before the recent rally in the stock.
| UMC |
| GFS |
| TSM |
| Market cap |
| $21.04B |
| $35.21B |
| $468.01B |
| Enterprise value |
| $17.04B |
| $34.38B |
| $445.06B |
| Revenue (“ttm”) |
| $9,066.2M |
| $7,854.1M |
| $73,644.0M |
| EBITDA |
| $4,829.4M |
| $2,583.4M |
| $50,698.8M |
| Trailing GAAP P/E |
| 7.30 |
| 42.48 |
| 14.15 |
| Forward GAAP P/E |
| 11.00 |
| 24.61 |
| 16.89 |
| PEG ratio |
| 0.13 |
| N/A |
| 0.20 |
| P/S |
| 2.28 |
| 4.39 |
| 6.35 |
| P/B |
| 1.91 |
| 3.89 |
| 4.88 |
| EV/sales |
| 1.88 |
| 4.38 |
| 6.04 |
| Trailing EV/EBITDA |
| 3.53 |
| 13.31 |
| 8.78 |
| Forward EV/EBITDA |
| 4.82 |
| 11.00 |
| 8.56 |
Source: SeekingAlpha
Fed policy is the wild card for UMC
An outlook calling for a recovery in demand and multiples has helped. However, the biggest factor that could determine the road ahead for the stock is Fed policy. It’s no coincidence that semis have been back in vogue ever since inflation has come down, raising expectations of a Fed pivot. The market expects a less restrictive policy from the Fed and semis have benefited from buyers positioning themselves accordingly.
But if say inflation turns out to be more persistent than thought, the current rally in stocks could easily get snuffed out by the same Federal Reserve. The market has been looking past the fact that earnings have been weak lately for many semis, UMC included, in anticipation of better times ahead, but these expectations could be misplaced.
The market has come to the idea that it knows what the Fed will do in 2023, but what the Fed actually does may be something else entirely. The Fed has been a tailwind in recent months, but if it becomes the headwind that it was for most of 2022, UMC could easily turn south once more, just as it did not that long ago.
Investor takeaways
It’s tempting to go long UMC with the way the stock has rallied in recent months and the trend in the stock pointing to higher prices, but I would still not be a buyer of UMC. UMC has rallied along with other semis thanks to perceptions of a Fed pivot, in addition to a bottoming in the semiconductor industry in the near term. This has led to the market looking past the weakness in the quarterly numbers.
However, both could take a lot longer to get here. The current downturn in the semiconductor market could last longer than expected. Recent industry forecasts have turned out to be too optimistic and that could be the case once again. Similarly, perceptions of what the Fed will do may not be correct. Rates may have to go even higher to bring inflation truly under control. If both are not there, the market could come to the realization that earnings have been going in the wrong direction for many companies, UMC included.
The charts leave open the possibility of higher prices down the road, but in the short term, the stock is most likely heading lower. The stock seems to be in an uptrend, but that does not mean the stock cannot correct, not with resistance in the way and the stock at the upper range of the channel. Nothing is set in stone, but the odds favor a move back to the lower range of the channel.
Bottom line, while the rally in the last four months or so has been impressive, it’s also built on a shaky foundation. As long as the Fed comes through and the semiconductor market starts to improve in the coming months, the rally has a chance to continue. Those who got in recently will be rewarded and those that stayed on the sidelines will have missed out. But if they don’t, not buying the rally could turn out to be the right move after all.
For further details see:
United Microelectronics Has Reached A Crossroad