UMC - United Microelectronics: My Top Undervalued Semiconductor Stock
2023-07-06 16:29:07 ET
Summary
- UMC is the most undervalued stock in the semiconductor market based on a P/E of 7.21.
- UMC's share price growth at the three-year mark is 188% and higher than any of the top five undervalued stocks based on P/E ratio.
- UMC's monthly sales data is the only mid-quarter metric. Investors need to overlook dismal YoY changes as MoM are positive and more reliable.
- UMC is a leader in the 20nm-28nm node range and doesn't compete against <10nm node foundries such as TSMC.
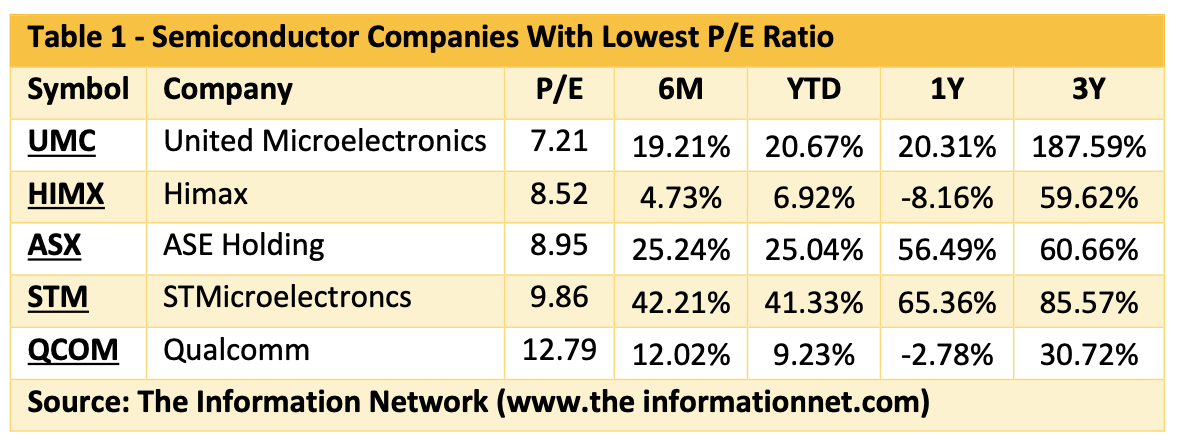
Price per share alone is not a sufficient metric to determine whether a semiconductor stock is undervalued or overvalued. In this analysis analyzed stocks with the lowest P/E ratio as a metric that may suggest the highest undervaluations. The five semiconductor stocks with the lowest P/E ratio are shown in Table 1.
Seeking Alpha
Otherwise, STMicroelectronics ( STM ) has been the share growth leader through the one-year period. I discussed the company in my March 1, 2023, Seeking Alpha article entitled “ STMicroelectronics: Top Pick For Both Silicon And SiC Power Chips .”
ASE provides semiconductor assembly and testing services for more than 90% of electronics companies in the world. The packaging services include fan-out wafer-level packaging (FO-WLP), wafer-level chip-scale packaging (WL-CSP), flip chip, 2.5D and 3D packaging, system in package (SiP) and copper wire bonding , according to our report entitled High-Density Packaging (MCM, MCP, SIP, 3D-TSV): Market Analysis and Technology Trends .
In the remainder of this article I will do a deep-dive analysis on UMC, illustrating that it's indeed an undervalued and in fact underappreciated stock.
United Microelectronics
Revenue Growth
At the 3-year mark, United Microelectronics ( UMC ) is the clear leader in share price change, growing 188% and more than twice the nearest company STM.
UMC (United Microelectronics Corporation) is a global semiconductor foundry headquartered in Taiwan that specializes in the manufacturing and production of ICs for a wide range of applications. As a foundry, UMC provides semiconductor manufacturing services to companies that design and develop their own IC designs but do not have their own fabrication facilities.
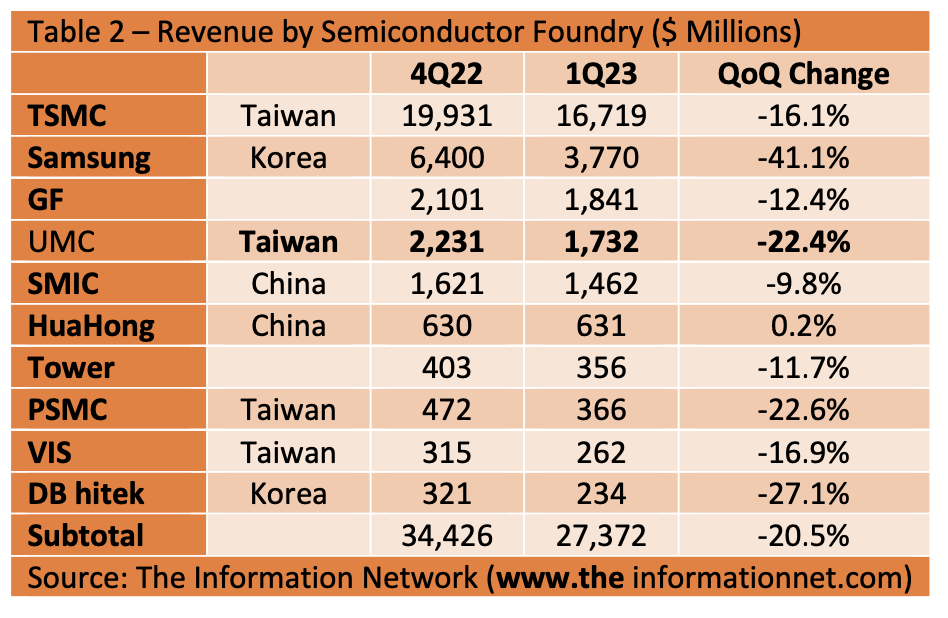
There are several major competitors that UMC faces in the foundry industry, most notably Taiwan Semiconductor Manufacturing Company (TSMC) ( TSM ), as shown in Table 2. Importantly, all (except HuaHong) have negative revenue performance between Q4 2022 and Q1 2023, with the average QoQ change of -20.5%.
The Information Network
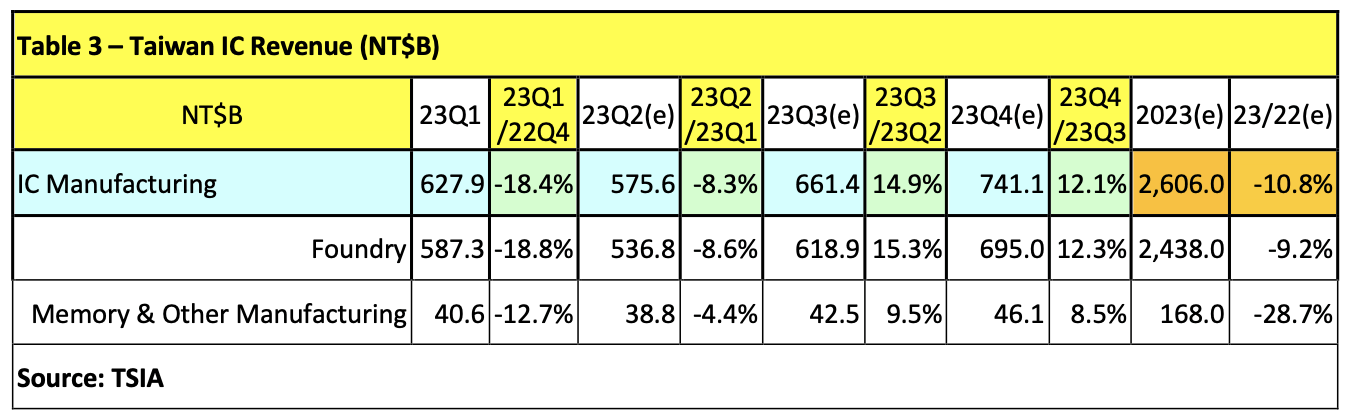
A TSIA survey in Table 3 showed that Q1 2023 Taiwan IC revenue totaled NT$627.9 billion in manufacturing (US$21.1B) (18.4% decrease on-quarter and down 5.8% on-year, with Foundry NT$587.3B (US$19.7B), 18.8% decline on-quarter and down 1.6% on-year, and Memory and other manufacturing products NT$40.6B (US$1.4B), 12.7% drop on-quarter and down 41.8% on-year.
Thus, the Q1 2023 revenue of 22.4% drop by UMC (Table 2) is consistent the overall drop by Taiwan companies in Table 3.
TSIA
Process Technologies
UMC supports various process technologies, ranging from advanced nodes, such as 28nm, 22nm, 14nm, and 12nm, to mature nodes, including 0.35?m, 0.25?m, 0.18?m, 0.13?m, and 0.11?m. This allows UMC to serve a broad customer base with different design and production needs.
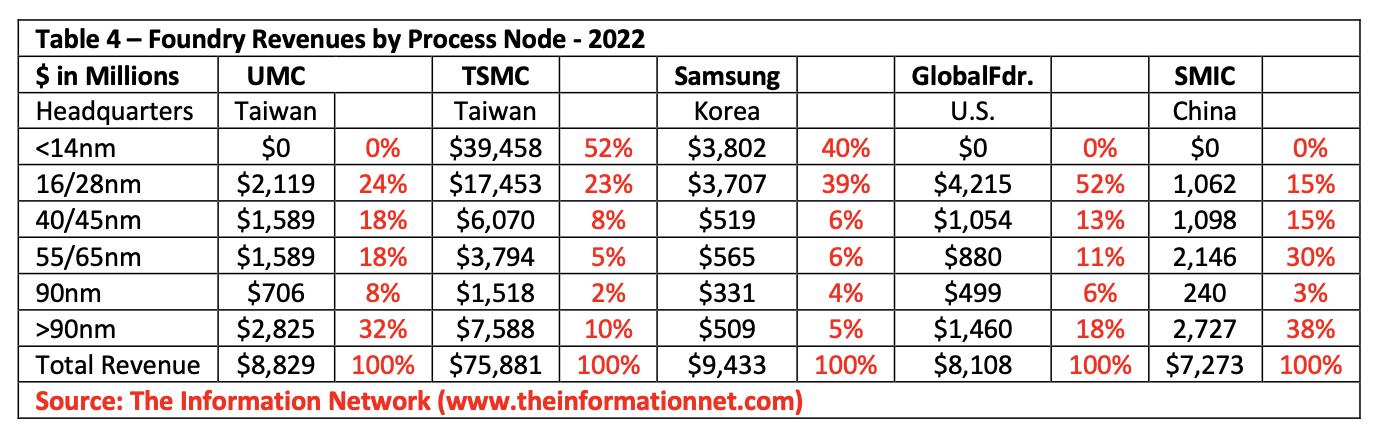
Table 4 shows revenue of UMC and competing foundries by process node. Importantly, UMC makes no chips at the 14nm node and below, unlike TSMC and Samsung ( OTCPK:SSNLF ). While this is a negative for UMC because smaller nodes command higher chip prices, which I presented in my June 15, 2023 Seeking Alpha article entitled “ Taiwan Semiconductor's Weak 2023 Outlook Is Essentially A Near-Term Macro Phenomenon .”
For UMC, 24% of its revenues were generated from chips made at the 16/28nm node, which we see as strong competition by TSMC, Samsung ((SSNLF)), and GlobalFoundries ( GFS ).
The Information Network
Investor Takeaway
Competitive Analysis with TSMC
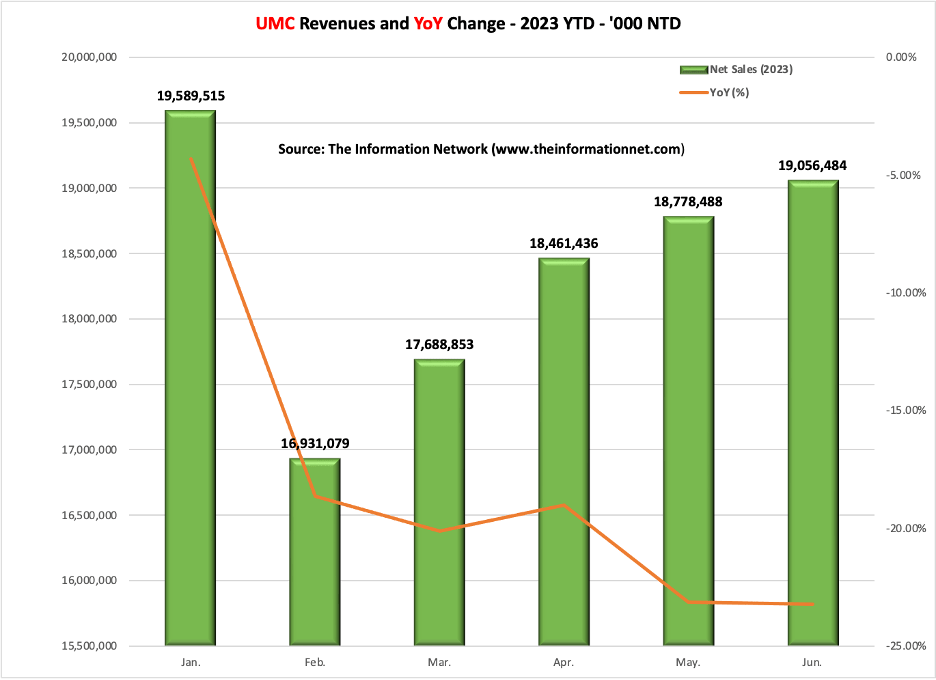
UMC reported on July 6, 2023, that June sales down 23.24% Y/Y to ~NT$19.06B. In May sales dropped ~23.14%. Overall, six month sales from Jan to June have declined 18.4%.
This drop in sales is:
- Consistent with data I presented in Tables 2 and 3 above
- Consistent with data from the Semiconductor Industry Association reporting that worldwide chip sales down 21.6% YoY and projects annual downturn of 10.3% in 2023
In Chart 1, I show UMC’s monthly revenues for 2023. Importantly, it shows that monthly revenues (green bars) are increasing while YoY revenues are decreasing (orange line).
Readers must recognize that two years ago, in my June 25, 2021, Seeking Alpha article entitled “ Applied Materials: Tracking A Likely Semiconductor Equipment Meltdown In 2023 ,” I forecast a meltdown in semiconductor equipment in 2023 along with an oversupply of semiconductors. We're now seeing this drop, and therefore it's no surprise that revenues are down YoY from a strong 2022 with global semiconductor revenues of $574 billion.
Chart 1
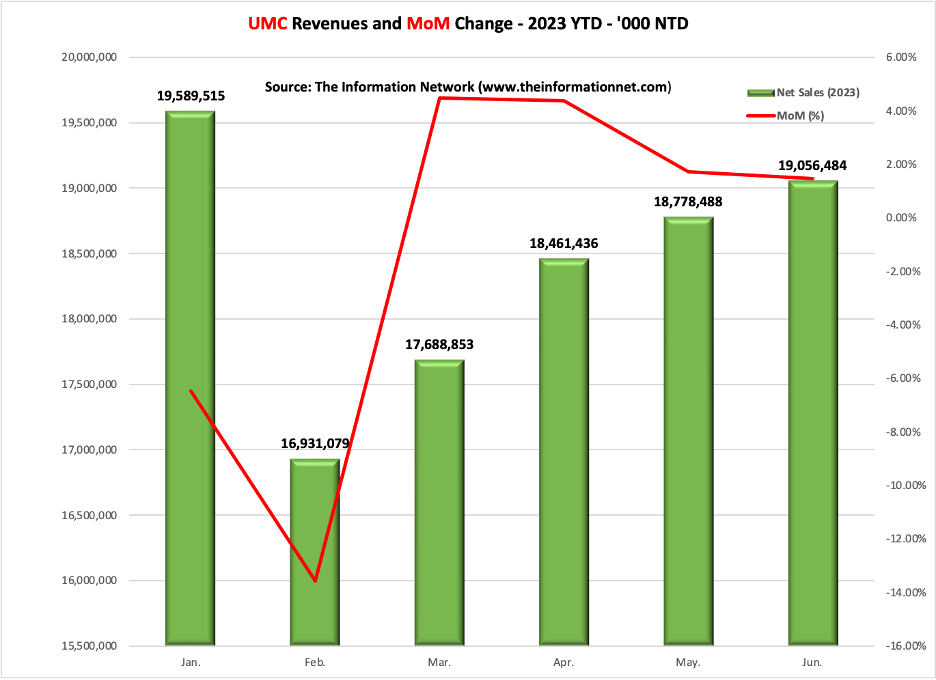
In Chart 2, I show MoM sales revenue growth (red line) for UMC for 2023. These figures indicate that revenue growth for UMC is showing resilience in meeting customer demand.
Chart 2
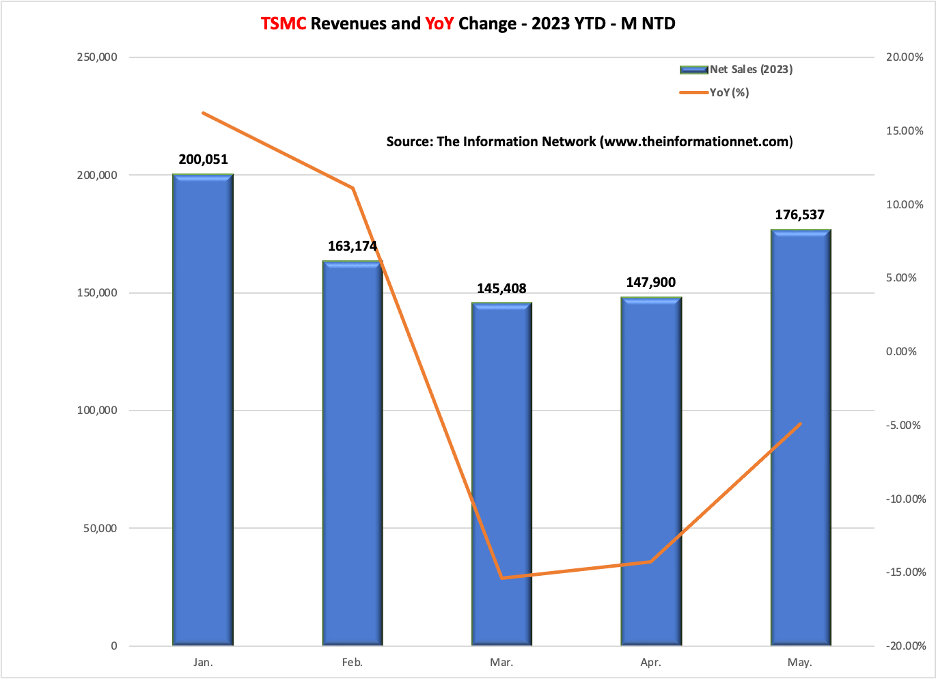
To further evaluate the performance of UMC, I show similar data for TSMC, which I presented in Table 2 above in which TSMC’s Q1 2023 revenue growth was -16.1% QoQ, and in the ballpark with UMC’s -22.4% change.
Chart 3 shows 2023 monthly revenue for TSMC (blue bar) and YoY change (orange line) through May 2023. As with UMC, YoY revenue growth is strongly negative, although the May revenues ticked up.
Chart 3
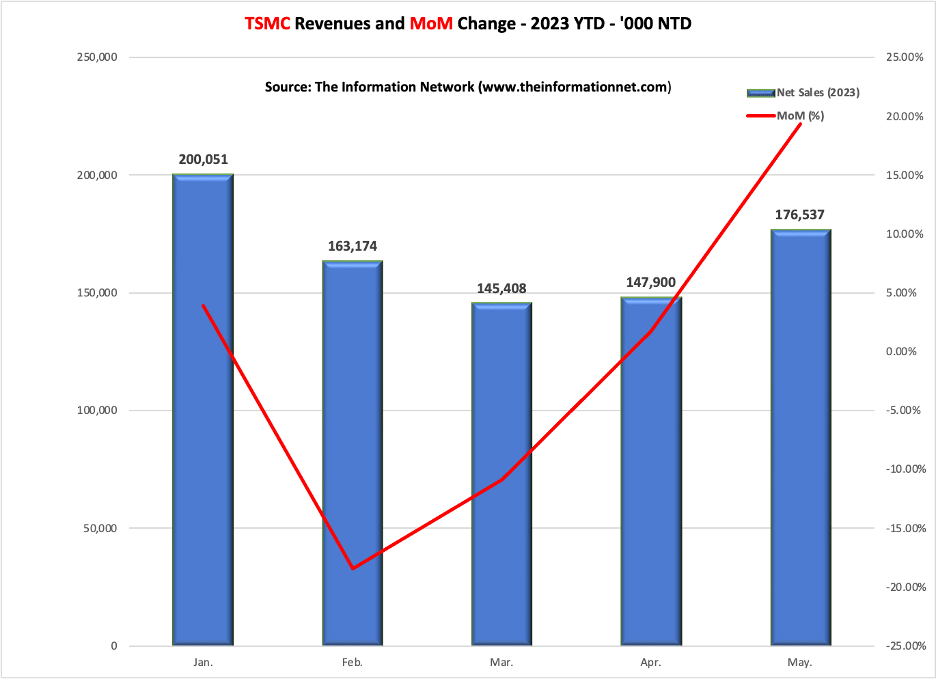
Chart 4 shows MoM sales revenue growth (red line) for TSMC for 2023. These figures indicate that revenue growth for TSMC is showing better growth. In May 2023, TSMC grew 19% following a lackluster 2% growth in April. This compares to USMC, who’s MoM revenues grew 2% in May following 4% in April.
While both UMC and TSMC are foundries in Taiwan, TSMC has focused on expensive, small node chips while UMC’s sweet spot is in the mid-node segment of the industry between 16-65nm.
According t o our report entitled Global Semiconductor Equipment: Markets, Market Shares and Market Forecasts , p rices of wafers range between:
- $9,000 for 7nm and $18,000 for 3nm wafers.
- $5,000 for 65nm and $8,000 for 16nm wafers.
Chart 4
Financial Metrics
In this analysis, I used PE ratio as a metric that may suggest the highest undervaluations, choosing the lowest PE ratios among semiconductor stocks.
Of these five companies, based on PE ratio and share price performance I analyzed UMC, as my Top Undervalued semiconductor stock.
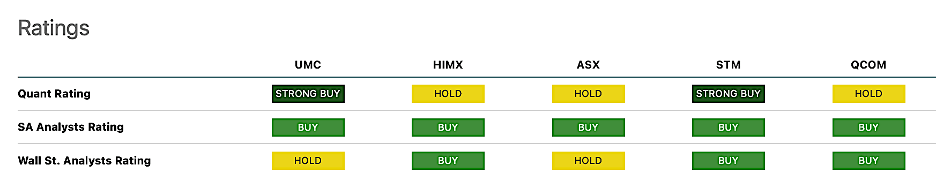
Chart 5 compares ratings of these five companies, with STM the highest performing. I noted the stock performance of STM in this article as well as already analyzing the company in my March 1, 2023, Seeking Alpha article entitled “ STMicroelectronics: Top Pick For Both Silicon And SiC Power Chips ,” and I reiterate my position on STM. Hence, this article addresses UMC, which has a Strong Buy Quant Rating.
Seeking Alpha
Chart 5
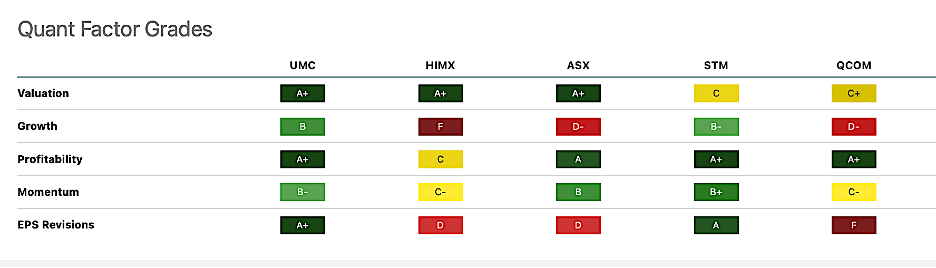
Chart 6 shows the Quant Factor Grades for the five companies, with A+ grades for UMC for Valuation and Profitability - the highest performing company in these Factor Grades.
Seeking Alpha
Chart 6
Until we see a broad-based recovery in the macro environment, we won’t see a broad-based recovery in the stock market.
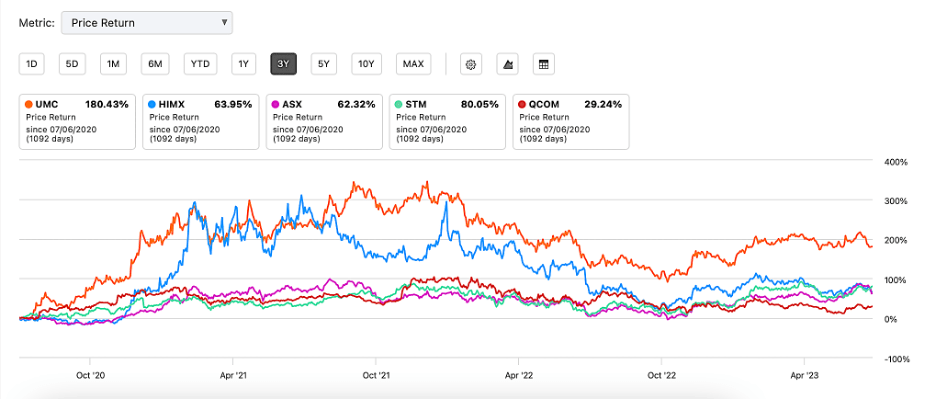
Chart 7 shows the performance of the five stocks for a three-year period. UMC is clearly the top performing stock.
Seeking Alpha
Chart 7
UMC is in a short-term oversold condition, but the stock is above its 200-day moving average which is pointed up indicating that the intermediate term trend is bullish, as shown in Chart 8.
YCharts
Chart 8
Chart 9 compares one-year share performance of UMC with TSMC. Performance between the two companies was comparable until mid-June 2023, when selling pressure accelerated for UMC. With only monthly sales as a financial metric, investors were reacting to the YoY drop in monthly sales. This is a mistake. Coupled with the business model of UMC and Quant Factors shown above, UMC is clearly in an oversold situation.
YCharts
Chart 9
As I showed above in Table 1, UMC’s Price-To-Earnings ratio (7.2x) is below the Taiwan market (18.8x) and half that of TSMC’s 15.3x.
For investors looking at alternatives to stocks with valuations in the stratosphere Nvidia ( NVDA ) or AMD ( AMD ), or the FAANG stocks generating nearly all the stock market growth in 2023, UMC is a refreshing change. While P/E ratio is just one of a few metrics to evaluate undervaluations, it serves its mission of pointing to high long-term growth and high Quant Factor Grades.
For further details see:
United Microelectronics: My Top Undervalued Semiconductor Stock