UMC - United Microelectronics: Q4 Expectations And Market Outlook
Summary
- UMC’s 4Q 2022 financial results will not be as strong as in 3Q 2022.
- I estimate its 4Q 2022 gross profit and net income to be 13% and 19% lower than in 3Q 2022.
- The PHLX Semiconductor Index has been increasing in the past few days.
- The company’s leverage ratios, capital structure, and cash structure indicate that UMC is financially healthy and can remain profitable.
United Microelectronics Corporation ( UMC ) will announce its fourth-quarter financial and operating results on 16 January 2022. I estimate UMC’s 4Q 2022 gross profit and net income to be NT$31 and NT$22, respectively, lower than the company’s gross profit and net income in the third quarter. However, the long-term semiconductor market outlook is strong and according to UMC’s leverages ratios, capital structure, and cash structure. The company is financially well-governed and can remain profitable with the current market condition. The stock is a hold.
3Q 2022 results
In its 3Q 2022 financial results, UMC reported operating revenues of NT$75382 million, compared with 2Q 2022 operating revenues of NT$72055 million. The company’s gross profit increased by 73.6% YoY and 6.5% QoQ to NT$35664 million in 3Q 2022. Also, UMC’s operating income increased by 99.3% YoY and 7.1% QoQ to NT$30157 million in the third quarter of 2023. United Microelectronics reported a 3Q 2022 net income (attributable to shareholders of the parent) of NT$26996 million, compared with NT$21327 million in 2Q 2022 and NT$17460 million in 3Q 2021. UMC cash and cash equivalents increased from NT$113.11 billion in 3Q 2021 to NT$183.72 billion in 2Q 2022 and decreased to NT$180.65 billion in 3Q 2022.
“In the third quarter, our results benefited from product mix optimization and a more favorable exchange rate, while fab capacity remained fully utilized,” the CEO commented. “With our comprehensive technology offering, focus on manufacturing excellence, and resilient financial structure, UMC will further increase our exposure to strong growth markets and consolidate our specialty technology leadership,” he continued.
Estimation of 4Q 2022 and 1Q 2023 results
As UMC predicted to face headwinds amid demand weakness (due to the inflationary environment and Ukraine war), the company revised its 2022 capital expenditure down to US$3 billion. According to the company’s monthly sales revenue, UMC’s net sales decreased from NT$75.4 billion in 2Q 2022 to NT$67.8 billion in 3Q 2022. I estimate UMC’s gross profit to decrease by 13% QoQ to NT$31 billion in 4Q 2022. Also, I estimate UMC’s net income to be NT$22 billion in 4Q 2022, down 19% QoQ.
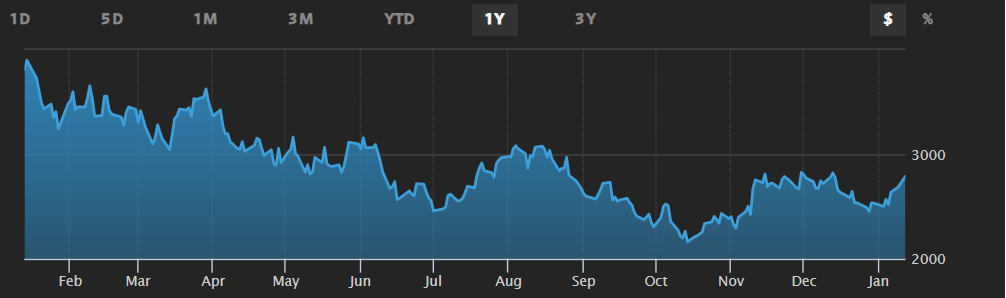
According to Figure 1, UMC’s blended average selling price increased from 3Q 2021 to 3Q 2022. However, due to lower global demand in the past few months, I expect UMC’s average selling price in the fourth quarter of 2022 to be lower than in 3Q 2022. Figure 2 shows the PHLX Semiconductor Index from January 2022 to January 2023. It indicates that since the beginning of the year 2023, the PHLP Semiconducting Index has been increasing. Asia-Pacific has the highest market share in the semiconductor market. Also, according to the company’s revenue breakdown by region, UMC’s revenue from Asia-Pacific is more than 60% of its total revenue. Thus, China’s reopening can have a positive effect on the semiconductor market and UMC’s revenues. However, the global recession is still continuing and I don’t expect semiconductor prices to increase significantly in the short term. I estimate UMC’s 1Q 2023 financial results to be stronger than in 4Q 2022; however not as strong as in 3Q 2022. It is worth noting that in the long run, the semiconductor market outlook is attractive. The semiconductor wafers market is projected to rise at a CAGR of 5.7% to reach a valuation of US$34 billion by 2030.
Figure 1 – UMC’s blended ASP trend
3Q 2022 financial results
Figure 2 – PHLX Semiconductor Index
UMC performance outlook
In the following section, I provided some leverage and return ratios to illustrate the credit ratings of United Microelectronics Corporation. One key way for investors to keep an eye on each company’s performance outlook is by considering their debt levels. High debt levels may lead to a lower ability to purchase new equipment or meet other obligations. Thus, I catered some specific leverage ratios to assess the financial health of an energy company.
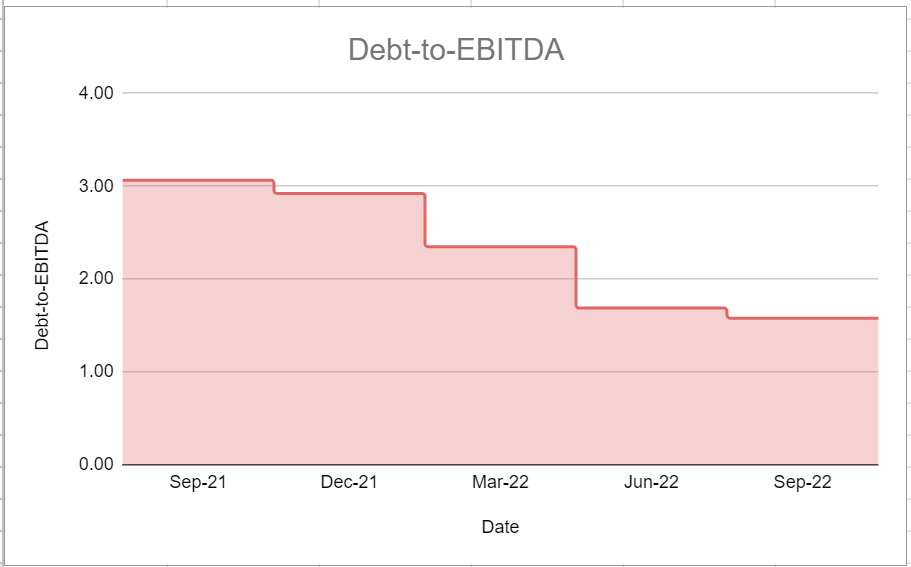
Figure 3 shows the debt-to-EBITDA ratio of UMC during the recent quarters. This ratio determines the probability of defaulting on issued debt. Thus, it could be of help to determine how many years of EBITDA would be necessary for United Microelectronics to be able to pay back its debt. It is observable that the company’s debt-to-EBITDA has been on a decreasing path during previous quarters. For instance, UMC's debt-to-EBITDA in the third quarter of 2022 was about 1.5x, which is half year-over-year compared with its level of 3.06x at the end of September 2021. Overall, in 2022, the company’s debt-to-EBITDA ratios were far lower than their amounts in 2021.
Figure 3 – UMC’s debt-to-EBITDA ratio
Moreover, Figure 4 is a picture of the company’s debt-equity or risk ratio. The debt-to-equity ratio is a leverage ratio that measures the weight of total debt and financial liabilities compared with total shareholders’ equity. Generally, this ratio determines whether a company’s capital structure is toward debt or equity financing. Figure 2 indicates that during recent quarters UMC had the lowest amount of debt-to-equity ratio in the third quarter of 2022. Its amount sat at 0.2x at the end of September 2022 year-over-year compared with 0.31x in the third quarter of 2021. Moreover, the company’s level of risk ratio decreased by 13% from 0.23x in the second quarter of 2022.
Figure 4 – UMC’s debt-to-equity ratio
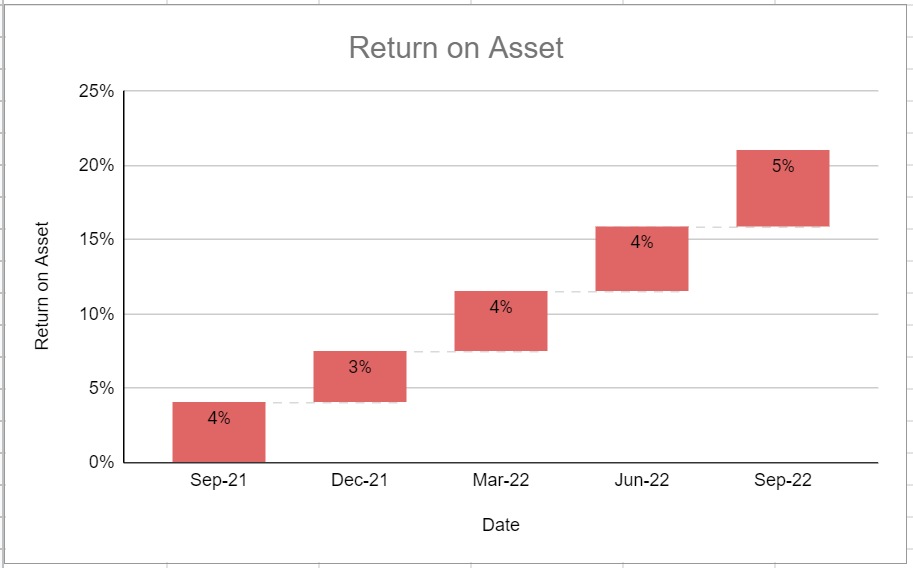
Apart from its leverage ratios, I investigated the company’s return on assets to represent the ability of United Microelectronics Corporation to cater returns to its shareholders. The return on assets ratio reflects how much profit a company is able to generate for every dollar of its assets. ROA of UMC increased in almost every quarter of 2022 and sat at 5% at the end of the third quarter, which is slightly higher year-over-year versus its level of 4% at the end of the same quarter of 2021 (see Figure 5).
Figure 5 – UMC’s ROA ratio
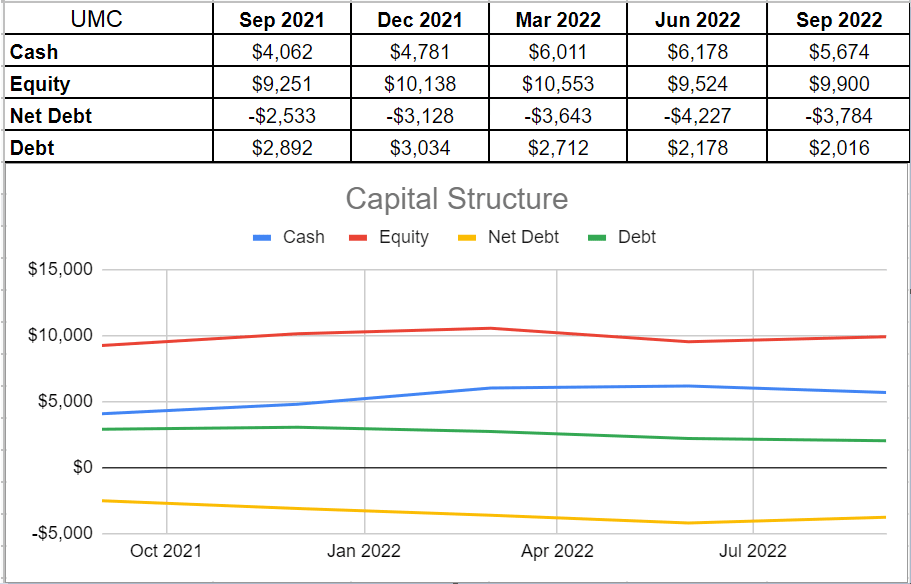
According to Figure 6, the company’s cash and equivalents increased from US$4871 million in 4Q 2021 to US$6178 million in 2Q 2022, and then, decreased to US$5674 in 3Q 2022. I expect the company’s cash and cash equivalents in 4Q 2022 to be lower than in 3Q 2022. Also, UMC’s debt decreased continuously in the past three quarters. However, in 3Q 2022, the positive effect of UMC’s lower debt on its net debt was entirely offset by the negative effect of lower cash and equivalents. The company’s net debt and total equity are well enough to tailor a scope of capacity to bring benefits for its shareholders and assimilate upcoming risks.
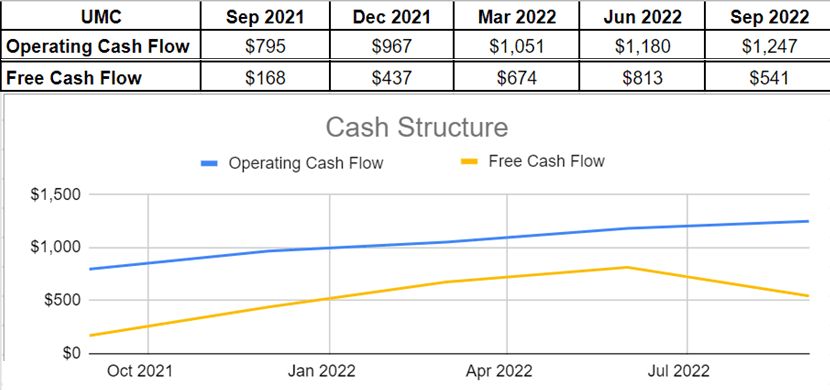
Furthermore, according to Figure 7, UMC’s operating cash flow increased significantly in the first nine months of 2022. However, despite an increasing free cash flow in the first six months of 2022, due to the acquisition of PP&E and cash distributed from additional paid-in capital, the company’s free cash flow decreased from US$813 million at the end of 2Q 2022 to US$541 million at the end of 3Q 2022.
Figure 6 – UMC’s capital structure (in millions of USD)
Figure 7 – UMC’s cash structure (in millions of USD)
Summary
I expect the company’s 4Q 2022 financial results to be weaker than in 3Q 2022. Furthermore, due to the continuing global recession, I don’t expect UMC’s financial results in the first quarter of 2023 to be stronger than in 3Q 2022. However, in the long term, the semiconductor market outlook is strong. Also, UMC’s leverage ratios, capital structure, and cash structure indicate that the company is financially healthy. With the current market condition, the stock is a hold.
For further details see:
United Microelectronics: Q4 Expectations And Market Outlook