U - Unity Software Is A Buy (Technical Analysis)
2023-07-03 01:10:27 ET
Summary
- I believe Unity Software is a good buy due to its bullish price action, large volume bars indicating institutional buying, and positive momentum as shown by the Price Percentage Oscillator.
- The stock has been making a series of higher highs and higher lows and is trading above its upward-sloping 30-week Exponential Moving Average [EMA], which I view as a bullish sign.
- I also note that U stock is showing signs of relative strength against the S&P 500 index, and advises investors to set a stop loss if U closes below its 30-week EMA.
In this article I will outline why I think Unity Software, Inc. ( U ) is a buy. My investment thesis is built around price action, volume, momentum, and relative strength. Let's begin by examining the price action of U.
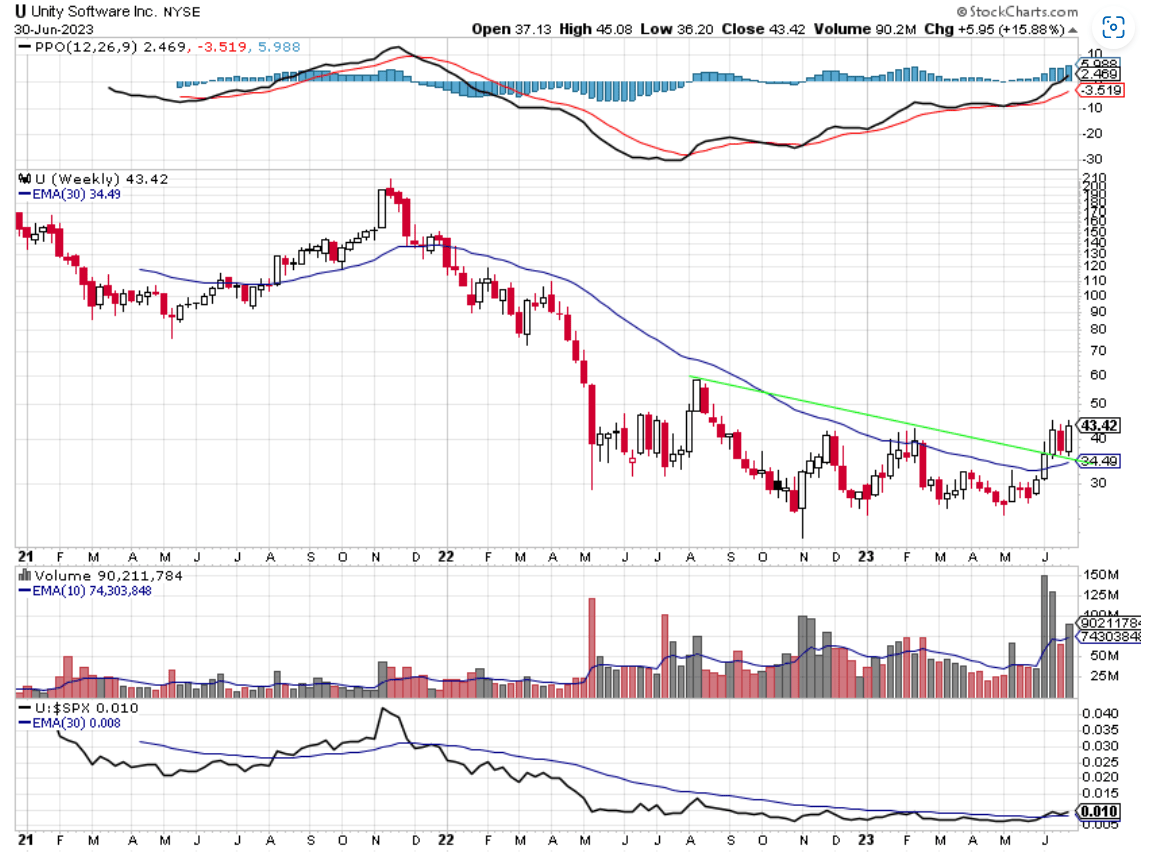
Chart 1 - U weekly with 30 week moving average, momentum, volume, and relative strength
Let's look at price action using the second pane of Chart 1 above. Whenever I look at a stock, I like to start with price action on a weekly basis. Chart 1 shows U on a weekly chart for the past 2.5 years. U made its all-time high in early November 2021 at $210. U then sold off and closed below its 30-week exponential moving average [EMA] shown in blue, in January 2022. I prefer to own stocks that are above a rising 30-week EMA, so this close below the 30-week EMA was a clue that U might be changing from a bullish condition to a bearish condition. That was confirmed in the subsequent weeks. U never regained its 30-week EMA in 2022. Two things showed investors that they should have stayed away from U. The first was that U made a series of lower lows and lower highs. U traded down to the low $70s in March 2022, then rallied back to $110 in April 2022. This was a lower high compared to previous highs. U then declined to $29 in May 2022. This was a lower low compared to the low in March. U then rallied back to almost $60 in August. This was a lower high compared to April. U made its ultimate low in November at $21.22. This series of lower lows and lower highs is the textbook definition of a downtrend. The second indication that U was set for a potential decline was when the 30-week EMA rolled over in the Spring of 2022. A downward sloping 30-week EMA is a bearish condition. Price being below a downward sloping 30-week EMA is a definite sign to not be long the underlying security. Following that simple rule would have saved investors plenty of money. From its high in November 2021 to its low in November 2022 U lost 90%. U lost 80% from its close below the 30-week EMA in January 2022 to its low in November 2022. Keeping track of the stock compared to its 30-week EMA is a big part of my investment strategy.
Now U looks to be trending higher. From its low in November 2022 at $21.22, U has put in a series of higher highs and higher lows. U rallied to $42.24 in late November 2022. From there it declined yet followers of price action would have noticed a significant change. U fell to $24.69 in January 2023 and then rallied from there up to $42.24. In other words, U made a higher low by not falling below the low made in November of $21.22. U then rallied to $42.99 in February. This was a higher high than the rally made in late November to $42.24. It also went above the 30-week EMA which it hadn't done in over a year. A sign of good things to come. U then fell back to $24.66 in May, undercutting the previous low. U then rallied back to a new high in June at $45.07. A series of higher lows and higher highs are the textbook definition of an uptrend. Another bullish price action signal is that U is now above its 30-week EMA. It has four consecutive closes above a now upward sloping 30-week EMA. This hasn't happened since late 2021. I read the current price action for U as very bullish.
Since the low in November, most of the large volume bars seen in the third pane of Chart 1 are on bullish weeks. These are weeks when the stock advanced. Large volume bars on weeks that U advances in price are associated with institutional or smart money buying the stock. Institutional buying often occurs over multiple weeks as institutions load up on the stock before it begins its major advance. You can't miss the huge volume bars that have occurred over the past four weeks. Those huge volume bars are not the sign of retail traders getting positions in U. That is institutional buying. When I analyze the volume for U I also see this as bullish.
I like to own stocks with bullish momentum. I use the Price Percentage Oscillator [PPO] shown in the first pane of Chart 1 as my momentum indicator of choice. PPO uses multiple moving averages and some math to generate the two lines you see in Chart 1. PPO is easy to understand and shows bullish and bearish momentum in two ways. The first indication you want to see for bullish momentum is the black line above the red line. That is a sign of bullish momentum. Bearish momentum is the opposite; the red line is above the black line. You'll notice that the major price decline from November 2021 coincided with bearish momentum. The red line crossed below the black and stayed that way for nine months. Now things are different. The black is above the red line showing bullish momentum. Another bullish sign of momentum is that the black line is also above the zero or centerline of the chart. When the black line is below the zero or centerline that is a sign of bearish momentum. Momentum is bullish for U as the black line is above the red line and the black line is above the zero or centerline.
The last piece of my investment thesis for U is relative strength. I prefer to own stocks that are outperforming the SP 500 index. Relative strength can be measured using a ratio of the underlying security to the SP 500 index. This is shown in the fourth pane of Chart 1. When the black line is rising that means that U is outperforming the index. When the black line is falling that means that U is underperforming the index. U underperformed the SP 500 in 2022 when U was falling 80%. That is easy to see on the Chart. Now things are a bit different. The ratio has flattened out over several months and is now starting to turn upward. The ratio is also above its 30-week EMA shown in blue in the fourth pane of Chart 1. It is not a strong obvious signal, but it appears that U is showing relative strength. I would like to see it continue.
In summary, I think that now is a good time to buy shares in U. Its price action is bullish. It is making a series of higher highs and higher lows. U is trading above its upward sloping 30-week EMA. U is being bought by institutions or smart money. Momentum is bullish as the black line is above the red line and the black line is above the zero or centerline of the Chart. Relative strength shows signs of being bullish. All this leads me to believe that U will continue to move higher from here. Keep in mind that I could be mistaken in my analysis of U. It's smart to have a stop loss. If U closes below its 30-week EMA I would consider selling my position or at least trimming my position.
For further details see:
Unity Software Is A Buy (Technical Analysis)