TFC - Updated Q2 List Of Banks And Their Massive Paper Losses On Their Debt Securities Holdings
2023-08-07 00:55:39 ET
Summary
- Most of the banks on this list had even larger total unrealized losses at the end of 2Q compared to 1Q.
- With interest rates moving higher, the unrealized losses may continue to increase in 3Q.
- The BTFP lending program to distressed banks has reduced most of the March bank panic.
- This unrealized loss issue is not going away anytime soon.
Stock prices of many banks have increased over the last few months but their large unrealized losses have, in general, not improved and many have even larger unrealized losses as of the end of 2Q. Investors and the general public seem to have moved on from the March panic over massive unrealized losses at certain banks. With long-term interest rates continuing to move higher it is unlikely that these losses will improve in the current quarter. This is an update to my original March 12 article and my 1Q update article of unrealized security losses for a list of major U.S. banks.
Interest Rates Continue to Increase
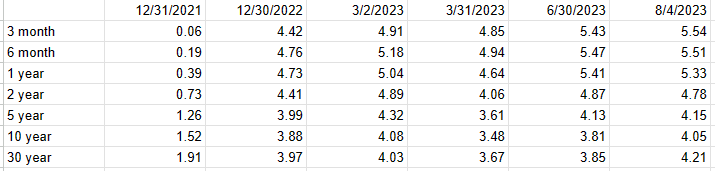
Interest rates continued to move higher in 2Q, which had a negative impact on debt security prices, and are much higher than in early 2021 when the Federal Reserve started to tighten credit. The latest rates on Friday August 4 were mostly higher than on June 30 so the massive unrealized losses continue to grow.
U.S. Treasury Yields
To illustrate how higher interest rates impact debt security prices, the price of a 30-year bond (1.25% 5/15/50) went from approximately par (100) when they were auctioned in May 2020 to the latest price of 52.02 on Friday. That is a huge drop in price in just over three years. The 10-year note (0.625% 5/15/2030) that was auctioned around the same time in May 2020 went from approximately par to 79.18. These are extreme examples but serve to show how some banks who bought securities a few years ago now have massive unrealized losses.
To get down to a 2% inflation rate the FED most likely will have to raise rates even higher and remain higher for an extended period of time because getting from 3.5% to 2% is not easy. One of the problems in trying to reduce inflation are cost of livings adjustments - COLAs. Next year social security recipients and others with COLAs in their pay agreements will get significant increases that will increase demand. With higher wages that are associated with COLA agreements businesses may also be forced to increase prices. COLAs cause an inflation cyclical that is hard for the FED to break.
Unrealized Losses in Bank Securities Portfolios
This article is about unrealized losses carried on a bank's books. As interest rates increase the market value of their debt securities portfolio decline. This does not necessarily mean that the bank will actually incur massive losses on their income statement. Only sold security losses/gains are reported on the income statement. The problem, however, is how these "paper" unrealized losses are reported to investors on the bank's balance sheet and footnotes in SEC filings.
As I covered in prior bank articles, banks often have two security portfolios. The available-for-sale - AFS securities are those that might be sold and are reported at fair value on the balance sheets. Any unrealized losses/gains are reported via accumulated other comprehensive income -AOCI - in the shareholder equity area of the balance sheet. Held-to-maturity - HTM securities are debt securities that are expected to be held until their maturity and are reported on the balance sheet at cost. HTM unrealized losses/gains are not directly reported on the balance sheet, which is now a major issue for some investors/customers. You often have to look at the footnotes of SEC filings to find the unrealized losses/gains, which I did for this article.
Some assert that HTM losses don't really mean that much because banks can now borrow under the Bank Term Funding Program using the securities at par and not at current market value. Only "qualified" securities, however, can be used under BTFP. Many banks hold a lot of mortgage-backed securities that are not backed by the U.S. government and are not, therefore, qualified securities. Corporate and municipal bonds are examples of other non-qualified securities. (Banks can't "game" this program by now buying deep discount qualified securities, such as the 1.25% 5/15/50 bonds, and then pledge them at par. The securities had to be held by the bank prior to March 12, 2023.)
I again added apples (AFS) and oranges ((HTM)) together to get a fruit salad (total unrealized losses) that gives a general idea of the amount of paper losses on their securities held at the end of the 2Q. The specific numbers used were at the end of the quarter - June 30. Many banks also showed average numbers in their 10-Q reports for reporting average interest rate income on their securities and those might be somewhat different than the numbers I used. I also used the latest number of shares outstanding - not the average for the quarter. Since the number of shares outstanding in a specific quarter might be lower than a prior period because of share repurchases there could be a very modest impact on the loss per share figure for certain banks.
These unrealized losses do not reflect any direct/indirect impact from interest rate hedge positions that a bank may have. Some banks are more active in hedging than others. In addition, some currency positions and hedges are also indirect interest rate hedges as well.
Specific Bank Results
Citigroup ( C )
June 30, 2023
Loss per share $14.92
Loss as percentage of current stock price 33%
AFS $242,025 million cost - $237,334 million fair value = $4,691 million loss
HTM $262,066 million cost - $238,021 million fair value = $24,045 million loss
Total unrealized loss $28,736 million
March 31, 2023
Loss per share $14.00
AFS $245,340 million cost - $240,487 million fair value = $4,853 million loss
HTM $264,342 million cost - $242,851 million fair value = $22,491 million loss
Total unrealized loss $27,344 million
December 31, 2022
Loss per share $16.02
AFS $256,608 million cost - $249,679 million fair value = $5,929 million loss
HTM $268,863 million cost - $243,648 million fair value = $25,215 million loss
Total unrealized loss $31,144 million
JPMorgan Chase ( JPM )
June 30, 2023
Loss per share $13.85
Loss as percentage of current stock price 9%
AFS $209,876 million cost - $203,262 million fair value = $6,614 million loss
HTM $408,941 million cost - $375,300 million fair value = $33,641 million loss
Total unrealized loss $40,255 million
March 31, 2023
Loss per share $13.09
AFS $204,671 million cost - $197,248 million fair value = $7,423 million loss
HTM $412,827 million cost - $381,990 million fair value = $30,837 million loss
Total unrealized loss $38,260 million
December 31, 2022
Loss per share $16.00
AFS $216,217 million cost - $205,857 million fair value = $10,360 million loss
HTM $425,372 million cost - $388,648 million fair value = $36,724 million loss
Total unrealized loss $47,084 million
Wells Fargo ( WFC )
June 30, 2023
Loss per share $12.72
Loss as a percentage of current stock price 28%
AFS $142,283 million cost - $134,251 million fair value = $8,032 million loss
HTM $272,360 million cost - $233,836 million fair value = $38,529 million loss
Total unrealized loss $46,556 million
March 31, 2023
Loss per share $11.97
AFS $151,861 million cost - $144,398 million fair value = $7,463 million loss
HTM $277,147 million cost - $240,688 million fair value = $37,459 million loss
Total unrealized loss $44,922 million
December 31, 2022
Loss per share $13.09
AFS $121,725 million cost - $113,594 million fair value = $8,131 million loss
HTM $297,059 million cost - $255,521 million fair value = $41,538 million loss
Total unrealized loss $49,669 million
Bank of America ( BAC )
June 30, 2023
Loss per share $13.78
Loss as a percentage of current stock price 44%
AFS $135,684 million cost - $132,005 million fair value = $3,681 million loss
HTM $614,149 million cost - $508,351 million fair value = $105,798 million loss
Total unrealized loss $109,479 million
March 31, 2023
Loss per share $12.92
AFS $166,349 million cost - $162,410 million fair value = $3,939 million loss
HTM $624,495 million cost - $525,452 million fair value = $99,043 million loss
Total unrealized loss $102,982 million
December 31, 2022
Loss per share $14.28
AFS $225,485 million cost - $220,788 million fair value = $5,697 million loss
HTM $632,863 million cost - $524,267 million fair value = $108,596 million loss
Total unrealized loss $114,293 million
Zions Bancorporation ( ZION )
June 30, 2023
Loss per share $10.64
Loss as a percentage of current stock price 28%
AFS $12,424 million cost - $10,832 million fair value = $1,592 million loss
HTM $10,753 million cost - $10,768 million fair value = $15 million gain
Total unrealized loss $1,577 million
March 31, 2023
Loss per share $8.32
AFS $13,075 million cost - $11,594 million fair value = $1,481 million loss
HTM $10,961 million cost - $11,210 million fair value = $249 million gain
Total unrealized loss $1,232 million
December 31, 2022
Loss per share $10.15
AFS $13,538 million cost - $11,915 million fair value = $1,623 million loss
HTM $11,126 million cost - $11,239 million fair value = $113 million gain
Total unrealized loss $1,510 million
Truist Financial ( TFC )
June 30, 2023
Loss per share $16.40
Loss as a percentage of current stock price 51%
AFS $80,842 million cost - $68,965 million fair value = $11,877 million loss
HTM $55,958 million cost - $45,956 million fair value = $10,002 million loss
Total unrealized loss $21,879 million
March 31, 2023
Loss per share $15.00
AFS $82,998 million cost - $71,858 million fair value = $11,140 million loss
HTM $56,932 million cost - $48,097 million fair value = $8,835 million loss
Total unrealized loss $19,975 million
December 31, 2022
Loss per share $16.70
AFS $84,056 million cost - $71,801 million fair value = $12,255 million loss
HTM $57,713 million cost - $47,791 million fair value = $9,922 million loss
Total unrealized loss $22,177 million
Bank of New York Mellon ( BK )
June 30, 2023
Loss per share $14.56
Loss as a percentage of current stock price 32%
AFS $86,486 million cost - $81,071 million fair value = $5,415 million loss
HTM $53,162 million cost - $47,242 million fair value = $5,920 million loss
Total unrealized loss $11,335 million
March 31, 2023
Loss per share $12.99
AFS $88,872 million cost - $84,117 million fair value = $4,755 million loss
HTM $54,561 million cost - $49,067 million fair value = $5,494 million loss
Total unrealized loss $10,249 million
December 31, 2022
Loss per share 15.00
AFS $92,484 million cost - $86,622 million fair value = $5,862 million loss
HTM $56,194 million cost - $49,992 million fair value = $6,202 million loss
Total loss $12,064 million
Comerica ( CMA )
June 30, 2023
Loss per share $22.27
Loss as a percentage of current stock price 42%
AFS $20,351 million cost - $17,415 million fair value = $2,936 million loss
HTM None
Total unrealized loss $2,936 million
March 31, 2023
Loss per share $20.68
AFS $21,019 million cost - $18,295 million fair value = $2,724 million loss
HTM None
Total unrealized loss $2,724 million
December 31, 2022
Loss per share $23.08
AFS $22,045 million cost - $19,012 million fair value = $3,033 million loss
HTM None
Total unrealized loss $3,033 million
Capital One Financial Group ( COF )
June 30, 2023
Loss per share $26.30
Loss as a percentage of current stock price 23%
AFS $88,445 million cost - $78,412 million fair value = $10,033 million loss
HTM None
Total unrealized loss $10,033 million
March 31, 2023
Loss per share $23.21
AFS $90,785 million cost - $81,925 million fair value = $8,860 million loss
HTM None
Total unrealized loss $8,860 million
December 31, 2022
Loss per share $26.58
AFS $87,047 million cost - $76,919 fair value = $10,128 million loss
HTM None
Total unrealized loss $10,128 million
PNC Financial Services Group ( PNC )
June 30, 2023
Loss per share $23.12
Loss as a percentage of current stock price 18%
AFS $46,017 million cost - $41,787 million fair value = $4,230 million loss
HTM $93,874 million cost - $88,896 million fair value = $4,979 million loss
Total unrealized loss $9,209 million
March 31, 2023
Loss per share $18.42
AFS $46,977 million cost - $43,220 million fair value = $3,757 million loss
HTM $95,019 million cost - $91,425 million fair value = $3,594 million loss
Total unrealized loss $7,351 million
December 31, 2022
Loss per share $23.28
AFS $48,568 million cost - $44,159 million fair value = $4,409 million loss
HTM $95,175 million cost - $90,279 million fair value = $4,896 million loss
Total unrealized loss $9,305 million
Conclusion
This article is aimed at a very broad audience of those interested in the massive unrealized losses at many banks. Often my articles focus on a very narrow audience of those with expertise in the technicalities associated with the Ch.11 bankruptcy process and how it impacts various investments. Those who have extensive understanding of analyzing bank stocks may find this article too simplistic.
While many bank investors have now become rather blasé about bank's unrealized losses in their securities portfolios in part because of BTFP, they should not ignore this issue, especially if interest rates continue to increase. If, however, a trader thinks interest rates are about to drop significantly those banks with the largest unrealized loss per share might warrant a second look. I think rates are headed even higher as the Fed increases rates to get the inflation rate down to their 2% target.
For further details see:
Updated Q2 List Of Banks And Their Massive Paper Losses On Their Debt Securities Holdings