ASG - USA Growth And Value 11% Yield Vs. ASG Growth 9% Yield 5% Discount
2023-09-29 09:15:00 ET
Summary
- Liberty All-Star Equity USA closed-end fund and Liberty All-Star Growth ASG fund are high yield CEFs with value and growth attributes.
- USA has a larger net asset value, higher average daily volume, and a lower P/E ratio compared to ASG.
- Both funds pay quarterly distributions, with USA yielding 10.87% and ASG yielding 8.96% at their respective prices.
Looking for high yield stocks with value and growth attributes?
The 2 closed-end funds ("CEFs") we're covering in this article, Liberty All-Star Equity ( USA ) and its sister fund, the Liberty All-Star Growth fund ( ASG ), use multiple managers for investing in different areas of the market.
Fund Profiles:
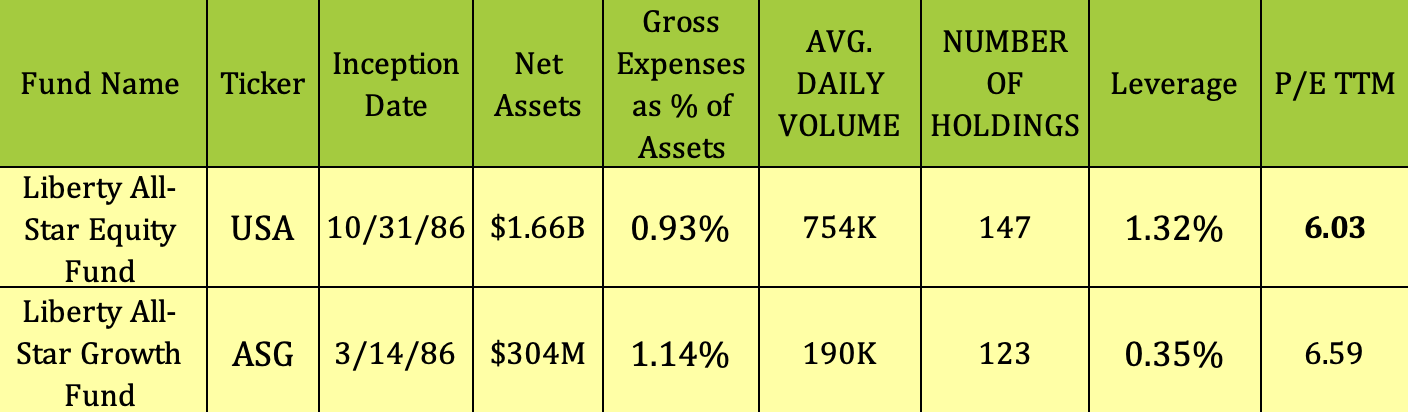
USA uses a multi-faceted approach to its investments, using 3 value portfolio managers and 2 growth managers with expertise in different slices of the market. Its portfolio holds 60% in value equities and 40% in growth equities. ASG specializes in growth equities, utilizing 3 managers, each focusing on either small, mid, or large market cap equities. Both funds were launched in 1986, and both pay variable quarterly distributions.
USA is a much larger fund, with $1.66B in net assets, vs. $304M for ASG. USA has a slightly lower expense ratio of 0.93%, vs. ASG's 1.14%, and also uses a bit more leverage, but still a low level of 1.32%.
USA has much higher average daily volume, of 754K, vs. ASG's 190K; and has a lower P/E of ~6X, vs. 6.59X for ASG.
Dividends:
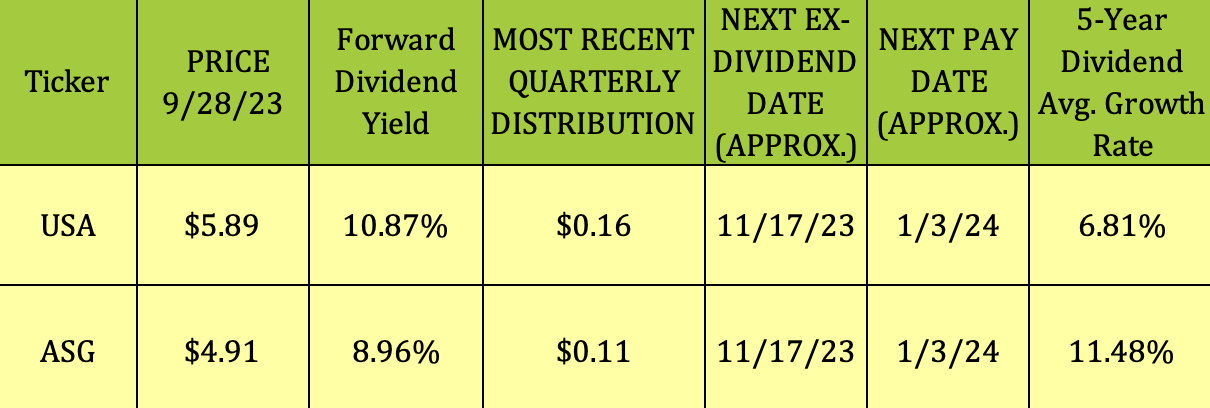
USA's policy is to pay quarterly distributions on its shares totaling ~10% of its NAV per year, payable in 4 quarterly installments of 2.5% of the Fund’s NAV. Its most recent distribution, paid in early September, increased from $.15 to $.16. At its 9/28/23 intraday price of $5.89, USA yielded 10.87%. It has a 5-year dividend growth rate of 6.81%.
ASG's policy is to pay quarterly distributions on its shares totaling ~8% of its net asset value per year, payable in four quarterly installments of 2% of the Fund’s NAV. ASG's distribution increased from $.10 to $.11 in March 2023. ASG yields 8.96% at its 9/28/23 intraday price of $4.91. ASG has a much higher 5-year dividend growth rate of 11.48%.
Holdings:
USA: As of 8/31/23, USA's top sector exposures were Tech, Financials, Health Care, and Consumer Discretionary, forming ~70% of its portfolio. A notable change vs. 3/31/23 was Tech increasing from 19.5% to 21.4%.
USA site
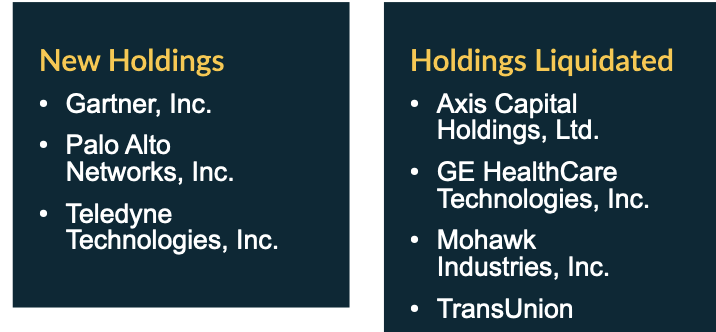
Since 3/31/23, USA has added Gartner, Palo Alto Networks, and Teledyne to its holdings, while liquidating Axis Capital, GE Healthcare, Mohawk Industries, and TransUnion.
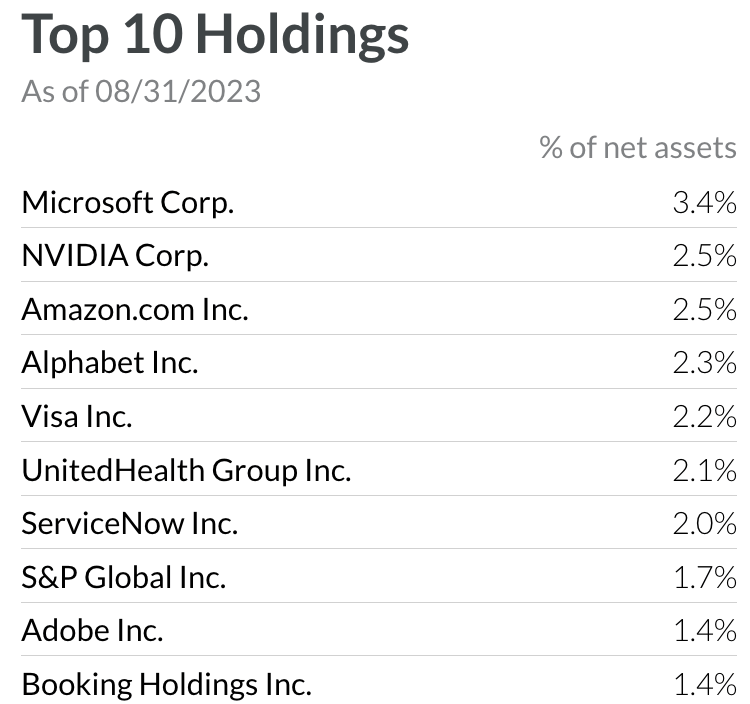
USA's top 10 holdings formed ~21% of its portfolio as of 8/31/23, with many familiar large cap names. Nvidia moved into its top 10, while Sony moved out, since 3/31/23.
ASG sector exposures are much higher than USA's in Healthcare and Industrials; and much lower in Financials.
ASG site
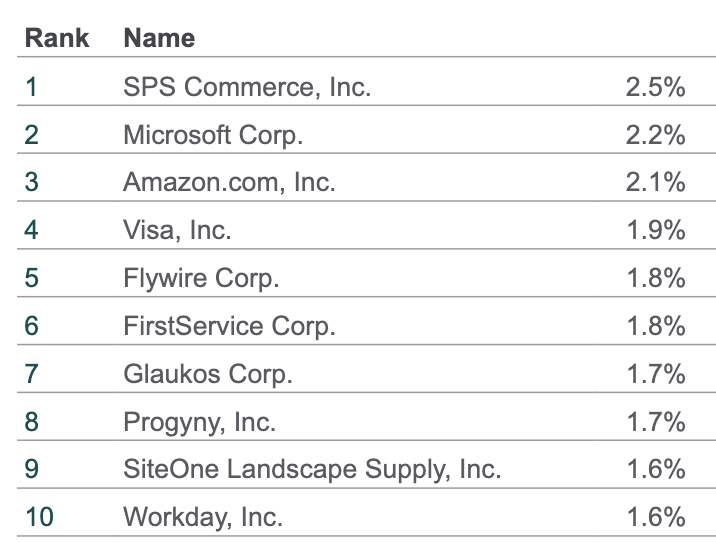
ASG's top 10 positions form ~19% of its portfolio. Since 3/31/23, Casella Waste Systems, Deckers Outdoor, and MSCI have moved out of the top 10, being replaced by Glaukos, SiteOne Landscape, and Flywire.
Performance:
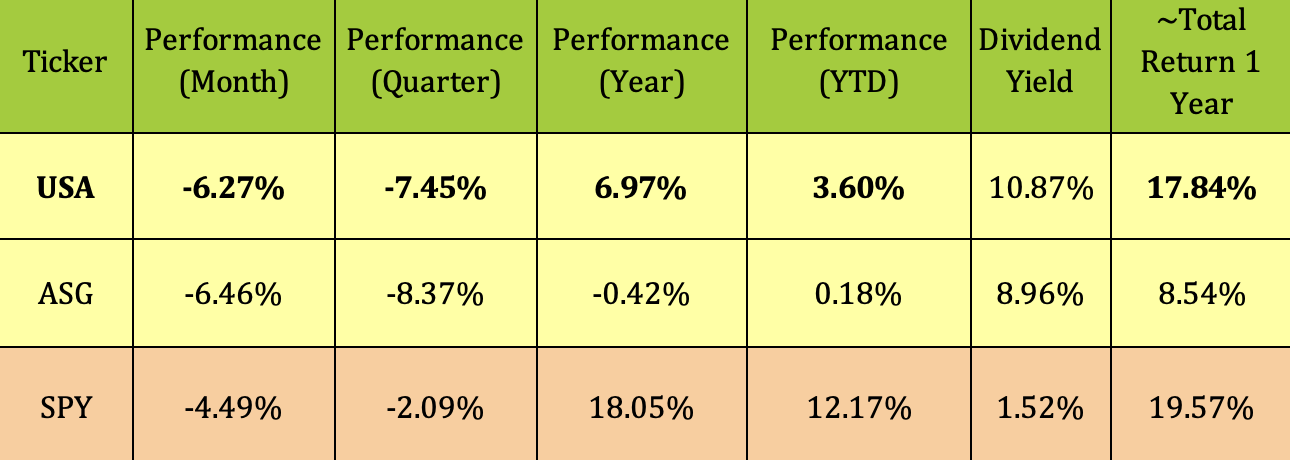
USA has outperformed ASG by a wide margin over the past year and a smaller margin so far in 2023, but both funds lag the S&P 500 (SPY) year to date.
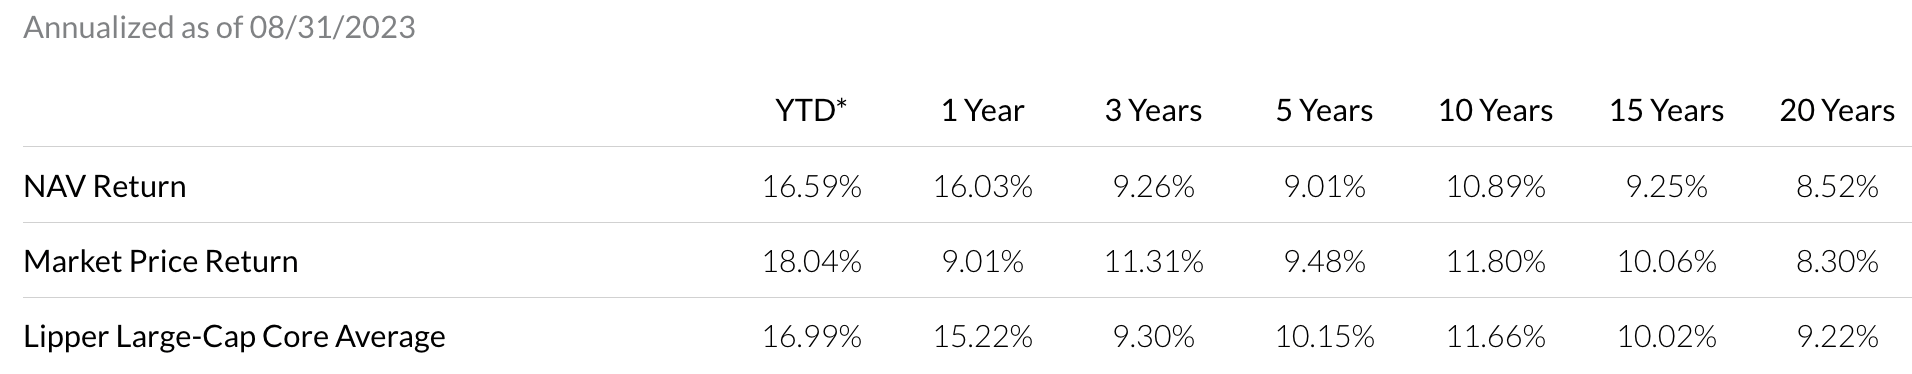
USA's long term 10-15-20 year NAV and price returns lag ASG's slightly, but its 1-3-5 year returns have outpaced ASG's, while mostly keeping pace with the Lipper Large Cap Core Index's average returns.
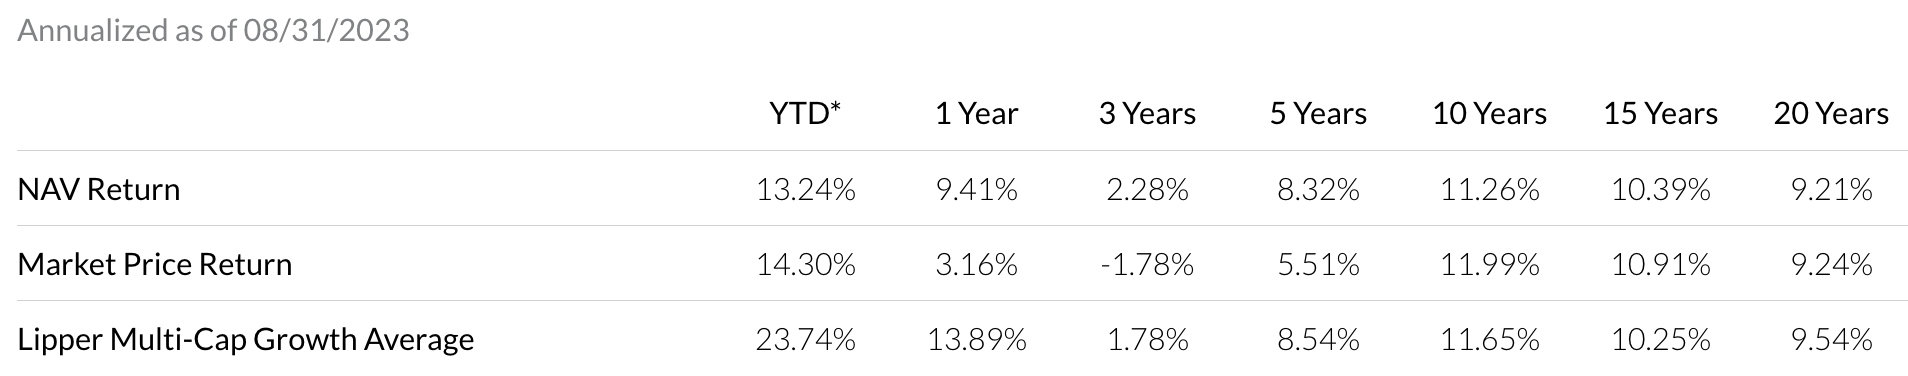
ASG's long term 5-10-15-20 NAV & Price returns have ~kept pace with the Lipper Multi-Cap Core Index's average returns, whereas its 1-3-5 year Price returns have lagged:
Valuations:
A useful strategy when buying CEF's is to try to buy them at deeper discounts or lower premiums than their historical averages, due to mean reversion.
USA has mostly been selling at ~0% up to 10% premiums since Q2 '21, with occasional short dips into negative territory, whereas it spent most of Q3 '18 to Q1 '21 at discounted prices to NAV/share:
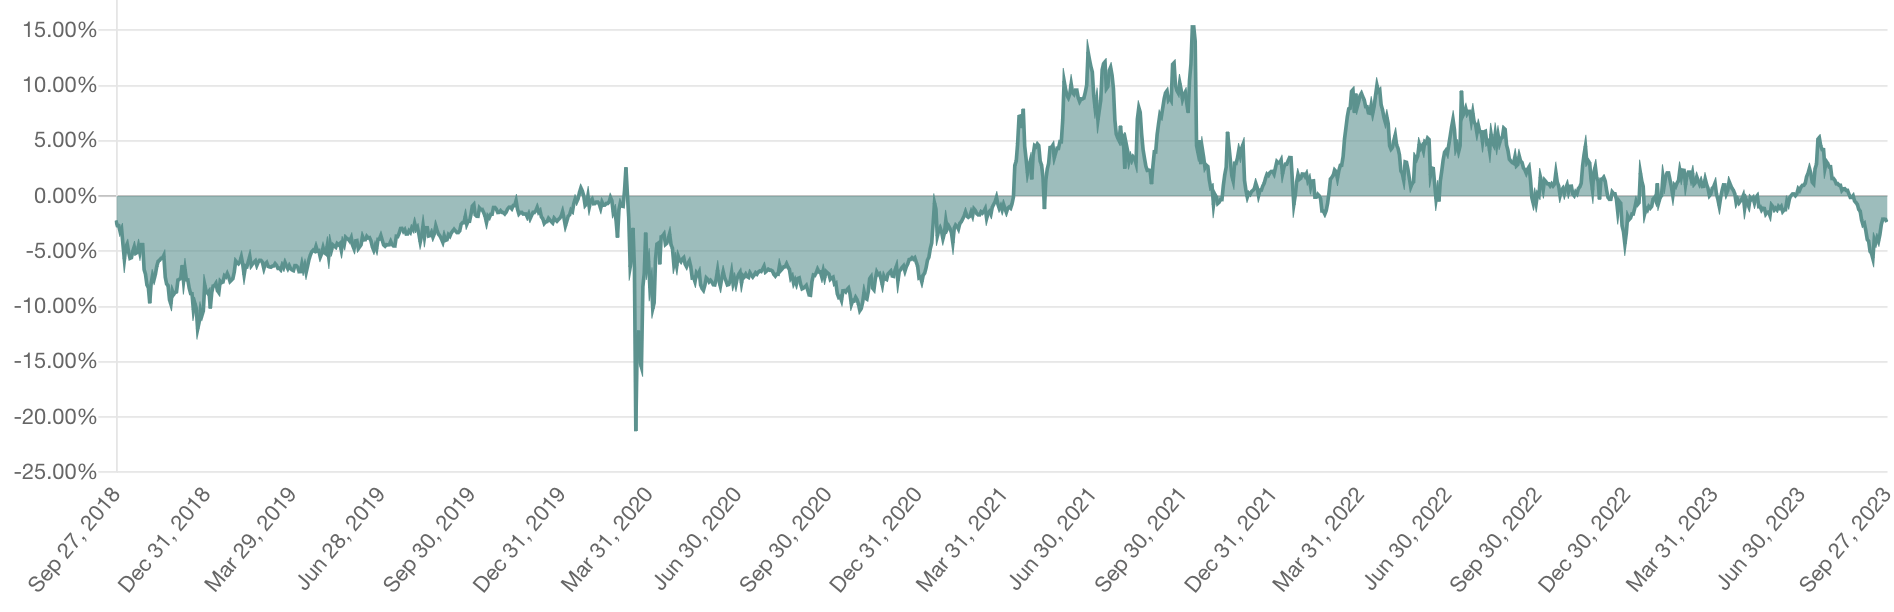
ASG has had more volatility - it spent most of Q3 '18 to Q2 '20 in the red, but bounced back to mostly selling at premiums from Q3 '20 to Q3 '22. However, since then it has been selling at a discount to NAV/share:
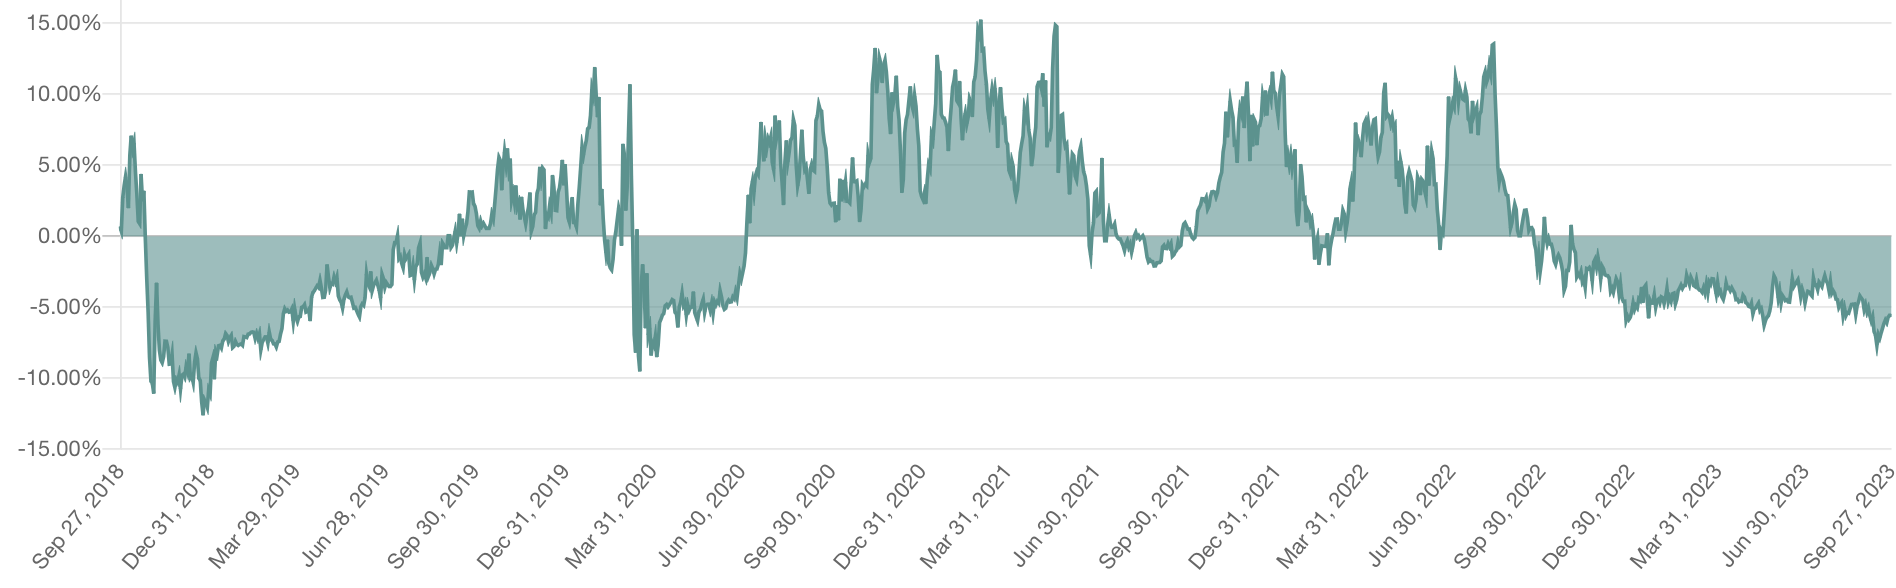
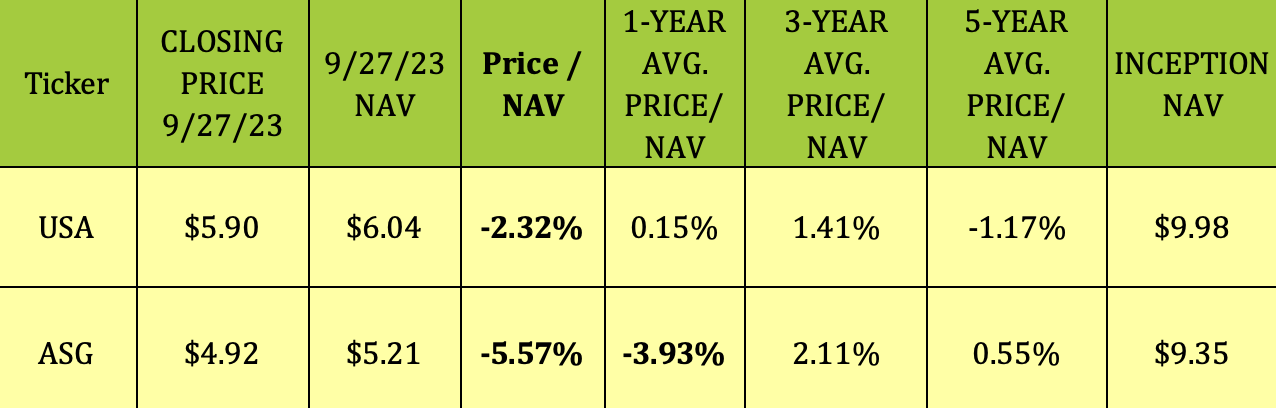
At their 9/27/23 closing prices, USA was selling at -2.32% Price/NAV, which is cheaper than its 1-3-, and 5-year average price/NAV.
ASG was selling at a -5.57% Price/NAV, which is much cheaper than its 1-3-, and 5-year average price/NAV.
Parting Thoughts:
Both funds are oversold on their long term stochastic charts - USA is ~9% above its 52-week low, whereas ASG is only 2.4% above its 52-week low. ASG's current 5.5% deeper-than-average discount offers a more attractive speculative buying opportunity than USA.
All tables furnished by Hidden Dividend Stocks Plus, unless otherwise noted.
For further details see:
USA Growth And Value 11% Yield Vs. ASG Growth 9% Yield, 5% Discount