CDC - USMV: The Low-Volatility Factor Is Too Costly Today
Summary
- USMV is a leading low-volatility ETF with over $31 billion in assets under management. Fees are reasonable at 0.15%, and the ETF has a solid 11-year performance track record.
- This article compares USMV with three other low-volatility ETFs: SPLV, QLV, and SPMV. One consistent theme is that each trade at valuations that are inconsistent with their poor growth potential.
- Since the U.S. stock market is down 16% YTD, investors should start demanding a discount for the potential underperformance they may experience going forward. USMV doesn't offer that.
- Therefore, I've rated USMV a hold, but acknowledge that in the low-volatility category, it's still a solid choice.
Investment Thesis
The iShares MSCI USA Minimum Volatility Factor ETF ( USMV ) is the most popular in its category, but the low-volatility factor is a costly one in today's market. Currently trading at 22.39x forward earnings, USMV is more expensive than the better-diversified SPDR S&P 500 ETF ( SPY ) despite 3.16% less estimated earnings growth. Furthermore, it may be late to invest in low-volatility ETFs after the market has already declined 16% this year. Investors should demand a substantial discount for the risk of underperforming in a bull market, and since that's not the case with USMV or any of its three peers analyzed, I don't recommend buying now.
ETF Overview
Strategy, Sector Exposures, and Top Holdings
USMV tracks the MSCI USA Minimum Volatility Index, selecting stocks meeting four criteria:
- Low beta relative to the MSCI USA Index
- Lower volatility than the MSCI USA Index
- Lower cap bias
- Bias towards stocks with low idiosyncratic risk
Each May and November, the Index is optimized to achieve the lowest estimated volatility, indicating USMV just experienced some changes. Nevertheless, a key constraint is that sector exposures can't deviate more than 5% from the parent index. As a result, it selects the least-volatile stocks in each sector. That's not always a negative feature, but a 22% exposure to Technology stocks in bear markets isn't ideal. Cisco Systems ( CSCO ) and Texas Instruments ( TXN ) are still performing poorly despite their low-volatility features relative to the Technology sector.
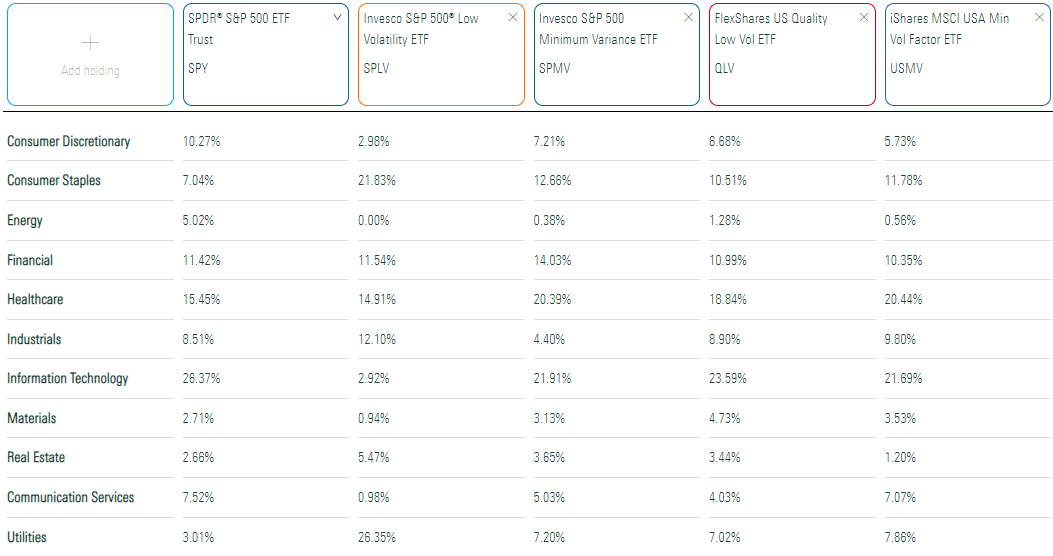
USMV's sector exposures are below, alongside the SPDR S&P 500 ETF and the Invesco S&P 500 Low Volatility ETF ( SPLV ). USMV and SPLV are the leading low-volatility ETFs by assets under management, with expense ratios of 0.15% and 0.25%. I've also included two newer offerings: the Invesco S&P 500 Minimum Variance ETF ( SPMV ) and the FlexShares US Quality Low Volatility ETF ( QLV ), with expense ratios of 0.10% and 0.22%.
As mentioned, USMV has a nearly 22% exposure to Technology, but that's common when considering SPMV and QLV and its 20% exposure to Health Care. Like SPY, USMV has little exposure to Energy, Materials, and Real Estate, though it does have a healthy exposure to Utilities (7.86%). Still, if you want more "pure" exposure to the low-volatility factor, SPLV is most appropriate. Consumer Staples and Utilities account for nearly half the portfolio, and its 0.65 five-year beta is the lowest of the four.
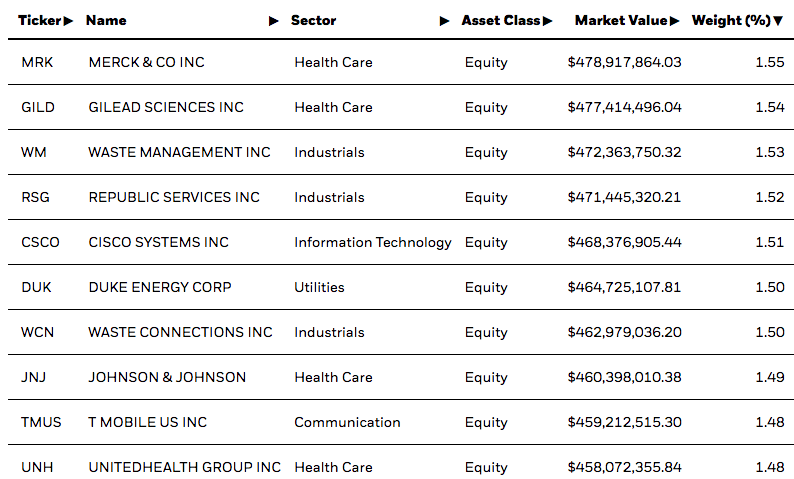
USMV's top ten holdings are below, and it looks like an equal-weight fund with Merck & Co. ( MRK ), Gilead Sciences ( GILD ), Waste Management ( WM ), Republic Services ( RSG ), and Cisco Systems each around the 1.50% mark. However, USMV is optimized to achieve the lowest absolute volatility subject to its constraints. The average weight for its 165 constituents is just 0.61%, with 88 having less than a 0.50% weight.
Performance Analysis
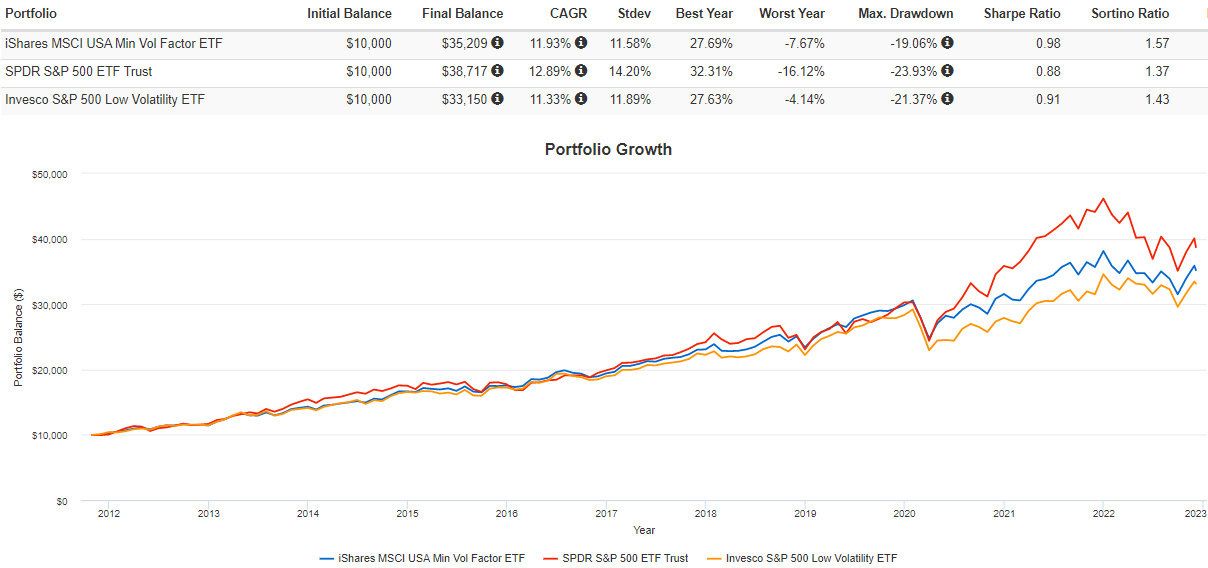
Since October 2011, USMV returned an annualized 11.93% compared to 12.89% and 11.33% for SPY and SPLV. As measured by standard deviation, total volatility was the lowest at 11.58%, leading to the best risk-adjusted returns (Sharpe and Sortino Ratio).
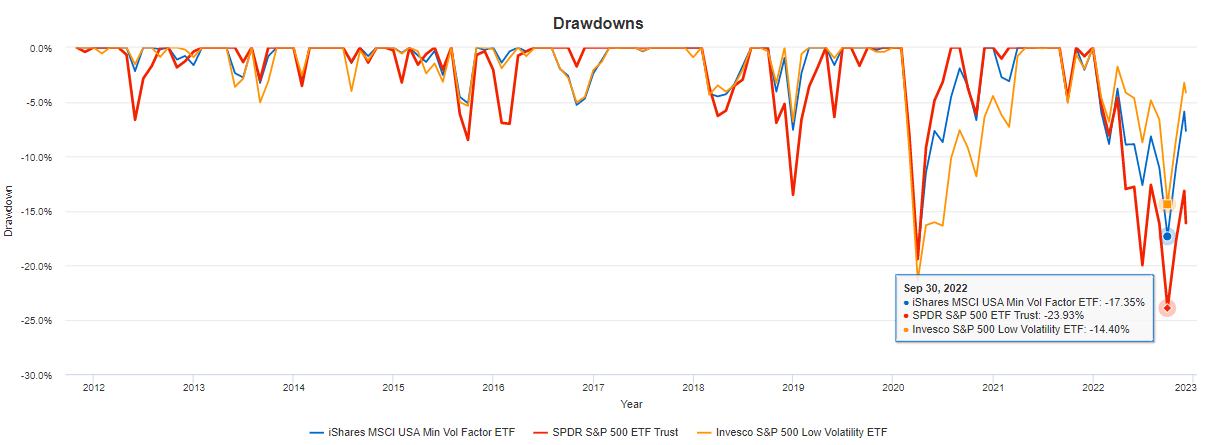
USMV often outperforms during drawdowns. The 19.06% drawdown figure listed above occurred in February and March 2020, slightly better than SPLV's 21.37% drawdown. SPY's 23.93% drawdown occurred this year from January to September, much worse than USMV and SPLV's 17.35% and 14.40% drawdown. These numbers make sense, as the least-volatile ETF ( SPLV ) should perform the best in bear markets. The drawdowns graph below shows how this is often the case. Since low-volatility ETFs are usually slower to recover, investors can either seek one with a solid growth component or be willing to trade it out after experiencing some of the benefits during a drawdown.
Though not established, QLV and SPMV have shown some promise. Since July 2019, they've beaten USMV on a total returns basis with similar standard deviation and drawdown metrics.
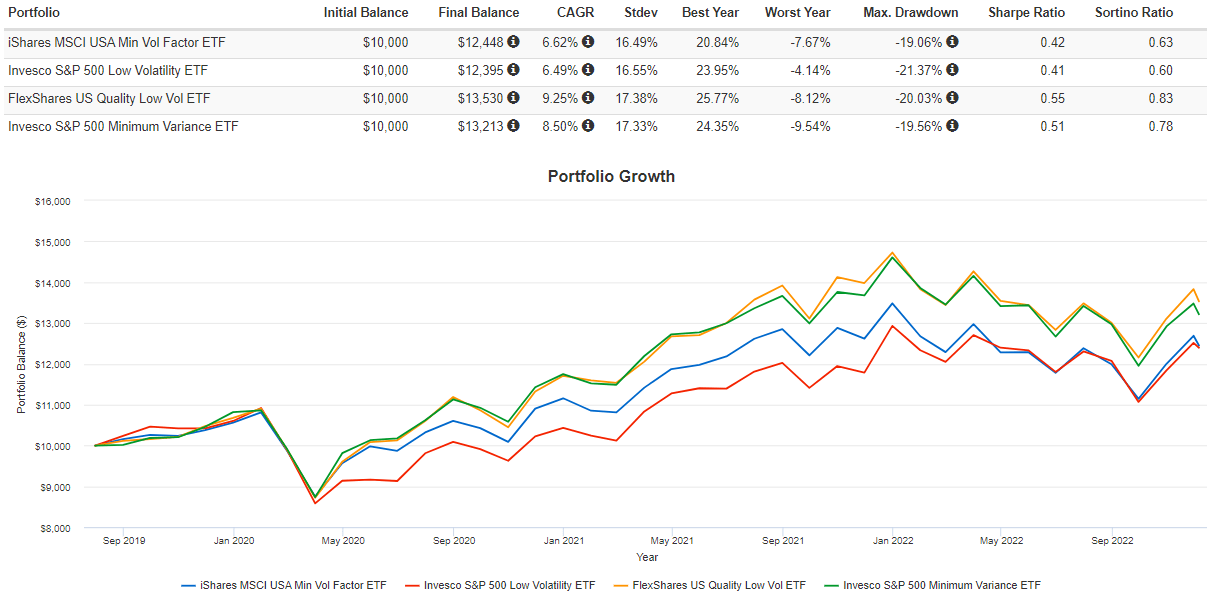
Their short histories may mean they aren't yet investable, but their expense ratios are low, and they compete well with USMV and SPLV on the low-volatility factor. Let's now look at how all four funds compare fundamentally.
Fundamentals Analysis
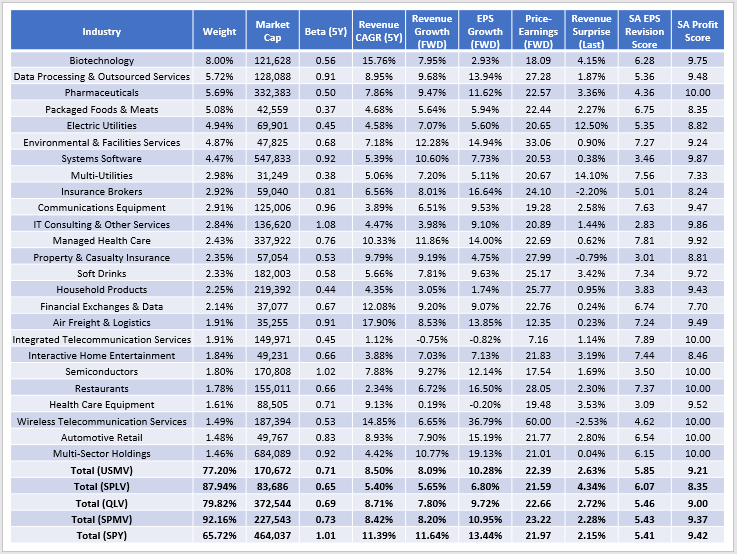
Since USMV's top 25 holdings only account for 35% of the portfolio, I've decided to analyze the ETF from an industry perspective instead. USMV's top 25 industries total 77.20%, making it the best-diversified compared to SPLV (87.94%), QLV (79.82%), and SPMV (92.16%).
I chose these comparators because they are among the few large-cap low-volatility ETFs with five-year betas under 0.75. CDC is often cited, but its volatility is approaching 0.90 after its latest reconstitution . SPHD combines the low-volatility and high-dividend factors, but its beta is 0.86. Other potential passively-managed choices include LVHD ( covered here ), XRLV , ALTL , FVD ( covered here ), and KVLE , and I'm happy to provide metrics for these ETFs in the comments section later if needed.
Turning to USMV, its 0.71 five-year beta is slightly higher than SPLV, QLV, and SPMV. The difference is slight, but generally, investors can expect stronger performance in bull markets and vice versa. USMV overweights Biotechnology stocks but holds relatively high-beta stocks from the Data Processing & Outsourced Services Systems Software industries. These riskier companies often have higher growth rates and valuations. For example, Paychex ( PAYX ) and Microsoft ( MSFT ) have estimated earnings growth rates of 10.89% and 19.31%, but they trade at 28.86x and 25.71x forward earnings. These additions make USMV a relatively expensive fund at 22.39x forward earnings. Even the higher-growth SPY trades cheaper, and it's tough for me to justify sacrificing so much for a low-beta fund. Unfortunately, the other three peers aren't any better. To summarize:
1. SPLV's growth prospects are terrible, and with SPY already down 16% YTD, investors could already be late to the party. However, its constituents had a solid last quarter sales surprise figure (4.34%), and its 6.07/10 EPS Revision Score suggests optimism on Wall Street.
2. QLV's metrics all look worse than USMV's. Estimated sales and earnings growth are about 0.50% less. Its forward earnings valuation is 0.27 points higher, and its EPS Revision and Profitability scores are lower.
3. SPMV improves on both growth and profitability. However, it has the highest valuation of the four ETFs at 23.22x forward earnings.
Investment Recommendation
Low-volatility ETFs should offer some valuation discount to the broader market. However, that's not the case with USMV or any of the three peers analyzed. Furthermore, limited downside-protection benefits may be left after the market has already declined by 16% this year. USMV may be solid, but it isn't the right time to focus on the low-volatility factor regardless of valuation. Considering how many dividend ETFs with double-digit earnings growth trade at 16-19x forward earnings, the tradeoffs don't make sense. I hope this explains why I've rated USMV a hold, and I look forward to continuing the discussion in the comments below.
For further details see:
USMV: The Low-Volatility Factor Is Too Costly Today