VYM - Value Stocks Are Usually A Safe Haven During Bear Markets
2023-10-31 10:11:23 ET
Summary
- Value stocks have historically outperformed Growth stocks during bear markets, such as the bursting of the Dot-com bubble in 2000 and the recession of 1982.
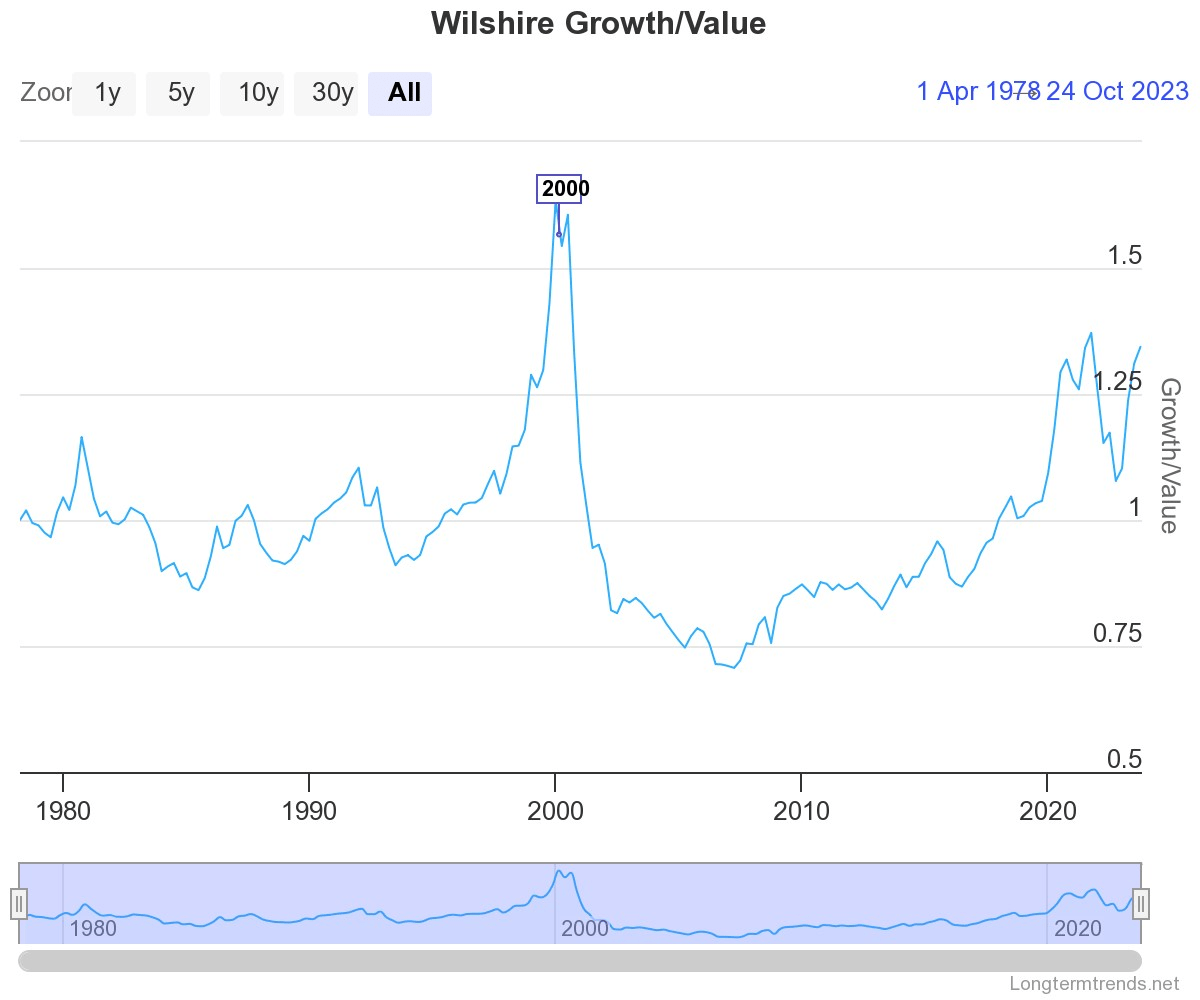
- The current Wilshire Growth/Value ratio of 1.3 suggests that Value stocks are likely to outperform Growth stocks in the near future.
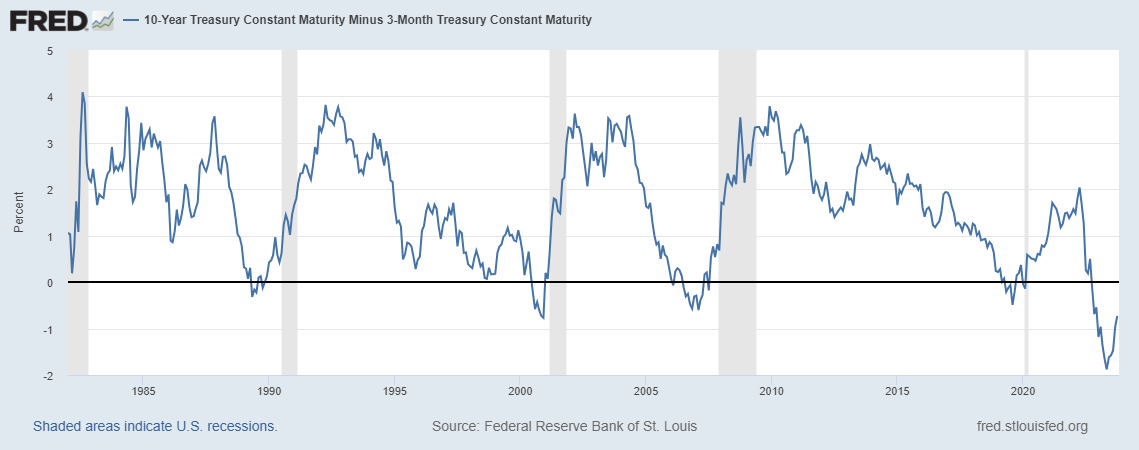
- Due to the current inverted yield curve, it is likely that a recession and bear market will occur in the near future.
In this paper we will consider the current outlook for Value vs Growth stocks during a possible bear market in late 2023 or 2024. We will do this by considering the performance of Value vs Growth stocks during bear markets since 1978. Since where we start from is one of the most import factors, we will order our analysis from the valuation of Wilshire Growth / Wilshire Value Index at the beginning of each pullback. The current Growth/Value ratio of 1.3 is between the valuation ratio at the beginning of the Dot-com bubble and the recession of 1982. The current Growth/Value ratio of 1.3 is also similar to the valuation at the beginning of the pull back in 2022. During the recession of 1982, the bursting of the Dot-com bubble of 2000, and the pull back in 2022, Value stocks significantly out-performed Growth stocks.
| Wilshire Growth/Value |
| Pull Back (S&P 500) |
| Beginning |
| Length (Months) |
| Dot-com Bubble 2000 |
| 1.7 |
| -49% |
| March 2000 |
| 31 |
| Dot-com Bubble 2022 |
| 1.4 |
| -25% |
| January 2022 |
| 9 |
| Early 1980s Recession |
| 1.2 |
| -27% |
| November 1980 |
| 21 |
| COVID Scare |
| 1.1 |
| -30% |
| February 2020 |
| 1 |
| Black Monday |
| 1.0 |
| -34% |
| August 1987 |
| 3 |
| Early 1990s Recession |
| 1.0 |
| -20% |
| July 1990 |
| 3 |
| Housing Bubble |
| 0.7 |
| -56% |
| October 2007 |
| 17 |
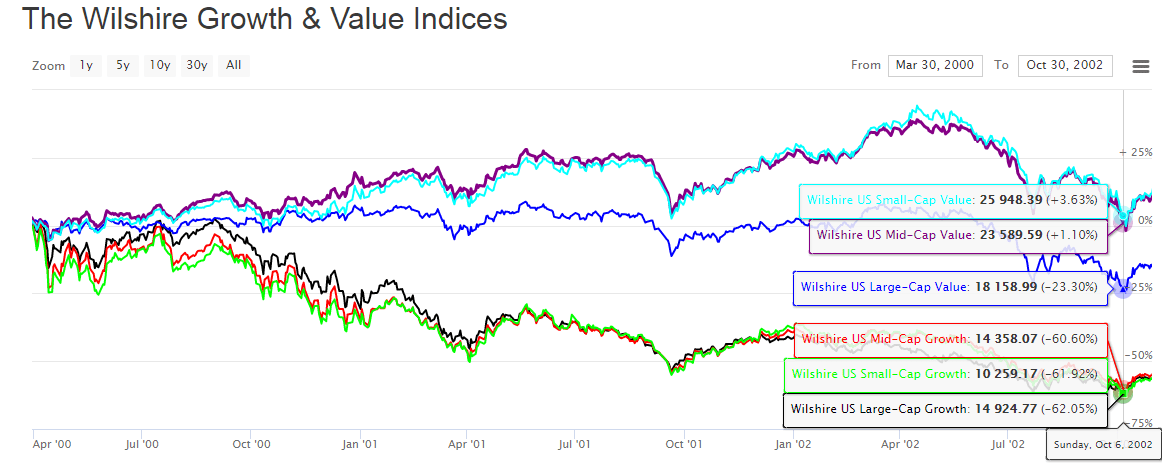
The Dot-com bubble was the most brutal pull back for Growth stocks. It started with a Growth/Value ratio of around 1.7. During the overall market pull back from March 2000 to October 2002 the S&P 500 dropped by 49%. Growth stocks experienced a deeper bear market. Large-Cap, Mid-Cap, and Small-Cap Growth Stocks all dropped by a little over 60%. At the same time, Large-Cap Value stocks dropped by 23% whereas Mid-Cap and Small-Cap Value stocks did not notice that there was a bear market. The smaller Value stock indexes increased by single digits.
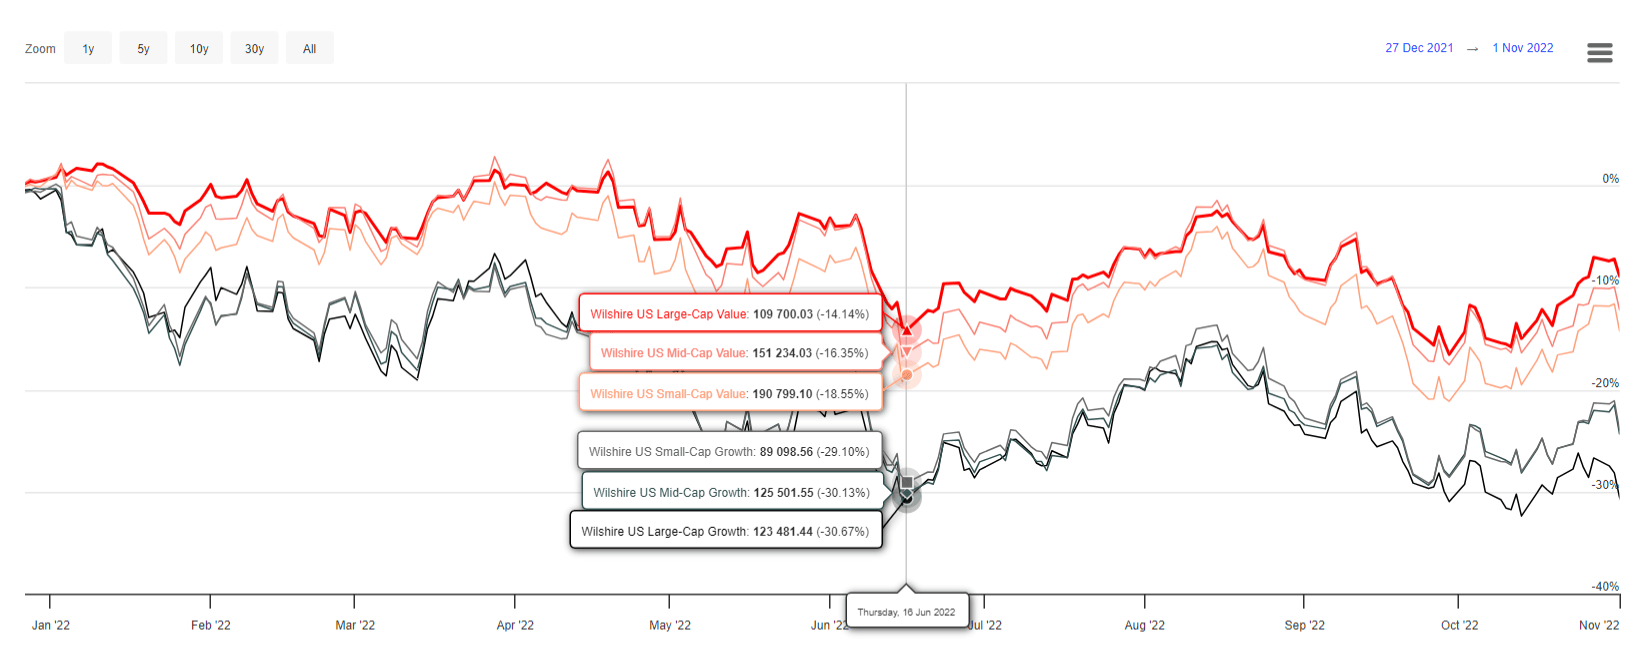
The Dot.com Bubble of 2022 was similar to the first Dot.com bubble but quicker and not as brutal. It started with a Growth/Value ratio of around 1.4. During the market pull back from a January 2022 to October 2022, the S&P 500 dropped by 25%. Growth stocks experienced a deeper bear market than the S&P 500. Large-Cap Growth Stocks dropped by 31%, Mid-Cap, and Small-Cap Growth Stocks dropped by 30% and 29% respectively. At the same time, Large-Cap Value stocks dropped by 14%, Mid-Cap Value stocks dropped by 16%, and Small-Cap Value stocks dropped by 19%.
The bear market during the early 1980s recession started with a Growth/Value ratio of around 1.2. From November 1980 until August 1982 the S&P 500 dropped by around 27%. Due to differences in Small and Large-Cap stock performance, the Wilshire 5000 numbers do not show a bear market, but do show significant Value stock out-performance during this time period. Small-Cap, Mid-Cap, and Large-Cap Value stocks had a return of 12%, 1%, and -5% respectively. Mid-Cap, Small-Cap, and Large-Cap Growth stocks all under-performed at -11%, -15%, and -15% respectively.
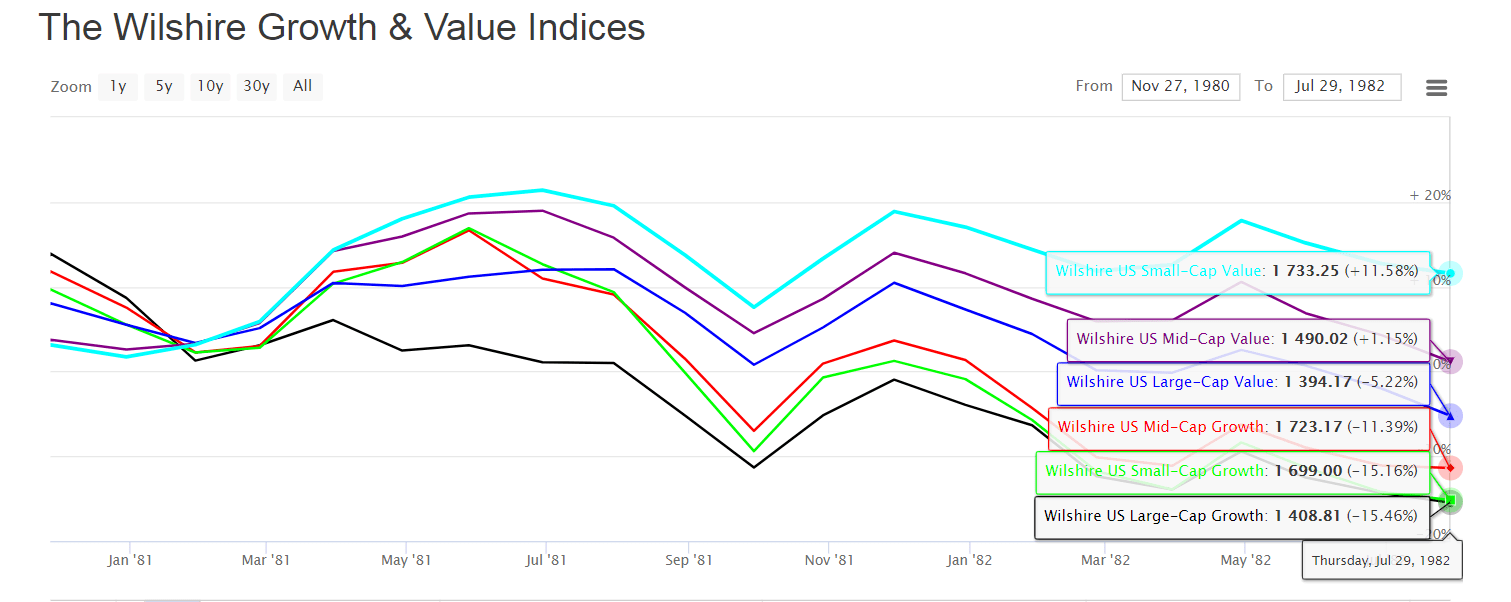
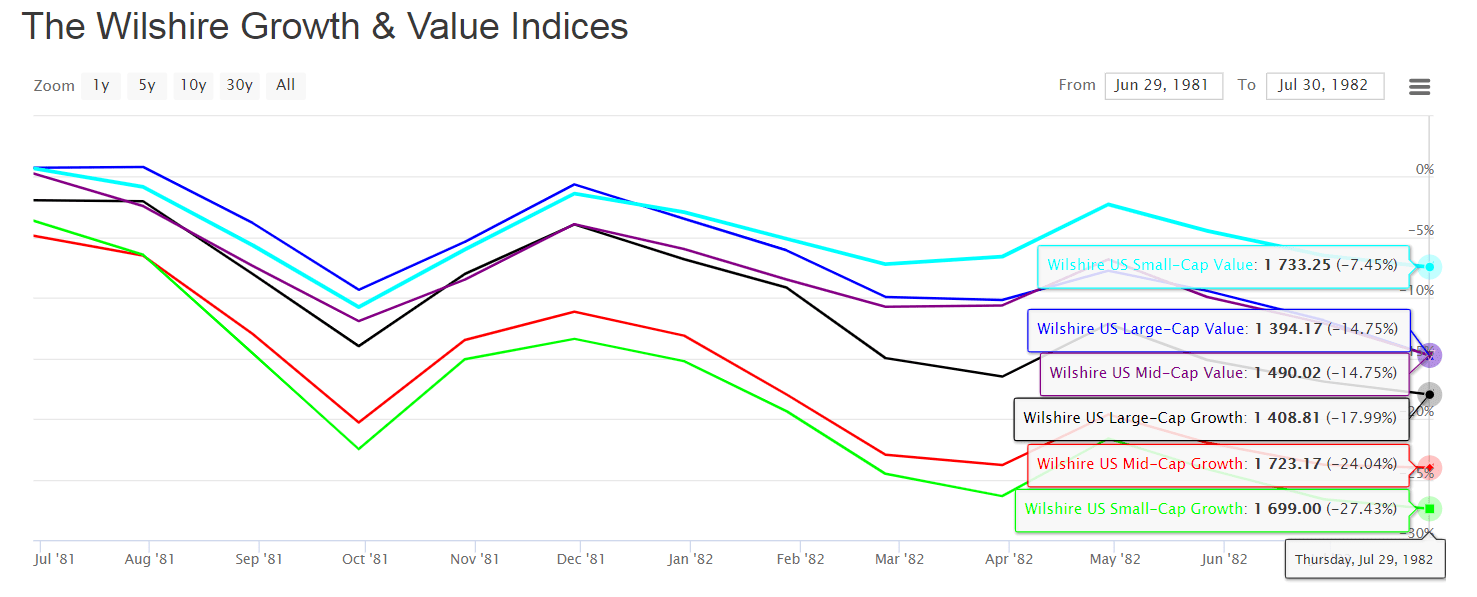
A look at a shorter time period than the S&P 500 bear market does show a Wilshire 5000 bear market from June 1981 to July 1982. Again all Value stock categories out-performed all Growth stock categories. The best performance was by Small-Cap Value stocks at -7% and the worst by Small Cap Growth stocks at -27%.
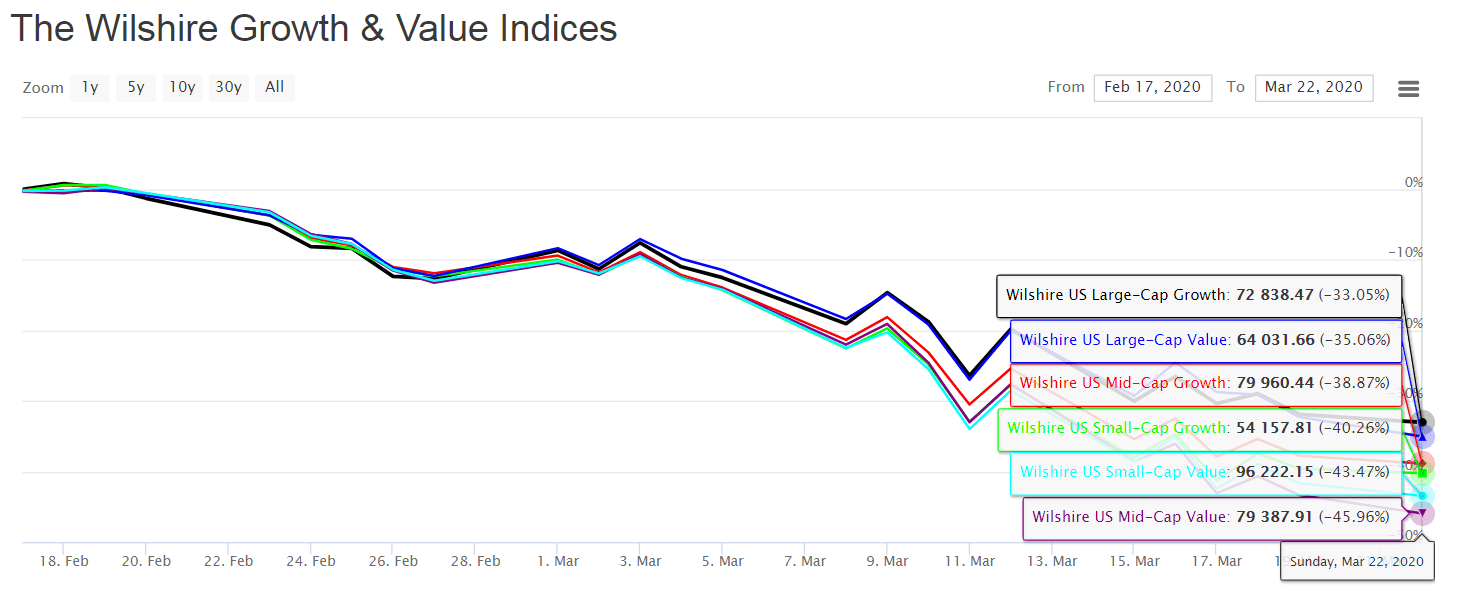
The COVID scare of February 2020 only lasted a month and started with a modest Growth/Value ratio of around 1.1. During this pull back both Large-Cap Growth and Large-Cap Value stocks out-performed Mid and Small-Cap Stocks. The best performance went to Large-Cap Growth Stocks with a -33% pullback followed by Large-Cap Value with a -35% performance and the worst to Mid-Cap Value with a -46% performance.
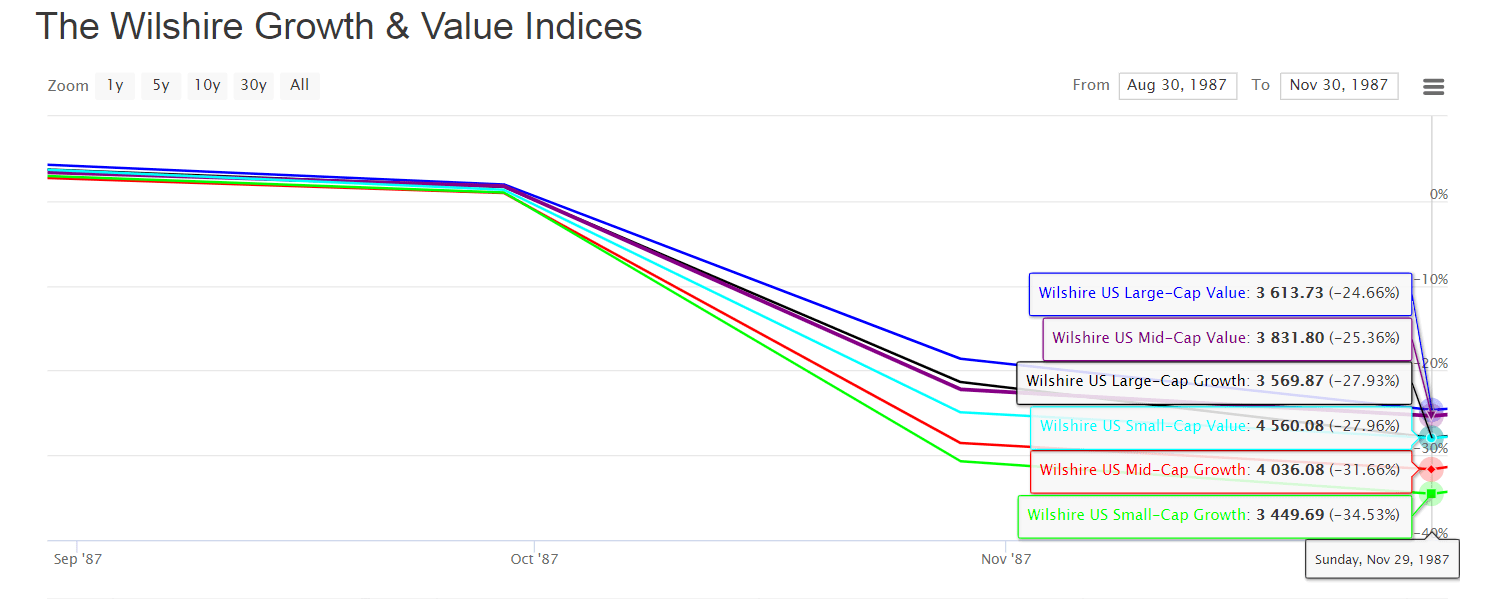
The Black Monday drop from August to November 1987 started with a Growth/Value Ratio of around 1.0 and again saw a Value-Stock out-performance. The best performer was Large-Cap Value at -25% and the worst Small-Cap Growth at -35%. Large-Cap Growth and Small Cap-Value tied at -28%.
The brief pull back during mild 1990 recession started with a Growth/Value Ratio of around 1.0. The S&P 500 dropped by around 20% over the three months from July 1990 to October 1990. During this brief pullback from a near parity Growth/Value Ratio, little correlation in the Value vs Growth stock category was shown with stock performance. Instead stock performance was determined by stock size. Large-Cap stocks (Growth and Value) dropped by around 14%. Mid-Caps (Growth and Value) dropped by 22%, and Small-Caps dropped by 27% for Value and 29% for Growth.
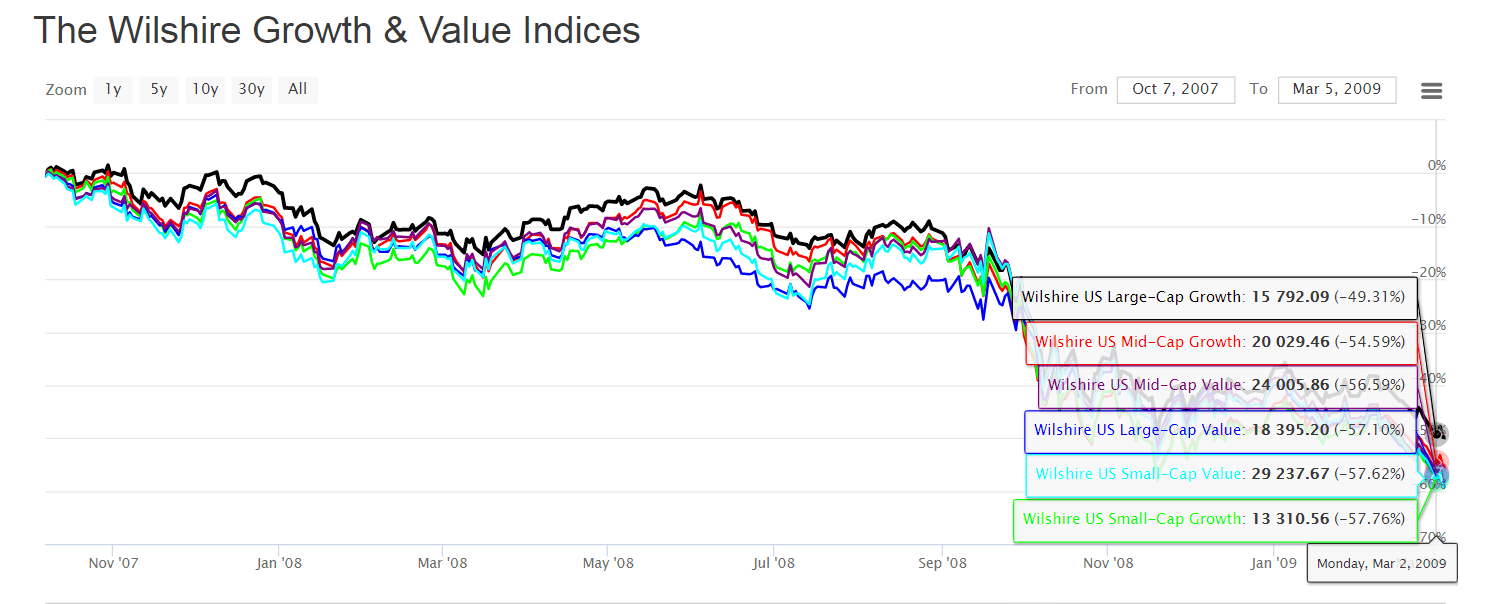
The last pull back on our list occurred at the end of the Housing Bubble and ran from October 2007 to March 2008. This pull back started with the Wilshire Growth/Value index at below parity: 0.7. Not surprisingly, this was the pull back where Growth stocks performed the best versus Value stocks. The top performers were Large and Mid-Cap Growth stocks at -49 and -54% respectively. Small-Cap Growth and all categories of Value stocks lost about 57% to 58%.
Given that an inverted yield curve has existed between 10-year Treasury bond yield and the 3-month Treasury bill rate since October 2022, a recession in the near future is likely.
Lag times between inverted yield curves and recessions have ranged from 5 months to 17 months since 1969.
AIER
Given that the current Wilshire Growth/Value ratio of 1.3 lies between the Dot-com bubble and the recession of 1982, Value stocks appear to be the safest stock investment category at this point in time and the most likely type of stock to lead to profits or at least minimize losses during the next year.
Examples of good low cost Value ETFs include the Invesco S&P 500 Pure Value ETF ( RPV ), the iShares Russell 2000 Value Index ETF ( IWN ), the Vanguard High Dividend Index Fund ( VYM ), the Vanguard High Dividend International Index Fund ( VYMI ), the Vanguard Value Index Fund ( VTV ), the Vanguard Mid-Cap Value Index Fund ( VOE ), and Vanguard Small-Cap Value Index Fund ( VBR ).
For further details see:
Value Stocks Are Usually A Safe Haven During Bear Markets