VREX - Varex Imaging: Record Q2 Sales Don't Change The Economic Headwinds Or The Thesis
2023-09-16 08:38:37 ET
Summary
- Varex Imaging Corporation's stock has dropped 17% since the June publication.
- The macroeconomic backdrop suggests a decline in total corporate spending, which could impact VREX's investment prospects.
- VREX's economic performance indicates that it is not meeting key benchmarks and an attractive earnings rate on capital employed.
- Net-net, reiterate hold.
Investment Briefing
The hold rating on Varex Imaging Corporation ( VREX ) in the June publication turned out to be a frugal call. The stock has turned sharply and now sells 17% to the downside since then. Equity benchmarks continue to trade higher on aggregate, and those names without the business returns to support the case aren't being considered investment grade at this point. This is relevant for VREX, as a similar thematic plagues its investment prospects. The company itself is well-positioned, and its products are beneficial to the medical imaging industry. Its medical imaging and industrial segments are critical to the industry at large.
But there are too many unanswered questions to advocate buying the company today. This report will look at each of these. Net-net, I reiterate VREX a hold.
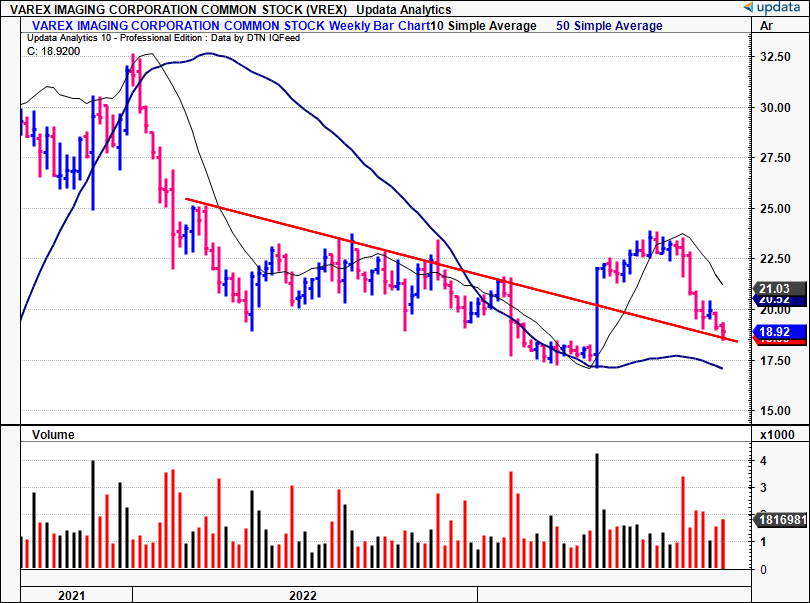
Figure 1. VREX collapses off highs in continuation of longer-term downtrend. Now below 50DMA and 200DMA is tracking lower. No decent bid for >18 months now.
Data: Updata
Critical investment facts to revised hold thesis
1. Macroeconomic backdrop
In 2022, cash on hand for U.S. listed companies was down 11%, marking the most substantial YoY decrease witnessed in the last 40 years. Furthermore, both the S&P 500 cash/asset and cash/equity ratios, previously at record highs in 2021, have plummeted to their lowest levels since the GFC. Consequently, Goldman Sachs Asset Management ( GS ) suspects this decline could slow corporate spending across multiple domains in the coming quarters.
After an 18% surge in 2022, corporate investments from U.S. large caps—measured in CapEx and R&D—are projected to moderate towards 6% growth this year. Likewise, dividend growth is expected to decelerate to 5% in FY'23, following a 9% growth in 20222. The question is, how long these trends will remain in situ.
As for earnings, while corporate earnings have slightly weakened, corporate balance sheets are fortified. The median leverage ratio (net debt/EBITDA) for S&P 500 non-financial companies stands at 1.9x as of August '23, positioning in the 95th percentile over the last 4 decades, but still below the pre-pandemic levels of ~2.0x. GS also opines that servicing debt doesn't pose an immediate threat for many corporations due to prudent decisions made during the "ZIRP" era of historically low rates. For example, the effective interest rate on S&P 500 debt (as reported on the income statements) is merely 3.3%, even with the UST 10-year at 4% and US investment grade at starting yields of 5.5%. Moreover, a significant portion of S&P 500 index's debt won't mature until after 2030, removing the interest rate risk for a number of companies.
It will therefore be a measure of what companies can utilize capital the most efficiently + effectively over the comings years. Investments made by corporations simply must produce cash flows higher than their cost to be considered viable, and my estimate is that stock returns are likely to mimic these factors into FY'25. This discussion is relevant for the analysis on VREX as well.
2. Q3 FY'23 insights—record revenues, NWC tremendously dense
VREX put up another record in quarterly revenue in Q2 and booked $232mm at the top line, up 2% sequentially and 8% YoY. Gross margins were up ~100bps sequentially to 33%, with OpEx of $52mm. It pulled this to adj. EBITDA of $38mm, and earnings of $0.37/share. Management continues to project sales growth between 3%—5% for the full year. VREX's current momentum is in line with these expectations. Looking ahead to Q4, revenue expectations are set at $220mm—$240mm on earnings of $0.20—$0.40/share. A strong OCF print, tallying $38mm for the quarter, was primarily attributed to a $13mm correction in inventory off the balance sheet, and VREX left the quarter with $152mm in cash on hand.
The revenue breakdown by segment was as follows (observed in Figure 2):
- Medical revenues clipped $175mm and the industrial segment did $57mm of business. The industrial business was up 20% YoY and contributed 24% to the top line. On the other hand, medical revenues contributed 76% and grew ~500bps YoY.
- Region-wise, VREX booked an 8% sequential growth in Americas footprint, a 10% increase in EMEA, and a 10% decrease in its APAC business lines. Critically, China still played a significant role for the record Q2 revenues, contributing to 18% of the overall turnover.
BIG Insights
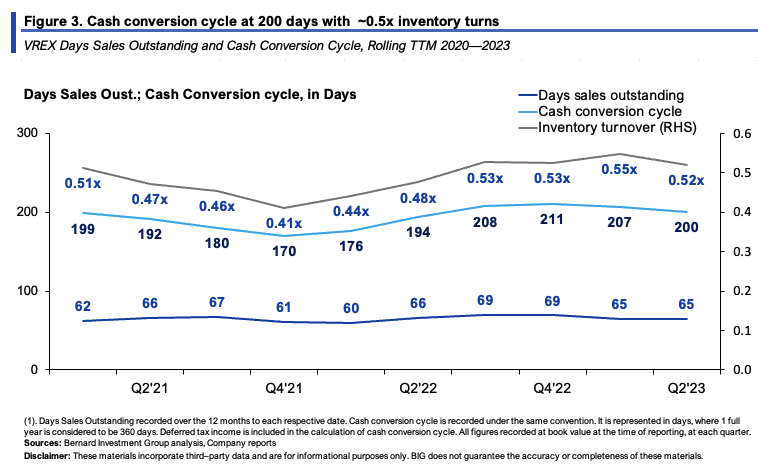
Net working capital ("NWC") density continues to be a challenge I've identified for VREX (discussed in more detail later). In Q3, receivables were up another $3mm on the 8% revenue growth, despite the $13mm inventory decrease. Critically, DSO was steady at 65 days [Figure 3]. On the other hand, there was a reduction of 8 days to days of inventory to 174 days. But the problem, in my view, is that VREX's cash conversion cycle is constantly ~200 days—more than half the year to convert each $1 of working capital through to cash. It left the quarter with ~$480mm tied up in NWC (including cash on hand), more than double the Q2 revenue print which will likely take ~200 days on average to convert to cash flow, plus, for the last 3 years each new $1 in sales has required $0.60 increase in NWC to accommodate top-line growth (see: Figure 6)—a function of (i) the low inventory turns, at 0.5x these past few years, and (ii) the economics of the business model (discussed below).
BIG Insights
3. Analysis of economic performance
A number of critical factors are dealt with in this section. It will examine the firm's economics, and what it needs to reinvest to continue at its current growth rates.
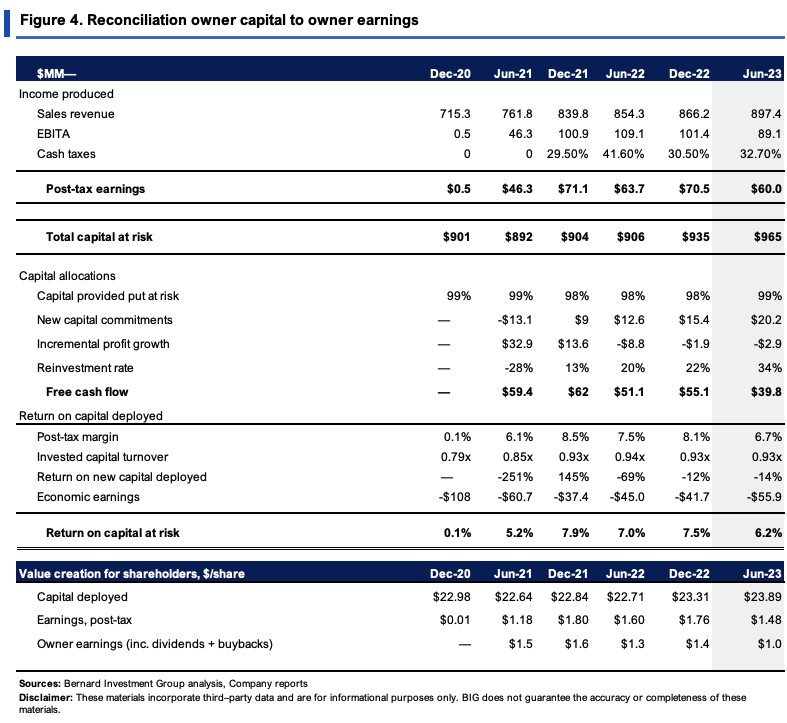
VREX had put $965mm in capital at risk as of Q3, predominantly in working capital. Most of this is in inventories in the current account. The $965mm or $23.90/share produced $1.48/share in post-tax earnings, 6.2% return on investment. We benchmark all companies at a 12% ROIC. So this doesn't meet the requirements.
The culprits are abundantly clear:
- Post-tax margins of 6–8% these past 2 years;
- Capital turnover of <1x, at 0.93x last quarter.
In VREX's business, you'd expect the capital turnover to be >2x to suggest it were creating incremental value. It's products are hard to differentiate (they're not unique components that VREX sells), so it is forced to adopt a cost leadership strategy, pricing its offerings at below industry averages. Problem is, that (i) this clamps after-tax margins even more, and (ii) its inventories are only turned over once every 2 years (0.5x inventory turnover). This squares off with the economics from earlier. Alas, each $1 of its investments brings in just $0.94 in sales and $0.07 in profit after tax.
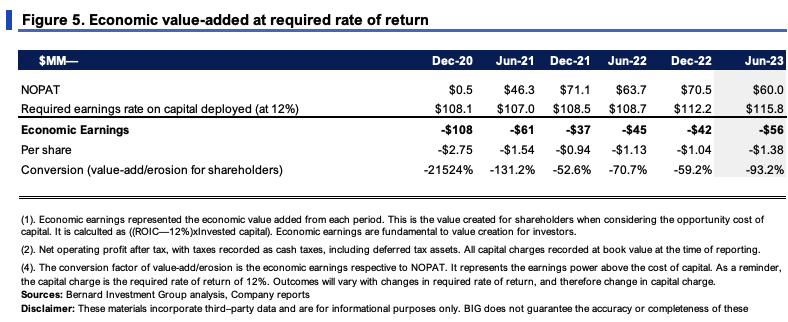
In Figure 5, you can see how far off VREX is in what it needs to produce on capital at a 12% hurdle rate, to what it has been doing in NOPAT. Since 2020, it has produced a cumulative $15.40/share in economic losses. No surprise to see its stock price has repriced lower by $13.60 off 2021 highs.
BIG Insights
BIG Insights
The NWC intensity mentioned earlier is seen in Figure 6. The company's sales have grown at a 2% 3-year geometric rate, with stable average operating margins of 9.2%. But each new $1 of sales required a $0.60 investment to NWC, clearly illustrating where all the profits + cash flows have been going. Not surprising to see VAREX at a 5.6% trailing ROE on this basis.
BIG Insights
Say it wanted to continue growing at these same levels going forward. Q3 FY'23 was a record quarter at the top line, after all. I've kept these assumptions in Figure 7, forecasting out the next 12 months. To continue at its steady state, I'd estimate VAREX to need a c.$60–$75mm net investment (mainly NWC) and to throw off ~$50–$55mm in FCF each period. Still, the rate of return on these investments would be below our 12% threshold, and the ~10% reinvestment rate may compound its intrinsic value at just ~2.3% on average (9.2% over the coming 12 months).
That's presuming a 2% sales growth rate. At 3%, the reinvestment rate is ~40%, no change to the rate on capital, and a lower FCF of $51mm. At 4%, it's only ~$46mm in FCF. This is clear illustration of how growth can be destructive to value if capital productivity isn't meeting its benchmarks. If the ROIC was at 15%, VREX's trailing FCF could be $125–$130mm by FY'24, using the same stipulations as in Figure 6 (2% sales growth etc.).
BIG Insights
Valuation and conclusion
From the points so far, my estimate is the market has correctly priced VREX at compressed multiples of 11x forward EBIT and 1.4x book value. The capital it has deployed isn't achieving a high rate of return, so there's no premium on these assets employed into VREX. It sells at an EV/IC of 1.14x, and even this looks richly priced based on 1) the numbers to date, and 2) what VREX's numbers would look like if it continues at this pace.
BIG Insights
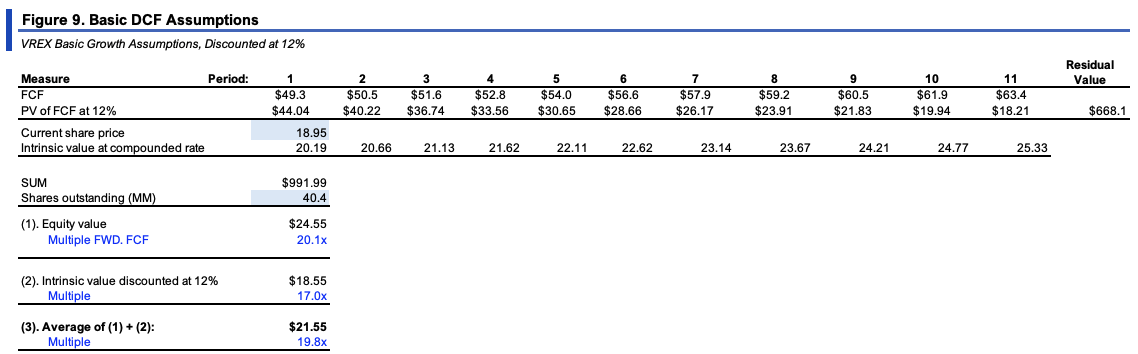
Projecting the steady-state numbers out to FY'28 and discounting back to 12% gets you to $24 in equity value. Whilst compounding, its stock price at the ROIC and reinvestment rate multiplier gets you to $18.55/share. The average of both is $21/share, roughly in line with where VREX sells today. To me, this supports a neutral rating.
Source: BIG Insights
Another extensive analysis of VREX reveals a similar thematic: It isn't hitting key benchmarks in the rate of profits on capital, meaning the compounding effect to intrinsic value is absent. Despite the commendable sales performance this YTD, this hasn't transposed over to shareholder value. It's simply not attractive economics, and the question of opportunity cost immediately presents itself. Is VREX the best investment over the next best alternative right now? Definitely not in my opinion, and it looks fairly priced at ~$18-$20 based on the factors outlined here. Net-net, reiterate hold.
For further details see:
Varex Imaging: Record Q2 Sales Don't Change The Economic Headwinds, Or The Thesis