XLE - VDE: The Next Leg Of Outperformance Is Overdue
2023-08-16 05:18:04 ET
Summary
- The recent underperformance of the Vanguard Energy ETF versus the market has come despite continued outperformance in sales, earnings, and dividends.
- The MSCI Energy index is just 4% of the MSCI USA's market cap, yet makes up at least 10% of sales, earnings, and dividends.
- Energy companies have shifted focus towards shareholder returns, resulting in a higher free cash flow yield and dividend yield.
- Strong balance sheets suggest the sector can meet any future capital requirements without the need to cut dividends or raise equity.
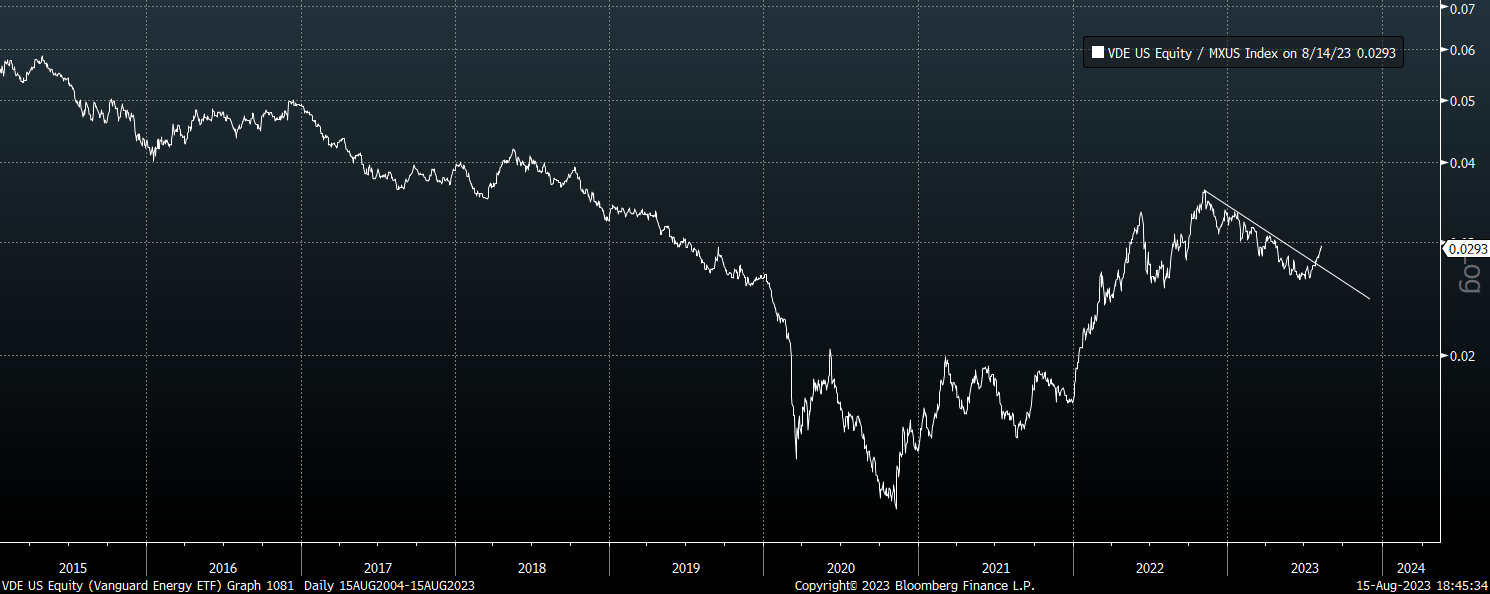
I argued in January that the energy sector's valuation discount to the broader market had declined substantially, suggesting the easy gains for the Vanguard Energy ETF (VDE) were behind us. The underperformance since then despite rising oil prices suggests VDE is due another period of outperformance. The valuation discount is back to extremes and oil majors continue to prioritize shareholder returns relative capital expenditure in contrast to the past.
The VDE ETF
The VDE seeks to track the performance of MSCI US Investible Market Energy Index. The VDE is slightly more diversified than the larger Energy Select Sector SPDR ETF (XLE), which tracks the S&P 500 Energy Sector. The two largest companies, Exxon Mobil (XOM) and Chevron (CVX), comprise 35% of the index versus 40% for the XLE. The dominance of these two stocks has declined over the course of the post-Covid rally as smaller stocks have seen even more rapid gains. The expense ratio for the VDE is minimal at 0.03%, versus 0.1% for the XLE, while the dividend yield is the same at 3.6%.
Valuation Discount Back At Record Levels
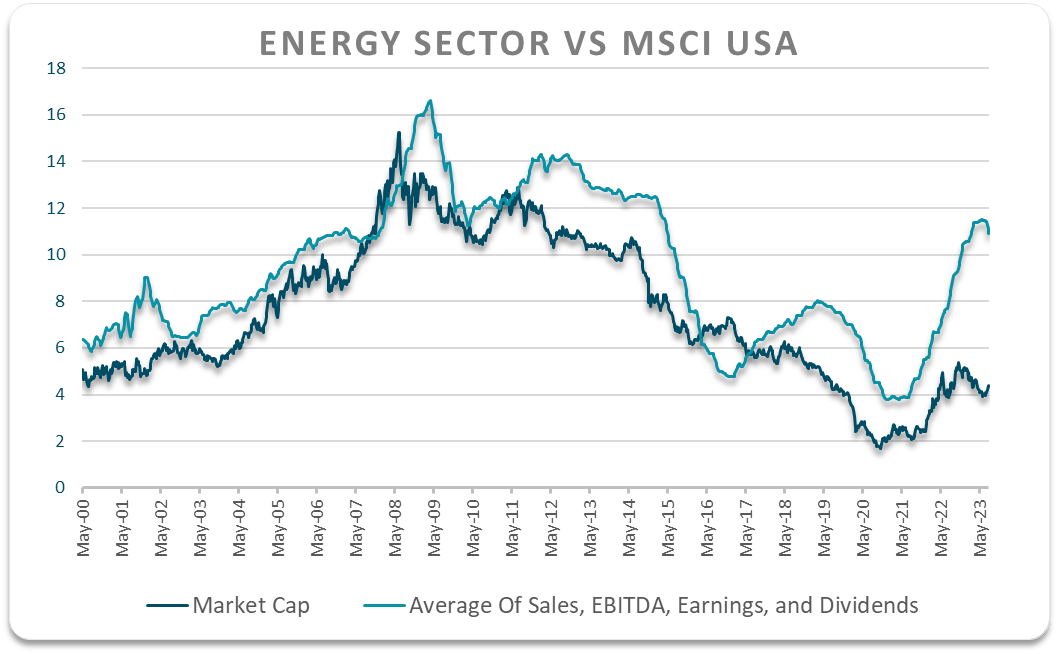
On a trailing basis the MSCI Energy index once again trades at extremely undervalued levels. While its market capitalization is just over 4% of the MSCI USA, its sales, EBITDA, earnings, and dividends are all at least 10% of the MSCI USA total. The chart below shows the ratio of the MSCI Energy market cap versus the market alongside the average of the above fundamentals. The Energy index now trades at a near-record 60% below its fair value on this measure, compared to a long-term average of 20% going back to 2003.
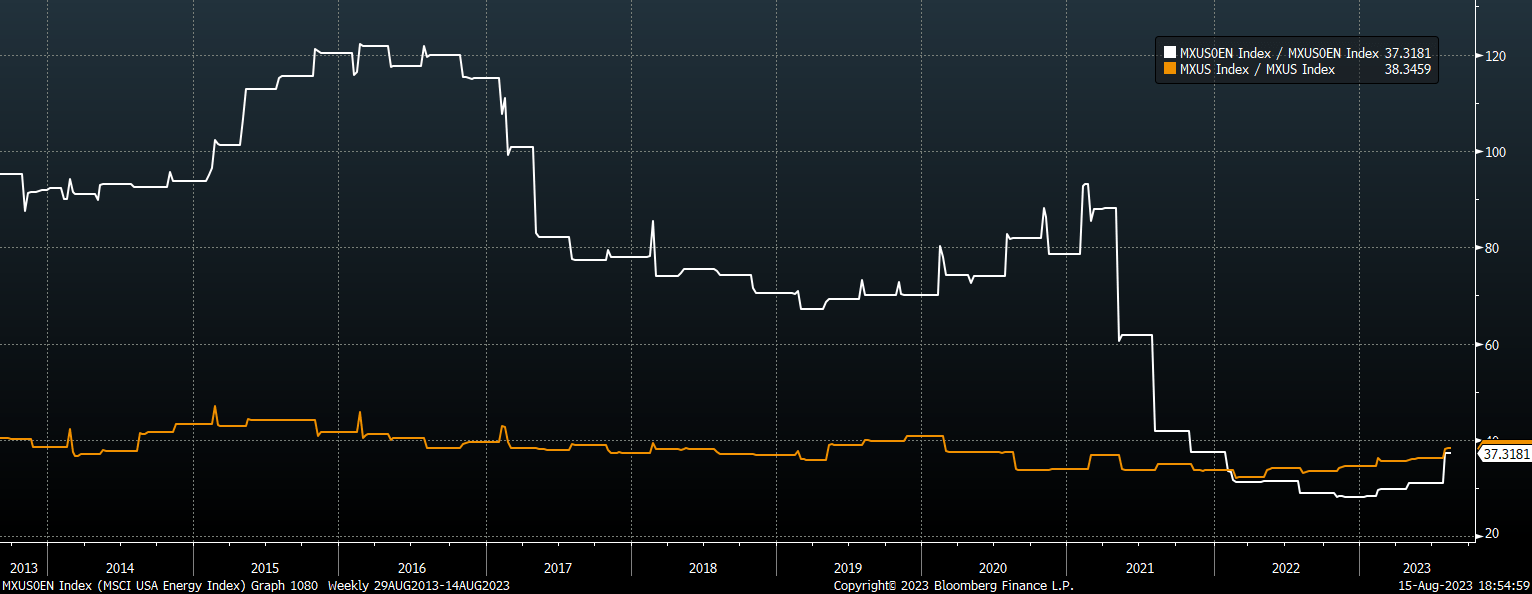
The MSCI US Energy index has tended to trade at a discount to the broader market in terms of sales, EBITDA, earnings, and dividends, because of its heavy capital requirements that eat into free cash flows. However, over recent years energy sector capex has collapsed as a share of sales and operating cash flows and is now on a par with the overall market. While the flood of capital into the technology sector has allowed capex to surge at the expense of free cash flows, energy companies have been forced to shift their focus towards shareholder returns, a trend amplified by ESG considerations. As a result, the MSCI Energy index now has a free cash flow yield of 10%, almost 3x higher than the MSCI USA, and this is reflected in its dividend yield of 3.6%.
Capex To Operating Cash Flow Ratio. MSCI USA and MSCI USA Energy (Bloomberg)
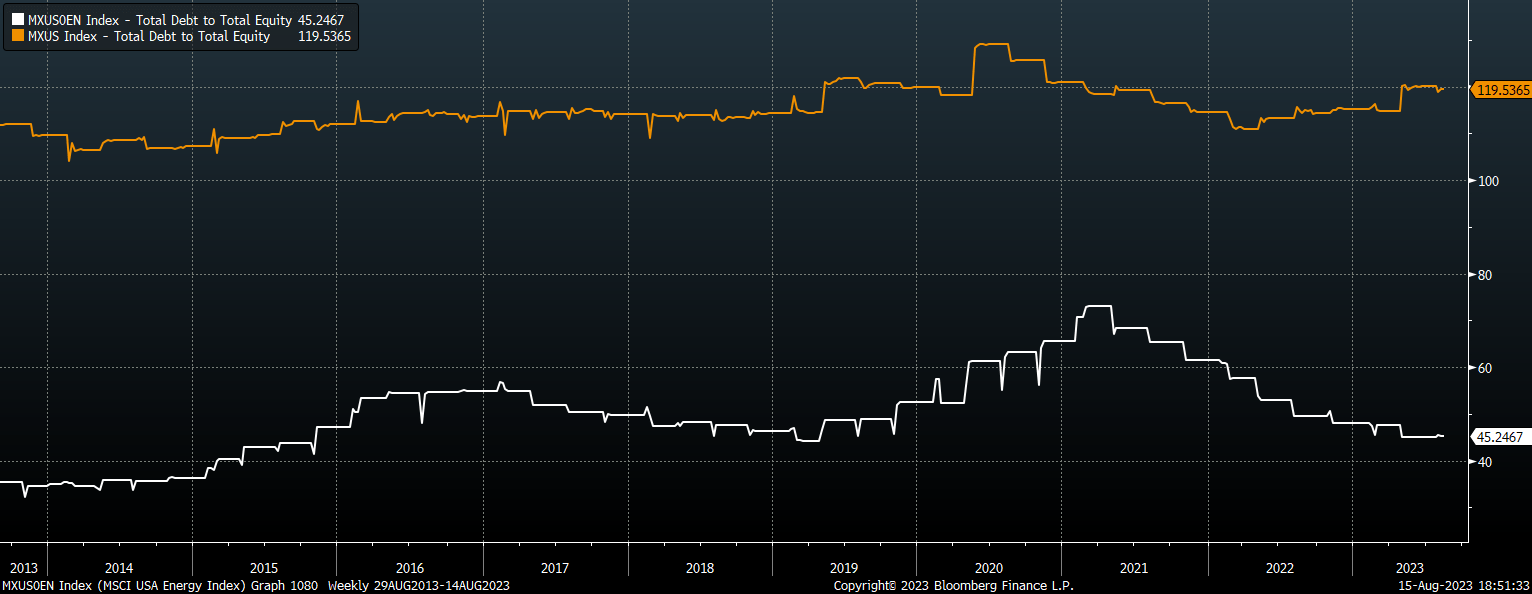
Capital requirements may have to rise over the coming years to allow sales volumes to rise, but unlike in the case of most other industries where low capex risks hurting future sales, the inelasticity of demand for oil means that low levels of investment drive up oil prices. At current oil prices, the industry is very well placed to fund any increased spending without having to resort to dividend cuts, capital raising, or renewed debt issuance. Strong free cash flow growth has allowed the energy sector to pare down debt and raise cash. The debt-to-equity ratio for the MSCI Energy index is just 45% compared with 100% for the SPX Ex-Financials index. Even more impressive has been the rise in the current ratio, which is now close to record highs as 1.4x compared to 1.2x for the SPX Ex-Financials.
Debt To Equity Ratio. MSCI USA and MSCI USA Energy (Bloomberg)
Summary
The recent underperformance in the MSCI Energy index has seen its valuation discount relative to the broader market rise to new extremes, with its market cap of 4% of the market far below its 10%+ share of sales, EBITDA, earnings, and dividends. Low capital spending has allowed free cash flows to surge and resulted in balance sheet improvements, meaning the sector is well placed to fund any future capex spending needs without the risk of dividend cuts or share dilution. The VDE therefore looks likely to embark on a new leg higher relative to the broader market.
For further details see:
VDE: The Next Leg Of Outperformance Is Overdue