VEA - VEA ETF: The Headwinds Trump The Tailwinds
2023-10-24 14:39:39 ET
Summary
- We juxtapose VEA against its largest developed market peer-IEFA.
- We pick out a couple of themes that could weigh on VEA's performance.
- We close with some thoughts on the valuations and the technicals.
VEA vs. IEFA
Investors on the lookout for developed market exposure beyond the US may consider looking at the Vanguard FTSE Developed Markets Index Fund ETF ( VEA ) which is the largest developed markets ETF offering around with $118bn in total AUM. VEA is often measured against the iShares Core MSCI EAFE ETF ( IEFA ) another large developed market ETF with $102bn in AUM.
In fairness, there's not an awful lot to choose between the structural qualities of these two ETFs. Both products are exceptionally cost-efficient (expense ratio of 0.05% for VEA vs. 0.07% for IEFA), and they also offer a healthy degree of stability as exemplified by the exceptionally low annual turnover ratios (4% for VEA and 3% for IEFA). Where VEA may come across as more enticing is perhaps the income angle. Currently, our focus ETF not only offers a better yield of 3.31% (around +70bps better than IEFA), but note that the current yield is also 40bps better than its 4-year average yield That's not something IEFA can currently boast of with its current yield lagging its historical average by roughly 40bps.
Then, both ETFs spread their tentacles over a mammoth pool of securities, but VEA offers greater coverage, touching over 4,000 stocks (IEFA covers less than 3,000 stocks). This is primarily because VEA even offers exposure to Canadian equities, whereas IEFA shuns that particular landscape.
Seeking Alpha
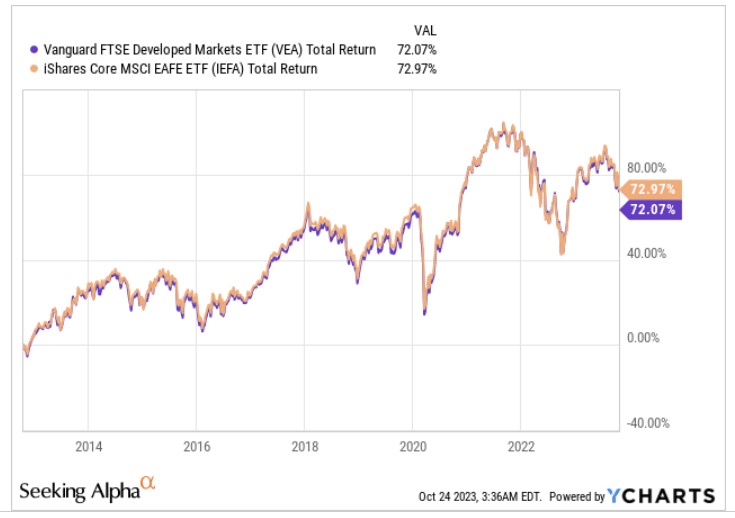
So, has this made a massive difference in the relative return profiles or the relative volatility profiles? Hardly. Since IEFA's inception in Q4-2012, IEFA came to the bourses over five years after VEA, both products have delivered identical returns of 72-73%
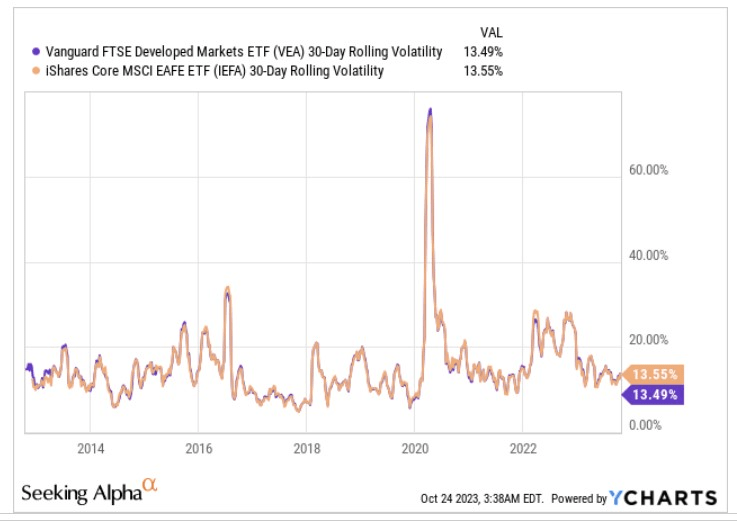
Besides, consider that the respective rolling volatility profiles of these two products are also almost identical.
Notable Factors That Could Weigh on VEA's Future Performance
It is questionable if developed markets ((DM)) are the most appropriate place to be exposed to at this juncture.
Firstly, according to the IMF's latest economic outlook released earlier this month , emerging markets ((EM)) look poised to deliver steady GDP growth of 4% two years on the trot (this year and in FY24), but when it comes to DMs, after likely delivering 1.5% growth this year, real GDP growth could slow to 1.4% next year.
Then, within this broadly developed market pack, VEA's largest exposure by country is towards Japan (22% of total holdings). So far, Japanese stocks have benefitted from a number of tailwinds, but one wonders if the rubber band has been stretched too far.
We can certainly appreciate the noise around better corporate governance standards there, but ultimately investors shouldn't dismiss the role of the ultra-loose monetary policies. Those policies have wreaked havoc on the Yen, but it has also helped boost the competitiveness of Japanese exports (one of the top 5 exporters in the world) in the global market.
Now recent reports suggest that inflation forecasts for the year will be scaled up from previous levels of 2.5% to 3%. This would put it above the BOJ's 2% inflation target for the second straight year. Also consider that Japan's largest labor organization is currently pushing for a 5% pay hike, raising the upside risks to wage inflation. All in all, we feel that the BOJ is not far away from doing away with these loose policies and when the pivot takes place, the euphoria around Japanese equities will likely ebb.
Another important sub-plot to consider is VEA's top sector exposure - the financial sector (one-fifth of all holdings). There are similarities with the Japanese angle, in that, this is a sector that is doing relatively well globally, but things could soon turn awry.
Data from McKinsey shows that over the last 12-18 months, this sector has benefitted from a pivot in the broad interest rate regime, which has eventually contributed to these banks hitting the highest thresholds of ROE for well over a decade.
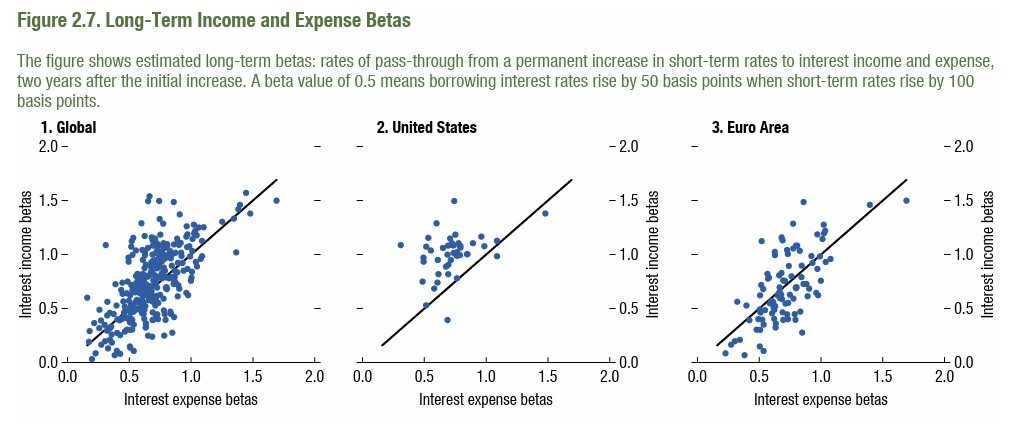
However, investors need to now consider the lagging risks that come with the "higher-for-longer" rate environment. The IMF recently came out with a study highlighting how global banks, particularly in advanced economies outside the US, notably from Europe (stocks from across Europe account for 54% of the VEA's portfolio) could take a 40% hit in their net interest income ((NII)) profile, as the interest rate impact on the expense side, will leave a more prominent mark than the interest income. Essentially, banks with lower interest income betas and higher interest expense betas stand to lose in a higher for longer environment (the image below highlights how European banks are poorly positioned)
Closing Thoughts - Technical and Valuation Commentary
Even if one were to gauge VEA from the technical and valuation viewpoints, it's hard to get too excited about this product at this stage.
As per Morningstar data, both VEA, and the flagship emerging markets ETF -iShares MSCI Emerging Markets ETF ( EEM ) will likely deliver a similar cadence of long-term earnings growth of a little less than 10% , yet VEA is priced at a 5% premium ( 12.1x ) when it comes to the respective forward P/Es.
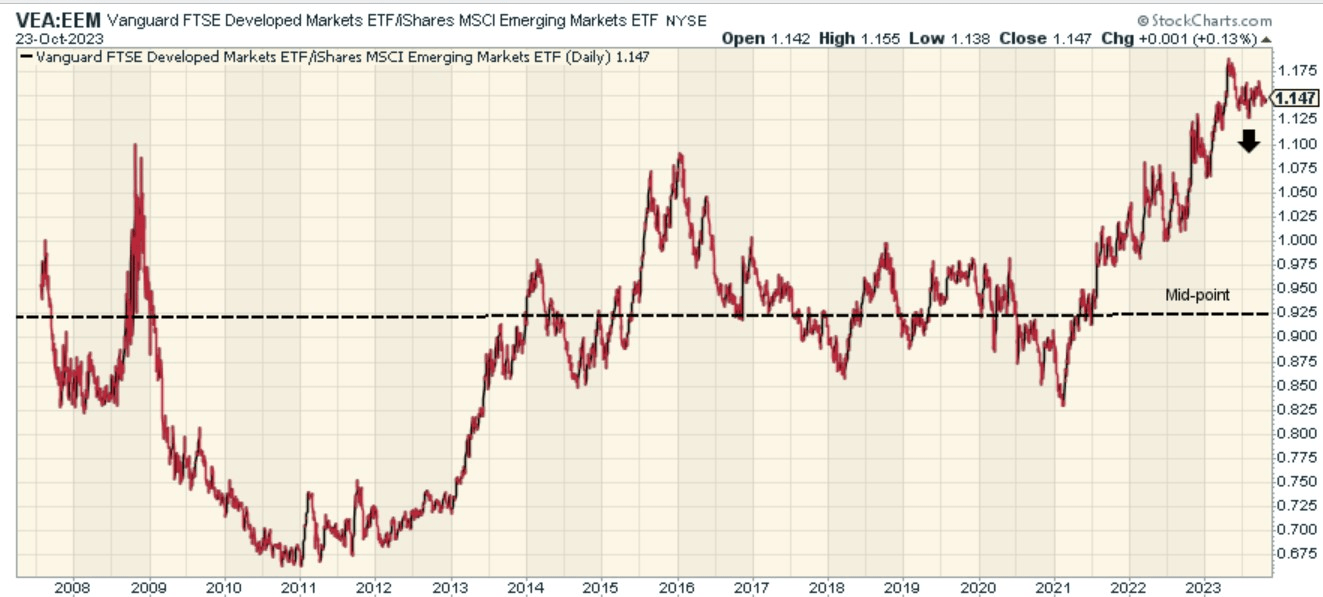
Admittedly, that valuation differential may not necessarily be a huge deal-breaker for all interested parties, but consider the chart below which measures the relative strength of developed market equities and emerging market equities across various cycles. Yes, the heightened level of the current ratio reflects well on VEA's current popularity, but we are big on the theme of mean-reversion in the markets, and feel that you should be buying into a product when the relative strength ratio is at lowly levels, and exit when it is at around peak levels like it is now.
Even if you don't expect this ratio to drop to the lower end of the chart anytime soon, there's certainly a case to be made that it looks quite overbought as it is trading around 24% off the mid-point of the long-term range.
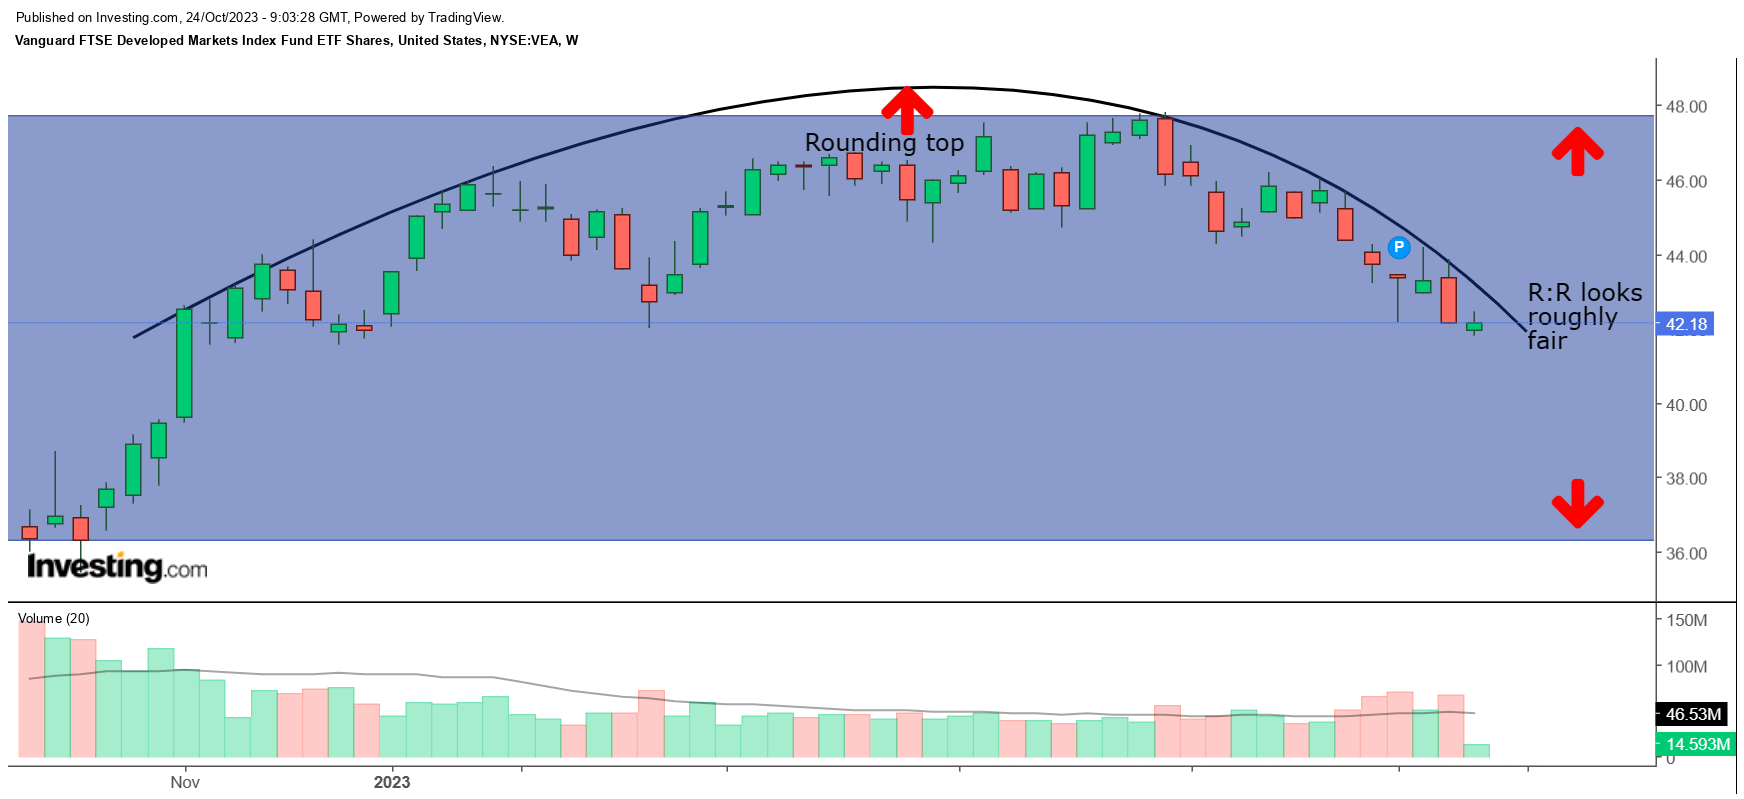
On VEA's standalone weekly chart, we can see that after a decent uptrend from the lows of September 2022, the ETF has failed to push on beyond the $48 levels, and has rather ended up forming a rounding top pattern which typically points to reversals ahead.
Also, the risk-reward within the broad trading range (highlighted in blue) is roughly fair (as the distance between the current price and the upper and lower boundaries of the range are roughly equal). It would be preferable to buy in when the price is closer to the lower boundary. VEA is a HOLD for now.
For further details see:
VEA ETF: The Headwinds Trump The Tailwinds