VECO - Veeco Instruments May Need To Find Support Again If It Is To Rebound
2023-04-20 04:57:25 ET
Summary
- The stock has been sliding for a while and the decline accelerated after the stock broke the uptrend that was in place for six months.
- The stock had been trending higher since last October, but the reversal seems to have been triggered by the most recent earnings report.
- VECO is worth considering for a couple of reasons, including an earnings rebound and multiples that are very fair, especially in today’s market.
- While VECO looks better in the long run, it is better in the short term to stay on the prudent side with the stock most likely heading lower.
Veeco Instruments ( VECO ), a supplier of semiconductor process equipment, was off to a good start in 2023. However, that has changed, certainly in recent weeks. The stock started its decline after the Q4 report, which accelerated after the stock broke through support. The stock is close to losing all its 2023 gains and the bottom may not yet be near. Why will be covered next. Read my previous coverage on VECO here and here .
VECO may be looking for support after losing it
Most semiconductor stocks have done very well in 2023. For instance, the iShares PHLX Semiconductor ETF ( SOXX ) has gained 22.1% YTD, way more than the 8.3% YTD gain for the SPDR S&P 500 ETF ( SPY ). But not all semis have done as well. VECO stock, for instance, is among the exceptions who have lagged behind with a gain of 2.9% YTD.
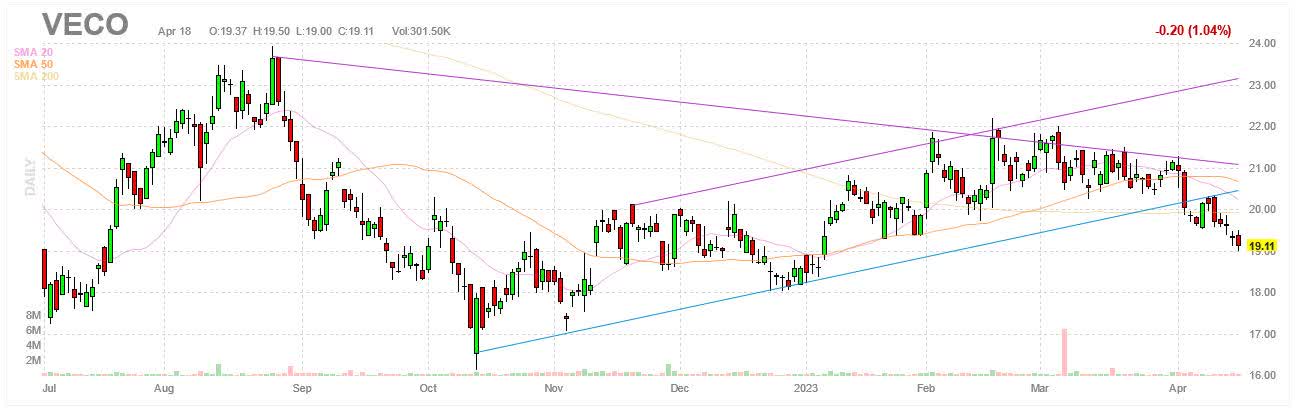
However, it wasn’t always that way as shown in the chart below. The stock hit an intraday and 2023 high of $22.19 on February 16, giving VECO a gain of 19.4% for the year at that point. The stock had by then rallied for months with an uptrend that started after the stock hit a 52-weeks lows on October 13 at $16.11. But that was as good as it got. The stock proceeded to enter a gradual decline from which it has yet to recover from.
Furthermore, it’s worth mentioning that the decline in the stock seems to have been helped along by a rise in short interest. Short interest stood at 4.36M on February 15, but it rose to 5.20M on March 31 according to the latest data from the Nasdaq, an increase of 19.3% in about six weeks. This translates to a short float of 10.4%.
The decline in recent weeks has pushed the stock below a key support level that had previously enabled the uptrend. Note how on April 4 the stock closed below the lower ascending trendline that had been in place starting on October 13. The stock then tried to make its way back above support in the following days, only to find out that what used to be support has now become resistance. The stock was unable to get back above support after several tries and the decline accelerated once this became clear.
The stock may be due for a bounce since it is getting close to oversold territory with an RSI just above 30. Still, the current setup is leaning bearish. The uptrend has been broken. The stock has lost support and resistance is now in its place. The stock is fading and if that is to end the stock may have to find a new support level, which may require the stock to get back to the lows in mid-October. After all, if the stock was able to find support there once before, it may be able to do so again.
If this happens, the stock will have completed a 100% retracement of the uptrend that started in October. A retest and a successful defense of the October lows could pave the way for the stock to start another uptrend. Still, the stock will have to keep declining in the short term before it gets to a position to do the above.
Why sentiment shifted after the most recent report from VECO
The stock kept climbing until February 16 and then started to decline, which suggests that something changed that day. Ditto for the rise in short interest, which started after the 15 th . It’s therefore worth mentioning that VECO released its Q4 and FY2022 report after the market closed on February 15. It’s also worth mentioning that Q1 guidance from VECO fell way short of expectations that day.
Expectations were for non-GAAP EPS of $0.27 on revenue of $159M, but Q1 guidance surprised with non-GAAP EPS of $0.20 on revenue of $140M at the midpoint as shown below. Consensus estimates have been dialed back as a result and are now calling for GAAP EPS of $0.08 and non-GAAP EPS of $0.20 on revenue of $142M in Q1 FY2023.
| Q1 FY2023 (guidance) |
| Q1 FY2022 |
| YoY (midpoint) |
| Revenue |
| $130-150M |
| $156.4M |
| (10.49%) |
| GAAP EPS |
| ($0.03)-$0.16 |
| $0.24 |
| (72.92%) |
| Non-GAAP EPS |
| $0.12-0.28 |
| $0.38 |
| (47.37%) |
Source: VECO Form 8-K
The Q1 numbers are quite the drop compared to recent quarters. The table below shows the numbers in the preceding quarters. For instance, VECO posted non-GAAP EPS of $0.45 on revenue of $171.9M as recently as Q3 FY2022. Note that GAAP income of $128.9M or $2.00 per share in Q4 FY2022 was made possible by a $117M tax benefit.
| (Unit: $1000, except for EPS) |
| (GAAP) |
| Q4 FY2022 |
| Q3 FY2022 |
| Q4 FY2021 |
| QoQ |
| YoY |
| Revenue |
| 153,799 |
| 171,913 |
| 152,972 |
| (10.54%) |
| 0.54% |
| Gross margin |
| 40.9% |
| 40.7% |
| 41.9% |
| 20bps |
| (100bps) |
| Operating income |
| 13,392 |
| 17,654 |
| 17,626 |
| (24.14%) |
| (24.02%) |
| Net income |
| 128,915 |
| 15,041 |
| 8,204 |
| 757.09% |
| 1471.37% |
| EPS |
| 2.00 |
| 0.27 |
| 0.15 |
| 640.74% |
| 1233.33% |
| (Non-GAAP) |
| Revenue |
| 153,799 |
| 171,913 |
| 152,972 |
| (10.54%) |
| 0.54% |
| Gross margin |
| 42.3% |
| 42.0% |
| 42.4% |
| 30bps |
| (10bps) |
| Operating income |
| 23,754 |
| 28,362 |
| 24,886 |
| (16.25%) |
| (4.55%) |
| Net income |
| 21,891 |
| 26,008 |
| 22,642 |
| (15.83%) |
| (3.32%) |
| EPS |
| 0.38 |
| 0.45 |
| 0.43 |
| (15.56%) |
| (11.63%) |
However, the quarterly numbers are expected to recover with Q1 seen as the trough and a stronger second half than the first half. Keep in mind that VECO ended FY2022 with a backlog of $500M, which gives VECO a certain measure of confidence in its outlook for FY2023. From the Q4 earnings call:
“Now, turning to Q1 guidance. In the current weaker demand environment, customers across certain segments of our business have lowered fab utilization to address elevated levels of inventory.
In some cases, they've taken steps to reduce both capital and operating expenses, including spare parts and service. Taking this into account, Q1 revenue is expected to be between $130 million and $150 million.
We expect the following non-GAAP financial metrics for Q1. Gross margin between 39% and 41%. OpEx between $42 million and $44 million, net income between $6 million and $15 million. EPS between $0.12 and $0.28 per diluted share.
And now for some additional color beyond Q1. Based on our current visibility supported by our backlog, our revenue outlook for 2023, as previously disclosed, remains between $630 million and $670 million. We expect revenue in the second half of the year to exceed revenue in the first half based upon the scheduled shipments of our backlog.
And we continue to target diluted non-GAAP EPS for the full year to be between $1.15 and $1.35 per share, which includes the increased tax provisions going forward as a result of the valuation allowance reversal in the fourth quarter of 2022.”
A transcript of the Q4 FY2022 earnings call can be found here .
VECO is aiming at non-GAAP EPS of $1.15-1.35 on revenue of $630-670M by the time FY2023 is over. In comparison, VECO earned $1.57 on revenue of $646.1M in FY2022 and $1.43 on revenue of $583.3M in FY2021 as shown in the table below. Accordingly, estimates predict non-GAAP EPS of $1.14-1.25 on revenue of $650-656M in FY2023 and non-GAAP EPS of $1.25-1.65 on revenue of $675-765M in FY2024.
| (Unit: $1000, except for EPS) |
| (GAAP) |
| FY2022 |
| FY2021 |
| YoY |
| Revenue |
| 646,137 |
| 583,277 |
| 10.78% |
| Gross margin |
| 40.7% |
| 41.5% |
| (80bps) |
| Operating income |
| 60,296 |
| 56,710 |
| 6.32% |
| Net income |
| 166,942 |
| 26,038 |
| 541.15% |
| EPS |
| 2.71 |
| 0.49 |
| 453.06% |
| (Non-GAAP) |
| Revenue |
| 646,137 |
| 583,277 |
| 10.78% |
| Gross margin |
| 41.9% |
| 42.0% |
| (10bps) |
| Operating income |
| 99,820 |
| 86,605 |
| 15.26% |
| Net income |
| 89,575 |
| 73,649 |
| 21.62% |
| EPS |
| 1.57 |
| 1.43 |
| 9.79% |
Source: VECO Form 10-K
Why VECO is worth considering
While there is reason to be wary of VECO in the short term with the stock in decline, there are reasons to keep track of VECO, especially with an eye towards the long term. As shown previously, while earnings are projected to dip in the short term, they are expected to gradually recover as FY2023 goes by and into FY2024.
| VECO |
| Sector median |
| Market cap |
| $997.58M |
| - |
| Enterprise value |
| $1.01B |
| - |
| Revenue ("ttm") |
| $646.1M |
| - |
| EBITDA |
| $86.9M |
| - |
| Trailing non-GAAP P/E |
| 12.38 |
| 18.23 |
| Forward non-GAAP P/E |
| 15.92 |
| 20.16 |
| Trailing GAAP P/E |
| 7.13 |
| 22.74 |
| Forward GAAP P/E |
| 28.82 |
| 25.10 |
| PEG GAAP |
| 0.02 |
| 0.62 |
| P/S |
| 1.49 |
| 2.87 |
| P/B |
| 1.73 |
| 2.90 |
| EV/sales |
| 1.56 |
| 2.89 |
| Trailing EV/EBITDA |
| 11.58 |
| 14.16 |
| Forward EV/EBITDA |
| 10.64 |
| 13.65 |
Source: Seeking Alpha
In addition, VECO is fairly priced. The table above shows how VECO trades at multiples that are mostly in line with or below the sector median. Note that while a P/E ratio of 7.13 seems low, it’s worth reminding that it is primarily the result of VECO posting GAAP net income of $166.9M or $2.71 per share in the last 12 months, which was in turn assisted by the $117M tax benefit mentioned earlier.
Investor takeaways
VECO is worth considering if one is in it for the long haul with multiples where they are, but I am neutral on VECO for now. The stock has been in decline ever since guidance came in below expectations and the stock has yet to hit bottom. If anything, the decline got a new push after the stock fell below a support level that marked the lower boundary of the uptrend that started in October of last year.
There is reason to believe lower stock prices are possible. And if the rise in short interest is any indication, there are a growing number of people out there who share this belief and are placing bets accordingly. The more people are selling short, the more pressure is put on the price of the stock.
What used to be support has turned into resistance. With the stock close to resistance and no support nearby, the path of least resistance is for the stock to head lower in search of support. The stock could be going for a retest of the October lows to see if support is still there. The stock was able to recover at that level, so there is a good chance the stock might be able to do it again. Bulls may want to consider waiting for the stock to stabilize before getting in.
Bottom line, there may come a better time for long VECO down the line, but for now, those going long VECO at this time run the risk of getting burned with the stock falling down. If the stock finds support once more, probably at the October lows, it may be time to reassess. For now, the stock has ways to go before it gets there. The prudent move is to not rush in to catch a falling knife. Better to wait and let the dust settle first.
For further details see:
Veeco Instruments May Need To Find Support Again If It Is To Rebound