VECO - Veeco Instruments: Support Is Near Even Though The Uptrend Is No More
2023-09-27 02:30:20 ET
Summary
- Veeco Instruments stock has faded in recent weeks after breaking the uptrend that lasted months, but support may now be close at hand.
- A look at the charts shows a number of interesting things, which could give clues to decide what to do next.
- There are a number of arguments in favor of long VECO, but a look under the hood reveals an issue that could spoil the party.
- Long VECO is worth considering, as long as one is aware that the recent headline numbers may not be telling the whole story.
Veeco Instruments ( VECO ), a supplier of semiconductor process equipment, is coming off a powerful rally. VECO still retains most of the gains from the recent rally, which erased the losses from earlier in the year, but the stock has broken the uptrend that was in place for about four months. On the other hand, the factors that enabled the recent rally remain, which suggests a resumption of the rally cannot be ruled out, especially if support is close by. However, there may be a couple of reasons why the stock may find it difficult to break the recent highs, which could help explain why shorts remain interested in VECO. Why will be covered next?
The uptrend is broken
A previous article rated VECO a hold even though VECO was in the midst of a powerful rally for several reasons, including much higher-than-normal sales in China that raised a number of unanswered questions. It suggested, for instance, the rebound in demand, which had contributed to the turnaround in the stock, might not entirely be due to an increase in real demand.
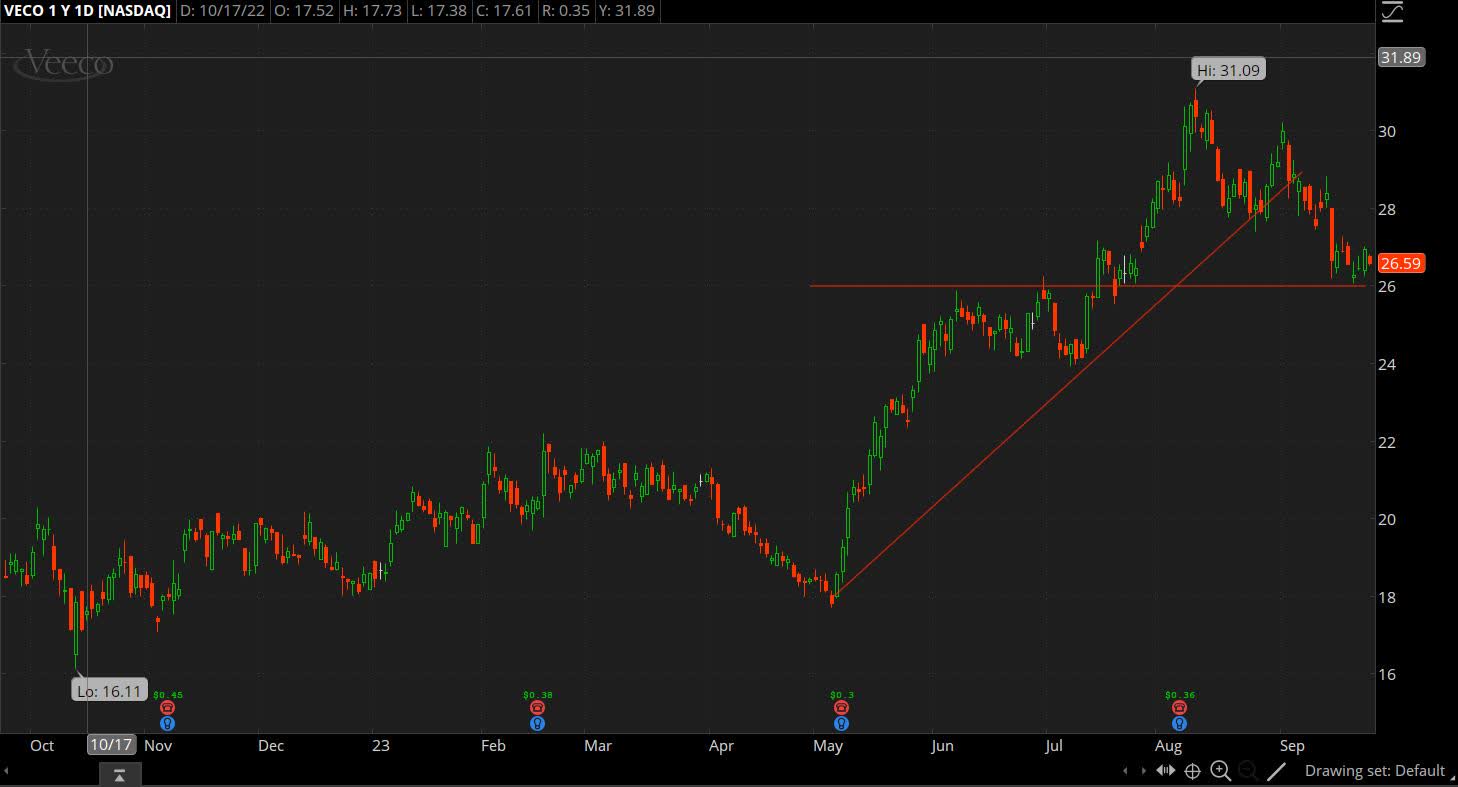
Nevertheless, the stocks went on to set a new 2023 and 52-week high of $31.09 on August 10, but the stock gradually declined in the following weeks. In doing so, the stock has broken the uptrend that was in place since the start of the rally in early May, shortly after the Q1 report came in much better than expected. The chart below shows how the stock broke the trend as defined by the lower ascending trendline.
However, note how the stock seemed to have found its footing in the past few days. The decline has stopped with the stock seemingly unable to breach $26 or so. This may not be by accident. If we look at the uptrend, starting with the May 4 low of $17.70 and ending with the August 10 high of $31.09, then the 38.2% Fibonacci retracement of this uptrend is at $25.98.
In other words, the reason why the recent decline in the stock has come to an end is because the stock seems to have found support. Note also how the stock had trouble getting past $26 or so in June, an indication of resistance. What was resistance tends to become support once breached and this is what seems to have happened.
Why long VECO could be worth considering and why not
The stock seems to have found support. If anyone was looking to get in on VECO but was unable to do so during the recent rally, then now may be a good time with the stock having pulled back and the stock close to support, which makes for a solid entry point. It helps that VECO trades at multiples that are roughly in line with the sector. The table below shows some of the more commonly used multiples for VECO.
| VECO |
| Sector median |
| Market cap |
| $1.49B |
| - |
| Enterprise value |
| $1.51B |
| - |
| Revenue ("ttm") |
| $640.9M |
| - |
| EBITDA |
| $81.2M |
| - |
| Trailing non-GAAP P/E |
| 17.75 |
| 18.93 |
| Forward non-GAAP P/E |
| 18.50 |
| 22.09 |
| Trailing GAAP P/E |
| 21.59 |
| 25.02 |
| Forward GAAP P/E |
| N/A |
| 25.12 |
| PEG GAAP |
| 0.35 |
| 0.81 |
| P/S |
| 2.10 |
| 2.64 |
| P/B |
| 2.43 |
| 2.83 |
| EV/sales |
| 2.36 |
| 2.65 |
| Trailing EV/EBITDA |
| 18.66 |
| 14.53 |
| Forward EV/EBITDA |
| 13.51 |
| 13.92 |
Source: Seeking Alpha
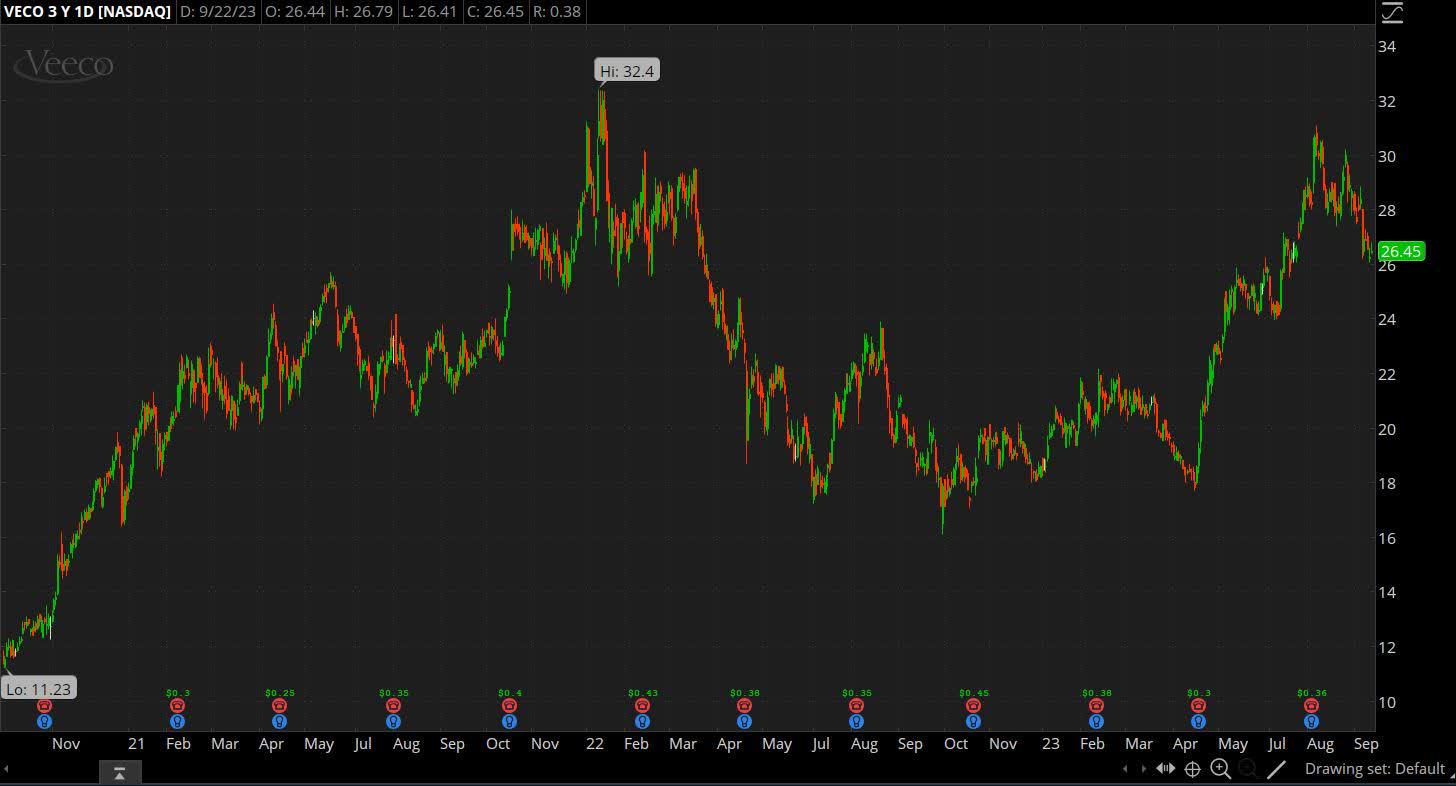
VECO may also be trading below fair value, even if fair value is a subjective term. As mentioned earlier, the stock peaked at $31.09 in the recent tally. This is close to where the stock had another rally snuffed out in early 2022 as shown in the chart below. It's possible this may simply be a coincidence, but it's also possible the reason why the stock topped out at roughly the same price level is because of the presence of resistance. This could explain why the stock had trouble going higher.
Earnings have improved in recent years and that is expected to continue in the coming years. For instance, in a recent presentation, VECO projects served addressable market or SAM will grow from $2.3B in 2023 to $4B in 2027, a CAGR of about 14%. In its target model, VECO aims for revenue of at least $800M, gross margin of about 45% and operating margin of about 20%, both in terms of non-GAAP.
In comparison, revenue was $646.1M, gross margin was 41.9% and operating margin was 15.4% in FY2022. If we assume VECO grows non-GAAP earnings at around 22% per year on average, then fair value is around $32-33 with TTM EPS of $1.49. This could help explain why the stock peaked at $31.09 in August 2023 and at $32.40 in January 2022. Any higher and the stock could be trading above fair value.
Why the rally could resume and why not
The above could be the reason why the stock has faded after peaking at $31.09. Still, VECO remains most of the gains from the recent rally, being up 42.4% YTD after being down for the year before the stock took off in early May. However, it's also worth mentioning that shorts have stuck to their positions even though the stock managed to gain an impressive 75.6% from the May low of $17.70 to the August high of $31.09. According to the most recent data from the Nasdaq, short interest for VECO stood at 5,606K shares on August 31. This translates to a short float of 10.2%.
The data suggests the shorts have not lost confidence even though VECO has done much better in recent months compared to earlier in the year. While it is not possible to know the reasoning used by each individual short, one possible reason is that the shorts do not believe the recent improvement in quarterly earnings will be sustained.
As mentioned earlier, the Q1 report helped trigger the rally in May with earnings that were much better than expected. In addition, VECO is a supplier of equipment needed for EUV masks, which are expected to benefit from AI due to the need for HPC. It's no coincidence that when record results from Nvidia ( NVDA ) triggered a rally in the semiconductor sector in May, VECO was among the stocks to benefit.
This has not changed, which is why some may argue the stock could resume the rally. Furthermore, while the quarterly numbers have dipped this year compared to last year, they are getting better. For instance, while Q3 FY2023 guidance expects the top and the bottom line to be down YoY, it is also up QoQ. The table below shows guidance for Q3 FY2023.
| Q3 FY2023 (guidance) |
| Q3 FY2022 |
| YoY (midpoint) |
| Revenue |
| $155-175M |
| $171.9M |
| (4.01%) |
| GAAP EPS |
| $0.16-0.27 |
| $0.27 |
| (20.37%) |
| Non-GAAP EPS |
| $0.30-0.40 |
| $0.45 |
| (22.22%) |
Source: VECO Form 8-K
The table below shows how the numbers have improved sequentially, even if they are still down YoY. Q1 FY2023 seems to have been the trough with VECO now on the way up. Note that VECO did post a GAAP loss of $85M or $1.61 per share in Q2 FY2023, but this was due to refinancing of convertible notes. From the Q2 FY2023 earnings call:
We had a net loss of $85 million or $1.61 per share, principally from a $97 million loss on extinguishment from refinancing a portion of our convertible notes. The loss resulted from paying $301 million for repurchasing 80% of our 2025 and 2027 convertible notes, which were trading at a premium to the net carrying value of approximately $204 million. The company issued 4.5 million shares of stock with a value of $102 million and used $199 million in cash for the repurchase."
A transcript of the Q2 FY2023 earnings call can be found here .
| (Unit: $1000, except for EPS, margins and shares) |
| (GAAP) |
| Q2 FY2023 |
| Q1 FY2023 |
| Q2 FY2022 |
| QoQ |
| YoY |
| Revenue |
| 161,641 |
| 153,504 |
| 163,999 |
| 5.30% |
| (1.44%) |
| Gross margin |
| 41.8% |
| 40.4% |
| 39.2% |
| 140bps |
| 260bps |
| Operating income |
| 13,688 |
| 9,806 |
| 12,823 |
| 39.59% |
| 6.75% |
| Net income (loss) |
| (85,320) |
| 8,741 |
| 9,655 |
| - |
| - |
| EPS |
| (1.61) |
| 0.17 |
| 0.18 |
| - |
| - |
| Weighted-average shares outstanding |
| 52,861K |
| 59,856K |
| 59,455K |
| (11.69%) |
| (11.09%) |
| (Non-GAAP) |
| Revenue |
| 161,641 |
| 153,504 |
| 163,999 |
| 5.30% |
| (1.44%) |
| Gross margin |
| 42.7% |
| 41.5% |
| 40.3% |
| 120bps |
| 240bps |
| Operating income |
| 24,292 |
| 20,442 |
| 22,979 |
| 18.83% |
| 5.71% |
| Net income |
| 20,603 |
| 16,873 |
| 19,975 |
| 22.11% |
| 3.14% |
| EPS |
| 0.36 |
| 0.30 |
| 0.35 |
| 20.00% |
| 2.86% |
| Weighted-average shares outstanding |
| 61,236K |
| 63,288K |
| 63,309K |
| (3.24%) |
| (3.27%) |
Source: VECO Form 8-K
In the same earnings call, VECO raised its FY2023 outlook.
Now for some color on our full year 2023 non-GAAP guidance. Based on our current backlog and expected growth trajectory in the second half of the year, we reiterate our 2023 revenue outlook of between $630 million and $670 million. Moreover, we are raising our profitability outlook for the year to account for stronger gross margin, a reduction in net interest expense and a lower projected tax rate. We now expect gross margin in the 42% to 43% range and non-GAAP EPS between $1.30 and $1.50 per diluted share for 2023."
The previous outlook called for non-GAAP EPS of $1.15-1.35 on revenue of $630-670M in FY2023, but the updated outlook from VECO calls for non-GAAP EPS of $1.30-1.50 on revenue of $630-670M in F2023. A look at Wall Street estimates shows that the consensus is that VECO will earn $1.43 on revenue of $656.4M in FY2023, which will then grow to $1.64 on revenue of $729.6M in FY2024.
Is the improvement driven by an increase in real demand?
The recent quarterly numbers, guidance and outlook all suggest business is improving at VECO. However, as mentioned earlier, there is an issue that needs highlighting. Much, if not all, of the recent growth seems to be driven by China. For instance, in Q1 FY2023, China sales nearly doubled from $30.4M to $60.7M, offsetting big declines in other markets. China did not contribute as much in the latest quarter, but if not for China, the Q2 results would have been much worse. In Q2, spiking sales in China offset weakness elsewhere with an increase of 75.4% YoY.
| (Unit: $1000) |
| Q2 FY2023 |
| Q2 FY2022 |
| YoY |
| USA |
| 35,739 |
| 57,940 |
| (38.32%) |
| EMEA |
| 17,511 |
| 27,234 |
| (35.70%) |
| China |
| 49,986 |
| 28,497 |
| 75.41% |
| Rest of APAC |
| 58,320 |
| 49,345 |
| 18.19% |
| Rest of the world |
| 85 |
| 983 |
| (91.35%) |
| 161,641 |
| 163,999 |
Source: VECO Form 10-Q
This raises a number of questions, such as why China has increased its orders from VECO by so much or whether the increase in sales is driven by real demand, inventory building or something else. It's hard to say, but some companies in China may have felt the need to stock up as a precaution against possible trade restrictions from the U.S. government.
As a result, sales in China got a boost from companies ordering more than they actually needed to build up inventories. This may have boosted the numbers in the short term, but it could lead to a drop in sales down the road since the buying spree is not driven by real demand. This might explain why not everyone is buying the recent improvement in the numbers, as expressed by the elevated level of short interest.
Investor takeaways
There is certainly an argument to be made for long VECO. The stock seems to be close to support and may have room to appreciate assuming fair value is in the low thirties. Multiples are no higher than the going rate in the sector. The numbers have improved, even if they are still down from where they used to be.
I am neutral on VECO nonetheless. The increase in sales in China should raise some eyebrows at the very least. On the one hand, most of the other markets are seeing big drops in demand, mostly due to soft conditions in the semiconductor industry, yet China is going against the grain with sales increases in the range of 75-100%.
Such a sudden and large jump suggests there is more to it than just an increase in real demand. So while the recent earnings reports are promising, they should be treated with some caution. China has managed to negate the weakness in other markets, resulting in an improvement in sequential growth, but if China is excluded, the numbers don't look all that good. The recent turnaround in the stock, which was built on the improvement in quarterly growth, may be built on a shaky foundation.
Bottom line, long VECO can be taken into consideration since China could continue for a while longer its buying spree that has boosted quarterly earnings. The stock has room to appreciate on the back of support. Just be aware that the recent improvement at VECO may not be on solid grounds and if for whatever reason China falls off, there might not be anyone else to pick up the slack.
For further details see:
Veeco Instruments: Support Is Near Even Though The Uptrend Is No More