VEON - VEON: Technical Analysis To See If Strong Year-To-Date Gains Can Continue
2023-06-22 02:29:23 ET
Summary
- Shares of VEON have increased by 73% or $8.59 per share since November last year.
- The stock's technicals are pointing to consolidation or lower prices in the near term.
- I do not recommend adding to long positions at this time, as the potential reward does not justify the downside risk.
Intro
We wrote about VEON Ltd. ( VEON ) back in November of last year when we stated that there was more upside in this play. ARPU at the time was growing in all of the company's markets but it was the unloading of the company's Russian operations (announced in late November of last year) which really changed investor sentiment in this stock. Since then, shares have never really looked back, tacking on 73% or $8.59 per share since we penned that piece approximately 7 months ago.
Therefore in this article, I want to break down the technicals of VEON at this present moment in time. Since our 'BUY' signal 7 months ago was very much predicated on the bullish technicals we were witnessing in VEON at the time, it stands to reason to revisit the company's technical charts to evaluate if indeed there are more gains on the cards going forward.
Although fundamental-minded investors many times ignore a stock's respective technical patterns, both approaches (Be it fundamental analysis as well as technical analysis) can aid the investor in making solid investing decisions. Chartists or technicians for example do not need to know why a stock may be rallying (cause) but exclusively focus on the effect (Result). Therefore, if you are a fundamental-orientated investor who remains long VEON, let's see if the company's technical charts align with your bullish outlook at this present moment in time.
Long-Term 20-Year Chart
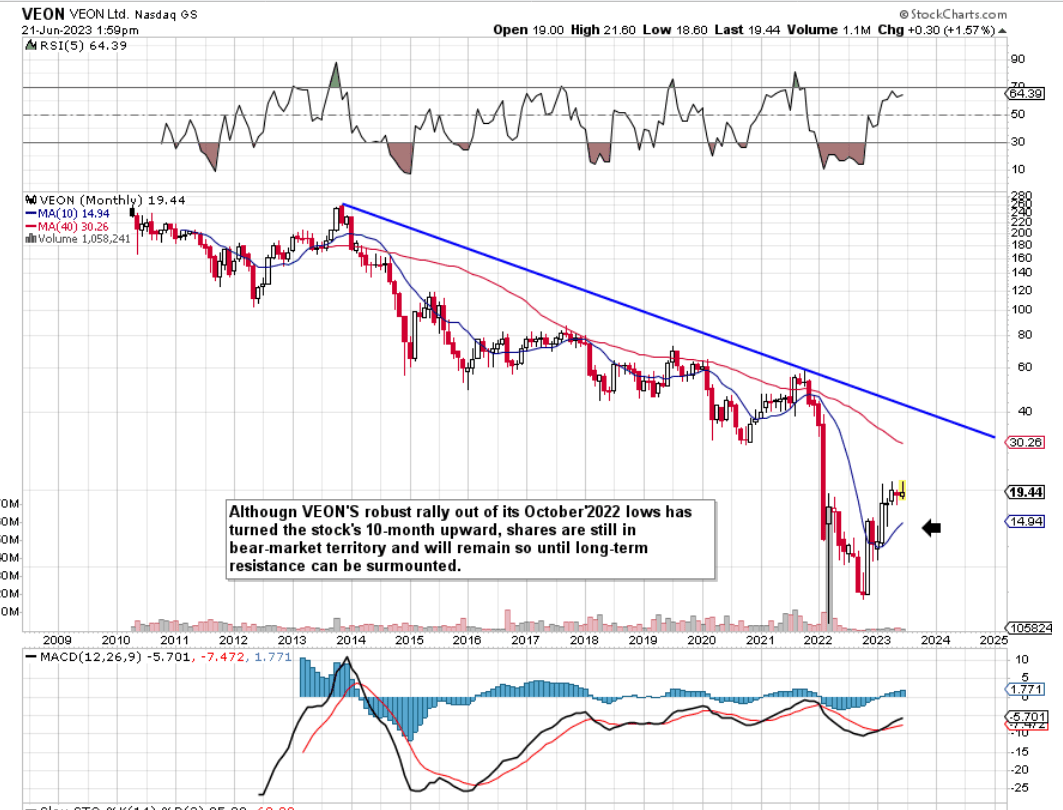
As we see below, shares of VEON have been in a bear market since 2014. We state this because of the crossing over of the stock's 10-month moving average below the 40-month average. Suffice it to say, what shares of VEON are witnessing at present is a long-term bear-market rally. If indeed the rally can continue here, the first point of resistance would be the 40-month average ($30.26) followed by the multi-year bear-market trendline of just under $40 a share. Suffice it to say that despite VEON's long-term pattern of lower lows, these resistance levels are still significantly higher than VEON's prevailing share price ($19.44). Therefore, our job is to decipher whether if indeed a rally up to long-term resistance can take place and how long shares would need to get there.
VEON Long-Term Technicals (Stockcharts.com)
Intermediate 5-Year Chart
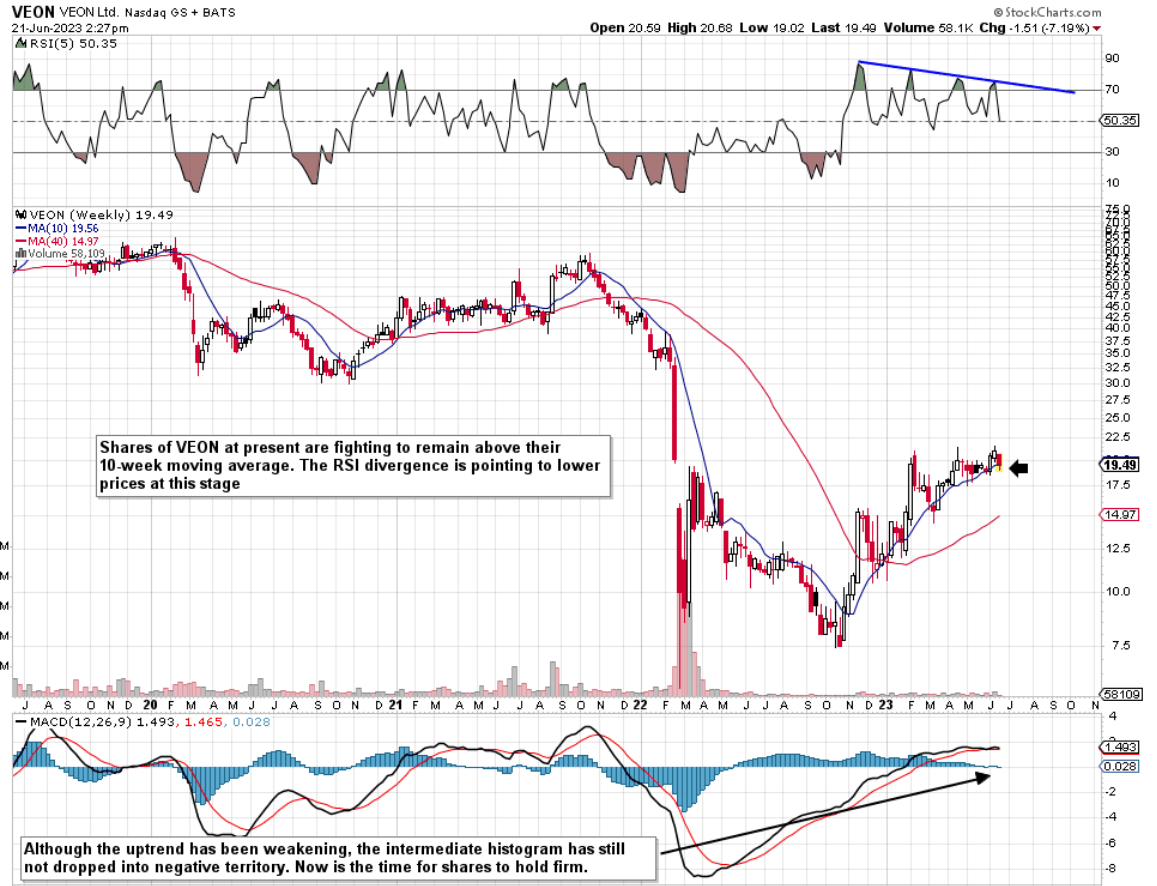
On the intermediate 5-year chart, we see that shares of VEON are currently fighting to remain above their respective 10-week moving average ($19.57). This is vital as a sustained move up to the resistance levels pointed out above would be off the cards over the near term if indeed shares lose their 10-week moving average convincingly. Furthermore, the divergence in the RSI momentum indicator is actually pointing to lower prices although the MACD has not given a clear intermediate sell-signal as of yet. Suffice it to say, if VEON intermediate rally is to continue, we need to see shares remaining above their 10-week average which means no more meaningful declines can essentially take place.
VEON Intermediate Chart (Stockcharts.com)
Short-Term 12-Month Chart
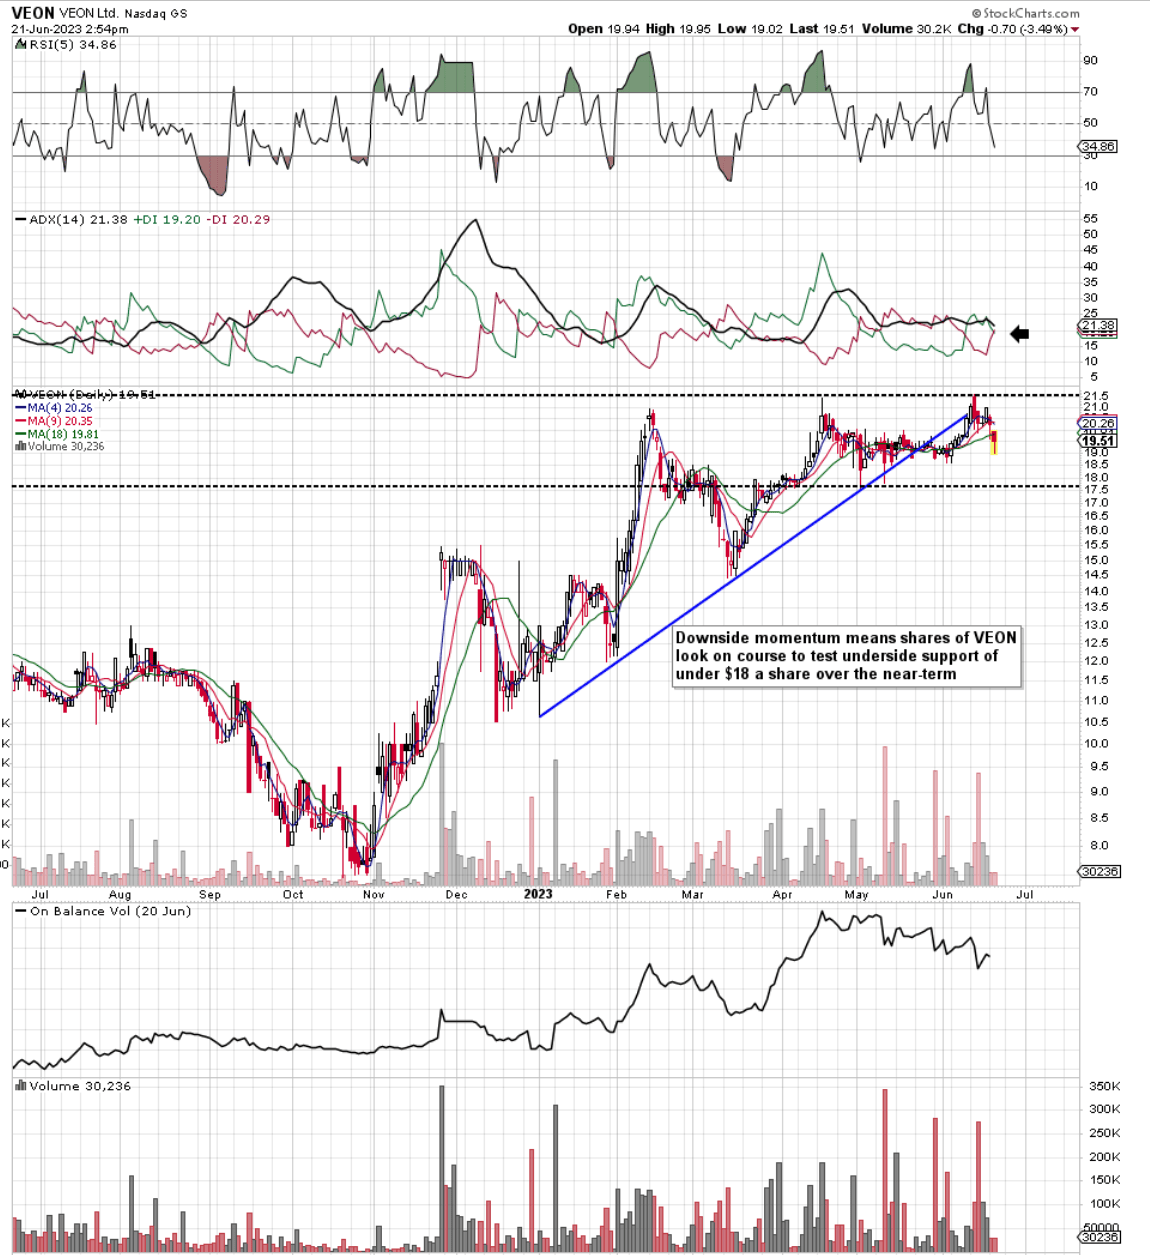
Although shares of VEON printed a marginally higher high on the 12th of June last, trading since then could mean that we have a false breakout (bull trap) on our hands. We state this because of the breaking of the depicted trend line, the strong surge in selling volume over the past month or so, and the fall in the share price below VEON's mainstay moving averages (4, 9 & 18). Furthermore, if indeed we have a double-top formation in play, the height of the pattern is approximately $4 which means shares could potentially drop to around the $13.50 level if indeed downside support gets penetrated. Suffice it to say, what we are seeing on the daily chart ties in with the concerns on the intermediate chart. This means from our standpoint that the potential reward (In terms of remaining long VEON) does not justify the downside risk at this stage.
VEON Daily Chart (Stockcharts.com)
Conclusion
To sum up, although shares of VEON have had an excellent seven months or so, the stock's technicals are pointing to consolidation if not lower prices over the near term. Therefore, given how nominal annual gains need to come in above at least 5 to 6% in order to break even and the fact that VEON does not pay a dividend, we believe the right course of action is not to add to long positions at this moment in time. We look forward to continued coverage.
For further details see:
VEON: Technical Analysis To See If Strong Year-To-Date Gains Can Continue