VEU - VEU: Valuations Support Next 12 Months Returns Potential Weight On Tactical Side
2023-11-02 06:00:00 ET
Summary
- US equity markets are showing mixed signals for the coming 12 months, suggesting potential for allocating to ex-US instruments.
- The Vanguard FTSE All-World ex-US Index Fund ETF Shares is a possible option on the tactical side for short-term investors.
- The fund has a tight tracking error to its benchmarks, but mid- to long-term performance relative to its U.S. counterparts is still uncertain.
- For mid- to long-term investors, more selective domestic opportunities are warranted.
Investment brief
After a decade of outperformance for the U.S., the forward returns (coming 12 months) of domestic equity markets are showing mixed signals. There may be scope for opening up the view in allocating to ex-U.S. instruments on the tactical side over this duration.
The Vanguard FTSE All-World ex-US Index Fund ETF Shares (NYSEARCA: VEU ), which tracks the FTSE All-World ex-US Index, is one such option on the table. Naturally, the fund has underperformed its U.S. counterparts over the past years, and long-term (3+ years), I'm not sure if relative performance may be any better. But, in the short-term, there may be scope to range trade the fund for investors with this horizon.
VEU invests across a broad range of sectors and, unlike the U.S. benchmarks, is not concentrated in tech. Sector weightings are biased to financials (20.7%) for the 3,776 holdings instead, with industrials and consumer cyclical holding an equal weighting to tech at ~11-12% of the fund's holdings respectively. The top 10 holdings are, in fact, only 10% of the portfolio's value—stark contrast to what we see in the U.S.
The fund has $32.7Bn in AUM at the time of publication and charges an 8bps expense ratio on this AUM. Dividends , paid at a yield of 3.26% at the time of writing, have been lumpy over the past 5 years, with the most recent distribution tallying $1.64 over the last 12 months. As a positive, the 3-year tracking error of the funds versus its benchmark, is only 2%, providing investors with a confident tracker for holdings outside of the U.S.
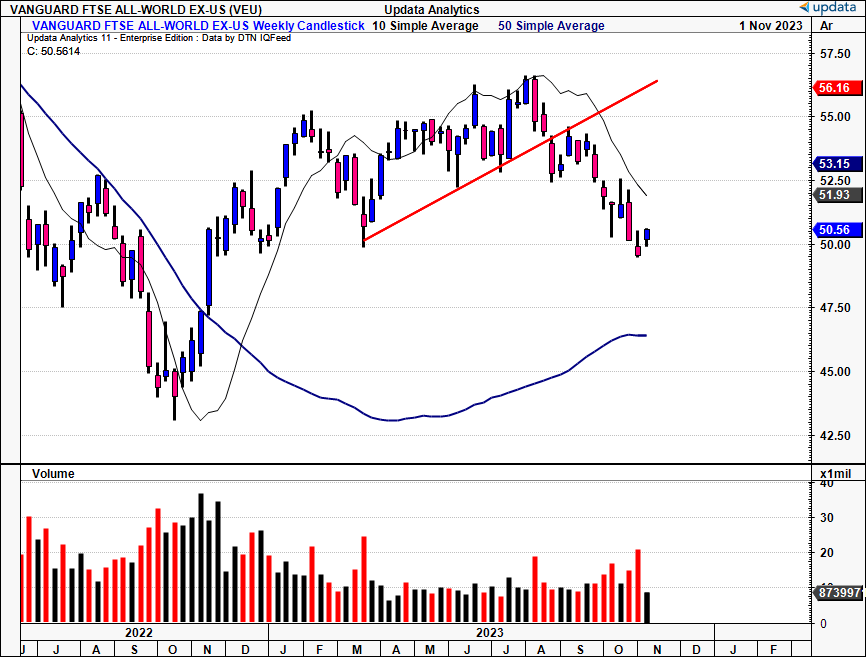
Still, like the U.S. benchmarks, the fund has broken its 50DMA and is now tracking towards its 200DMA, which is not a robust technical setup. Despite some strong opinions on the potential for global equities to outperform the US in the next 12 months (which will be discussed here today), over the mid to long-term, my judgement is that it is still dubious on the fund's performance relative to respective US counterparts.
Figure 1.
As such, my recommendations over the 3 investment horizons are as follows:
Fundamental—
- Short-term (next 12 months)- Bullish - Potential value in cheaper multiples vs. U.S. counterparts at 12.2x earnings and the c.3.3% dividend yield. Look for retracement towards former highs.
- Medium-term (18 months-3 years)- Neutral - Sales and earnings growth + projections remain compressed relative to U.S., with the latter's GDP forecasts ratcheting higher in recent months as well. Meanwhile, the Eurozone's GDP forecasts have been revised lower. Underweighting to tech may be a hindrance on performance long-term. Avoid allocations on pullbacks for positioning for next 3 years.
- Long-term (3+ years) - Neutral - Murky outlook for relative growth vs. U.S., presenting opportunity cost. Factors like ROE and capital productivity continue to remain elevated on a long-term projection in the U.S., meaning global peers may lag in equity performance.
Technical—
- Short-term (coming days)— bullish , still time to retrace into the mid-$50s.
- Mid-term (coming weeks)— Neutral; no bullish confirmations to suggest long-term reversal. Don't play breakout, range trade supported instead.
- Long-term (coming months)— Neutral; As above.
Net-net, I rate VEU a hold based on the culmination of factors raised in this report.
Talking points
-
Relative performance now the hot question
Long-term performance of domestic equities has outpaced global peers by a large magnitude. Compared to the European and Japanese indices, the S&P 500 index has produced an annualised return of 7% since 2000, compared to 4%, and 3%, respectively.
Figure 2.
Source: Goldman Sachs Global Macro Research
Despite this, investors have turned to non-US funds this year, piling in $59 billion into non-US equity, mutual funds, and ETS, versus the collective $5 billion into US equivalence this year to date, per Goldman Sachs Macro research.
Figure 3.
Source: Goldman Sachs Global Macro Research
The question beckons on whether this will translate to outsized equity performance in the coming 12 months. Goldman Sachs's Top of Mind publication for October, released today, has chimed in with a diverse range of opinions. Strategists at the company believe there is scope for non-US equities to, in fact, outperform over this duration. Notably, it says:
Even if US equity returns benefit from management focus on ROE and profitability, sector composition, and greater index dynamism, to what extent are these benefits already priced in? The S&P 500 currently trades at a P/E multiple of 17x, ranking in the 77th percentile historically, while valuations of other equity markets are less stretched—the STOXX 600 trades at a 12x multiple (21st percentile), TOPIX at 13x (28th percentile), and MXAPJ at 12x (39th percentile). So, high starting valuations represent a potential impediment to strong forward returns.
Indeed, our 12-month global equity forecasts suggest that the US will lag other regions, delivering 13% total returns over the next year."
This does support the notion that non-U.S. ETFs may catch a bid over this duration, and multiples lay extra weight to this. VEU trades at 12.2x earnings, below the S&P 500 index's 18.9x earnings at the time of writing. This could push the next 12-month returns higher, sporting a higher relative capital gain, based on research on starting valuations + forward returns.
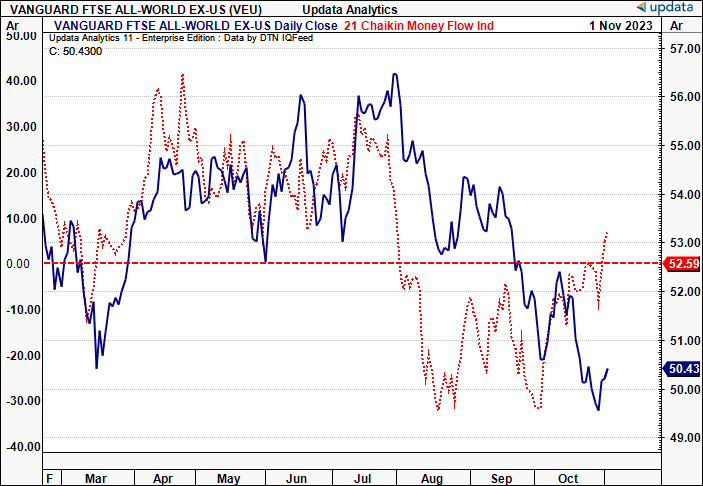
This is further supported by the recent uptick in money flows into the fund, surging off September lows, and in countertrend to the large selloff in situ since July (Figure 5).
Figure 4.
Source: Goldman Sachs Global Macro Research
Figure 5.
Still, over the longer term, GS strategists expect U.S. stocks to "outperform their global peers" , a judgement I agree with in principle, thus supporting a neutral view on VEU over the long term.
Technical factors for consideration
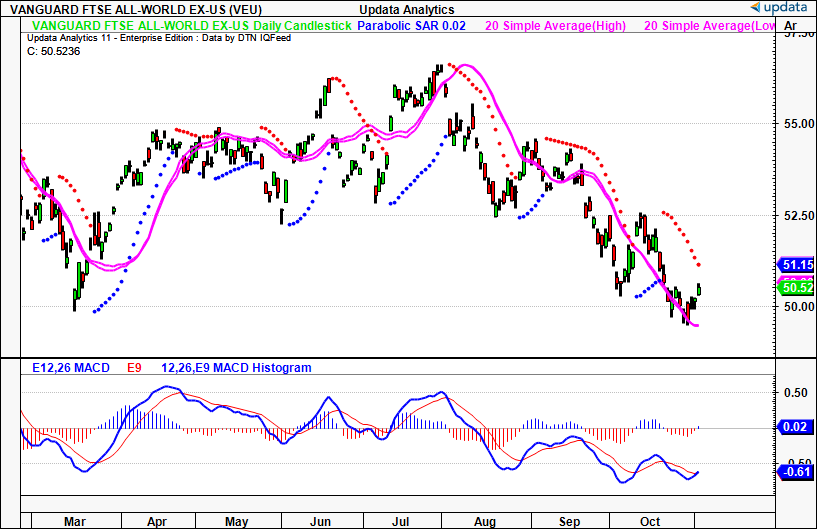
1. Momentum remains down
Short and long-term momentum remains biased to the downside with a number of bearish crosses on the MACD since July. It too has been trending south. Continued down-steps in the bearish trend support potential liquidity grabs to take out stops positioned above each down leg, and this latest reversal may be the same in the medium term.
Figure 6.
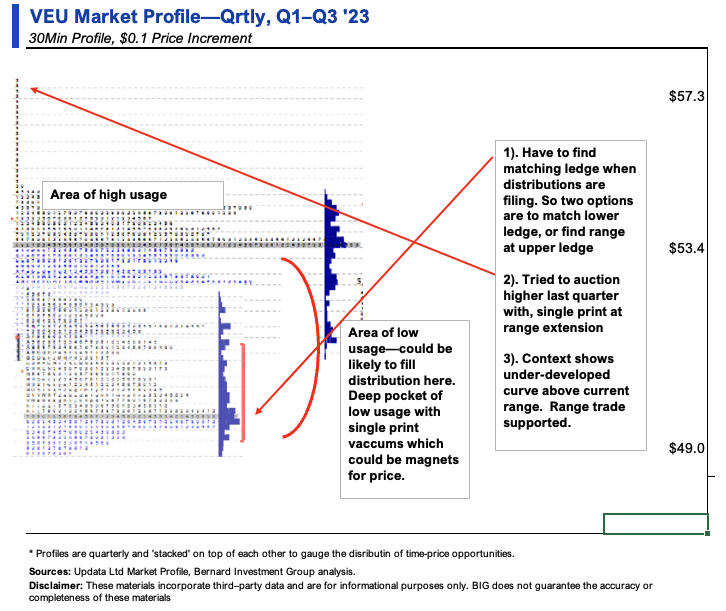
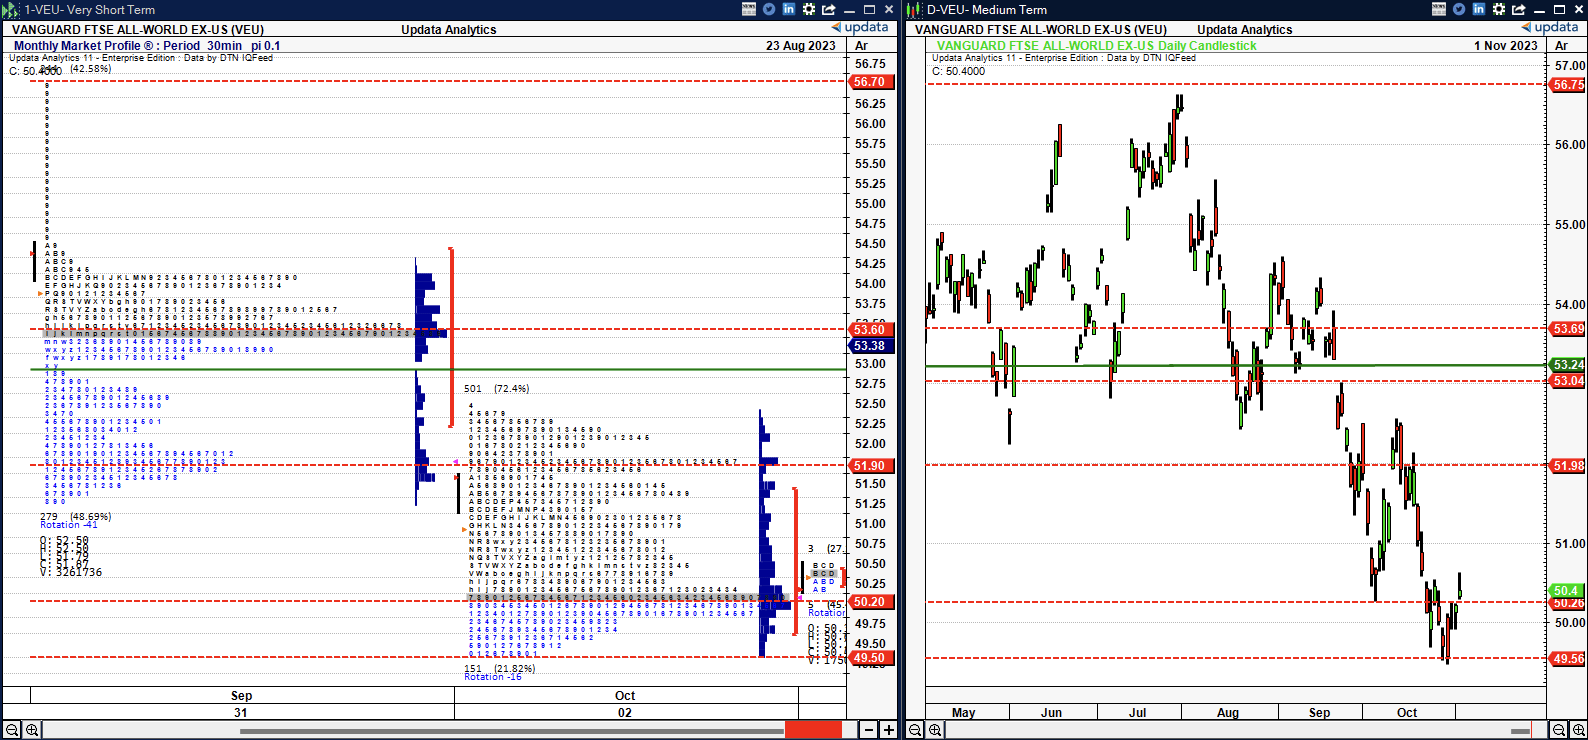
2. Skew, directional bias of price distribution
Observations: Uncompleted bell curve with upper ledge (high volume node) well-formed and lower ledge (another high volume node) starting to develop. Pocket of low usage between these two ledges between $49–$54 (Figure 7). VEU tried to auction higher in August and was met with immediate responsive selling, capping the reversal to $57.30. Given the distribution is incomplete, range trade is supported, and my opinion is that investors may continue to build the ledge ~$47–$50. The skew is a double distribution, further supporting sideways trade. Given the 'bracketing' of price as VEU finds balance, in this sense, the Market Profile is an adequate filter for all market participant's opinions.
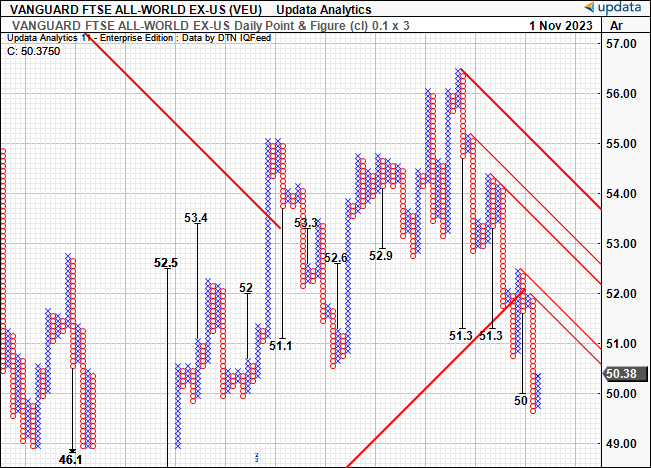
Key levels: Investors would be wise to monitor the range between the two high volume nodes/ledges at $50 and $53. If price remains trapped in this area, it supports further sideways trade moving forward in the coming months. $53 is a deep pocket with 2x Marubozu lines in situ and the last gap down, so could attract price usage (Figure 8).
Actionable strategy: Given (i) the double distribution, (ii) pocket of low usage, and (iii) unmatched ledge at $50, (iv) under-developed bell curve, range trade is supported, and this indicates a neutral bias. I wouldn't play for a breakout or directional move with this setup. Buy the bottom of value, sell the top of value, rotating between each level.
Figure 7.
Figure 8.
A cluster of multiple price targets on the point and figure study lays weight to this area of usage as well. I would look to this over the coming weeks, and position with a rotational strategy, but not playing for a breakout.
Figure 9.
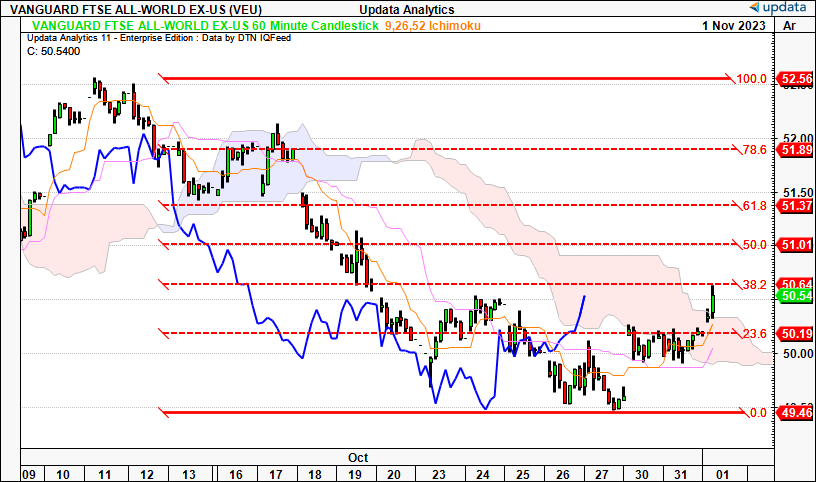
Figure 10. Short-term (60-minute chart, looking to coming days)—
- There is a bullish move on our hands and those speculating on an investment horizon of days ahead may see upside here.
- Short-term reversal looks completed in late October, and VEU still has time to retrace to $51.00 then $51.40.
- The price line has broken into the cloud along with base and turning lines, but the lagging line hasn't given the signal for a longer-term move.
- If the lagging line breaks ~$51, this would be a level to position against.
Key levels:
- Next upsides to $51 then $51.90,
- Downsides to $49.50 is we break lower. Gap may be filled <$50.
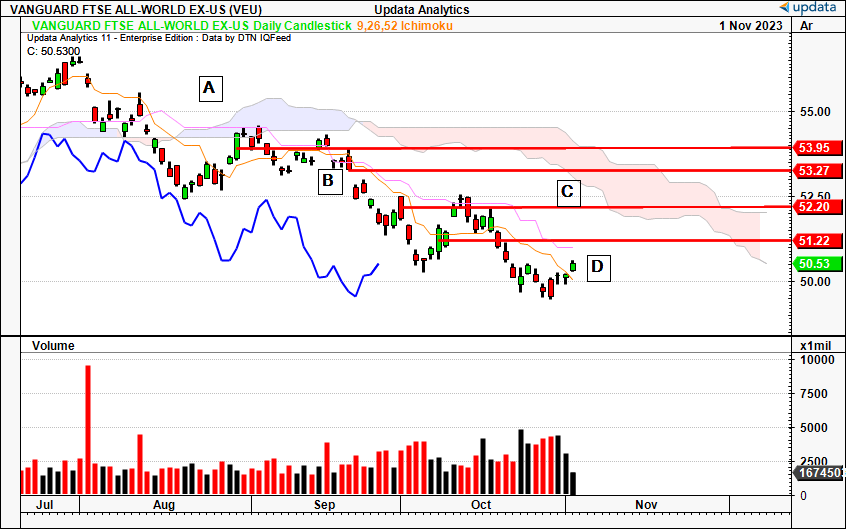
Figure 11. Medium-term (daily chart, looking to the coming weeks)—
- Broke the cloud at A and retested in September with rejection, now completed 3 waves down move to D.
- Gapped down at B and this level hasn't been retaken. Marubozu line at C was tested but failed, and we then took the subsequent Marubozu line out in October
- Gapped higher after 2x tight closes and tiny hammer this week, not convincing bullish activity. Buying volume drying up on the reversal as well.
- Still neutral beneath the cloud, lagging line nowhere in sight.
Key levels:
- For upsides, $51, $52.20, then the $53s, all levels that must be retaken to imply bulls have some control.
- Downsides are set <$50, look to this region if price builds another wave lower.
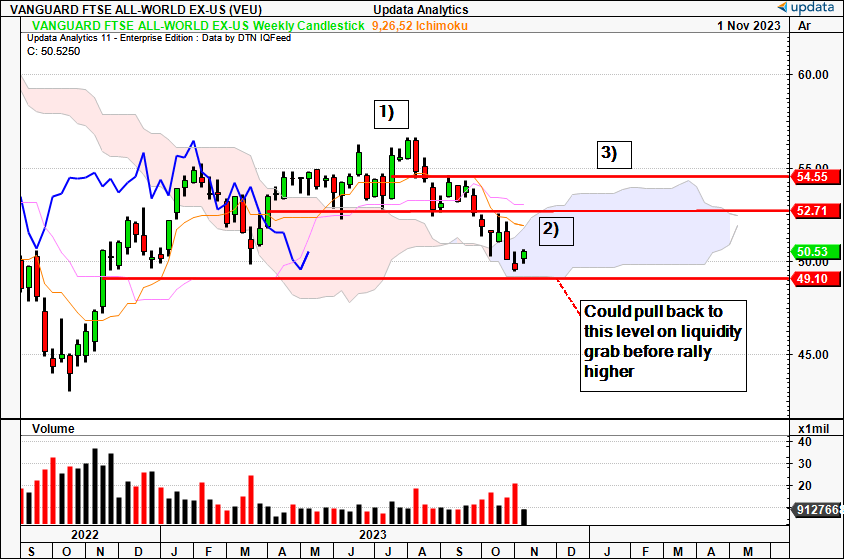
Figure 12. Long-term (weekly chart, looking to coming months)—
- Crossed into cloud in October after an inverted hammer and then shooting star. Lagging line never made it out. Turning line crossed baseline in a bearish cross to the downside just prior to this.
- Double top with bearish engulfing at 1) in July, as equity markets rolled over. Bullish Marubozu line at 3) into this level hasn't been retaken, despite 3x weeks testing this mark in August/September.
- You can see support line at 2) corresponding to April Marubozu line was taken out last month with the bearish engulfing candle, with ascending selling volume.
- Potential morning star formed in the last 3 weeks, but this week's green candle hasn't added much conviction halfway through the week.
- In fact, it's not unlikely this small reversal could be another liquidity grab to take out the stops of shorts before another wave down. Need further confirmation from here.
- We are neutral in the cloud.
Key levels:
- $49.10 on the downside at the base of the cloud—watch for this level as continuation after potential liquidity grab if no reversal.
- To the upside, $52.70 then $54.55.
Discussion Summary
In short, the topic of ex-U.S. investment continues to be hotly debated amongst strategist circles. There are multiple economic factors to consider. What is clear, is that ex-U.S. equities are cheap vs. their domestic counterparts. This could bolster next 12 months returns, and I am bullish on the segment over this duration. Over the mid to long-term, my judgement is still weighted to the U.S. On technicals, only very short-term frames are supported, i.e., into the coming days. Longer, VEU has much more to do. As a final reiteration:
Fundamental bias— short-term bullish, neutral on mid to long-term;
Technical bias— bullish on very short-term (coming days), neutral on mid to long-term.
Net-net, I rate VEU a hold for mid to long-term investors but recognize the potential upsides on the tactical side for short-term horizons.
For further details see:
VEU: Valuations Support Next 12 Months Returns, Potential Weight On Tactical Side