JQUA - VFQY Vs. 3 Quality Funds: A Bit Disappointing
2023-03-14 15:35:52 ET
Summary
- Vanguard U.S. Quality Factor ETF is a quality-style exchange-traded fund, actively managed by Vanguard.
- It is well-diversified across sectors and holdings.
- I compare it with 3 other quality-style funds.
- Valuation looks attractive, but performance is disappointing for an actively-managed ETF.
This article series aims at evaluating exchange-traded funds, or ETFs, regarding the relative past performance of their strategies and quality of their current portfolios. As holdings and data change over time, updated reviews are posted when necessary.
VFQY strategy and portfolio
Vanguard U.S. Quality Factor ETF (VFQY) is an actively managed fund launched on 02/13/2018 with the objective of investing in stocks with strong fundamentals. VFQY has 534 holdings, a 12-month distribution yield of 1.45% and an expense ratio of 0.13%.
As described by Vanguard , the management team selects stocks using...
a rules-based screen designed to promote diversification and to mitigate exposure to certain less liquid stocks. Securities with relatively strong fundamentals may be identified by measures such as strong profitability, sustainable earnings, and healthy balance sheets.
The fund is actively managed: it means it doesn't track an index and the managers have some flexibility in implementing the strategy. On the downside, the investing process is a black box that is difficult for us to back-test or duplicate.
VFQY invests in U.S. companies of all sizes, from micro- to mega-caps.
Asset value by company size (Chart: author; data: Fidelity)
The heaviest sector is technology, like in the S&P 500 Index (SP500). However, the fund is better balanced than the benchmark across its top sectors. Technology, financials and healthcare weigh between 15% and 21% of assets. Consumer discretionary, industrials, energy and consumer staples are between 8% and 12%. Other sectors are below 4%. Compared to the S&P 500, VFQY overweights mostly financials and energy. It underweights technology, communication, real estate and ignores utilities.
Sector breakdown (chart: author; data: Vanguard)
The portfolio is well-diversified: the top 10 holdings have an aggregate weight of only 11.5%, and the largest one is below 1.6%. Therefore, risks related to individual stocks are very low. The next table lists the top 10 names with two quality metrics compared with their respective industry averages: operating margin and return-on-equity ("ROE"). All of them are significantly above industry averages.
| Ticker |
| Name |
| Weight% |
| Op.Margin %TTM |
| Op.Margin Industry |
| ROE %TTM |
| ROE Industry |
| Apple, Inc. |
| 1.58% |
| 29.41 |
| -3.30 |
| 147.94 |
| -2.00 |
| Cadence Design Systems, Inc. |
| 1.24% |
| 30.15 |
| -29.11 |
| 30.95 |
| -26.24 |
| Booking Holdings, Inc. |
| 1.23% |
| 29.49 |
| 1.69 |
| 68.26 |
| -2.50 |
| EOG Resources, Inc. |
| 1.23% |
| 47.62 |
| 33.10 |
| 33.05 |
| 25.13 |
| Aon plc |
| 1.09% |
| 29.26 |
| 5.54 |
| 973.31 |
| 3.43 |
| Autodesk, Inc. |
| 1.06% |
| 20.02 |
| -29.11 |
| 82.54 |
| -26.24 |
| Paychex, Inc. |
| 1.06% |
| 39.96 |
| 0.35 |
| 46.37 |
| 4.11 |
| Adobe, Inc. |
| 1.02% |
| 33.98 |
| -29.11 |
| 32.97 |
| -26.24 |
| Cisco Systems, Inc. |
| 1.01% |
| 26.59 |
| -3.30 |
| 27.92 |
| -2.00 |
| Costco Wholesale Corp. |
| 0.96% |
| 3.39 |
| 1.94 |
| 28.67 |
| 12.07 |
Data: Portfolio123.
Comparison with competitors
I will compare some fundamental and performance metrics of VFQY with a broad market benchmark ( SPY ) and three quality-style U.S. equity funds:
- iShares MSCI USA Quality Factor ETF ( QUAL ), reviewed here
- Invesco S&P 500 Quality ETF ( SPHQ ), reviewed here
- JPMorgan U.S. Quality Factor ETF ( JQUA ).
To make a fair comparison, I have excluded funds with hybrid strategies, for example those based on quality and momentum (like JOET , reviewed here ), or quality and dividend (like QDF and DGRW , reviewed here ).
| VFQY |
| QUAL |
| SPHQ |
| JQUA |
| SPY |
| Price/Earnings TTM |
| 11.72 |
| 17.45 |
| 17.07 |
| 19.8 |
| 19.89 |
| Price/Book |
| 3.15 |
| 5.66 |
| 5.46 |
| 4.89 |
| 3.64 |
| Price/Sales |
| 1.44 |
| 2.23 |
| 2.56 |
| 2.99 |
| 2.31 |
| Price/Cash Flow |
| 11.16 |
| 14.22 |
| 12.87 |
| 13.92 |
| 14.62 |
| Earnings growth |
| 17.14% |
| 17.47% |
| 23.81% |
| 17.21% |
| 15.40% |
| Sales growth |
| 13.64% |
| 21.43% |
| 19.08% |
| 13.74% |
| 11.41% |
| Cash flow growth |
| 20.36% |
| 17.91% |
| 25.78% |
| 11.95% |
| 8.07% |
Source: Fidelity.
VFQY is significantly cheaper than the other funds regarding valuation ratios. It is in the middle of the pack for growth metrics, but above SPY.
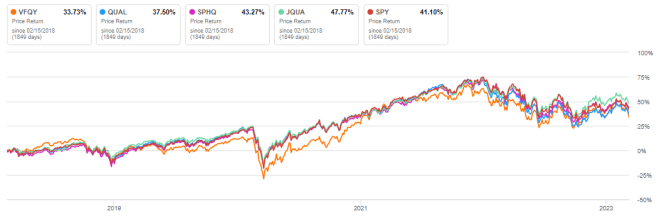
The next chart plots total returns since 2/15/2018.
VFQY vs. peers since February 2018 (Seeking Alpha)
VFQY has lagged the other funds. However, the difference in annualized return with the best performer, JQUA, is not very large: about 2 percentage points in annualized return. Price history is short and it may not be indicative of future performance.
In previous articles, I have shown how three factors may help cut the risk in a portfolio: Return on Assets , Piotroski F-score , and Altman Z-score . The next table compares VFQY since 3/1/1018 with a subset of the S&P 500: stocks with an above-average ROA, a good Altman Z-score and a good Piotroski F-score. The subset is rebalanced quarterly to make it comparable with a passive index.
| Total Return |
| Annual.Return |
| Drawdown |
| Sharpe ratio |
| Volatility |
| VFQY |
| 45.82% |
| 7.78% |
| -37.41% |
| 0.48 |
| 21.22% |
| Quality subset |
| 57.85% |
| 9.49% |
| -34.31% |
| 0.55 |
| 19.74% |
P ast performance is not a guarantee of future returns. Data Source: Portfolio123.
VFQY underperforms this quality subset based on very simple rules. However, ETF performance is real and this subset is hypothetical. My core portfolio holds 14 stocks selected in this subset (more info at the end of this post).
Takeaway
Vanguard U.S. Quality Factor ETF is a quality-style, actively managed fund invested in over 500 U.S. companies of all sizes. The fund is well-diversified: all sectors are below 21% of assets and all holdings are below 2%. We can verify that the "quality" label is well-deserved by the top 10 holdings: all of them look much better than their respective industries regarding operating margin and ROE. VFQY is materially cheaper than three competitors regarding valuation ratios. Performance isn't compelling though: the fund has lagged the same competitors in total return since inception. It also underperforms a simple 3-factor model, which is a bit disappointing for an actively managed fund.
For further details see:
VFQY Vs. 3 Quality Funds: A Bit Disappointing