VIG - VIG: Capture Growth Value And Quality With Vanguard's $68B Dividend Appreciation ETF
2023-06-20 12:22:32 ET
Summary
- VIG is a $68B dividend growth fund that holds over 300 U.S. companies with at least ten consecutive years of increasing dividend payments. Fees are low at just 0.06%.
- I upgraded my rating on VIG to a buy after its March reconstitution, and it has performed reasonably well since. Meanwhile, other dividend ETFs like SCHD have struggled YTD.
- VIG offers a similar earnings growth rate and profitability score as SPY but with a 4.56-point discount on earnings.
- Furthermore, 75% of SPY's YTD gain is explained by just seven stocks, five of which aren't in VIG. Therefore, VIG is much more balanced, and should outperform in case Q2 earnings season disappoints.
- This article reiterates my buy rating on VIG.
Investment Thesis
The Vanguard Dividend Appreciation ETF ( VIG ) has delivered solid returns since its Index reconstituted three months ago and is still an excellent choice for defensive dividend investors seeking above-average growth potential. It's also a way to avoid the seven mega-cap stocks responsible for nearly 75% of the broader market's gains this year. This article provides updated fundamentals for VIG alongside the SPDR S&P 500 ETF ( SPY ) and the Schwab U.S. Dividend Equity ETF ( SCHD ) and demonstrates why I believe VIG is a solid buy in today's market.
VIG Overview
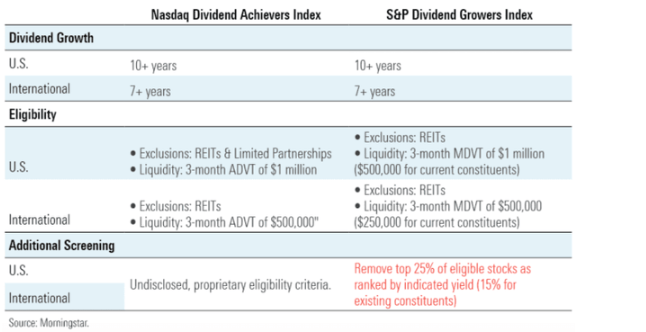
VIG tracks the S&P U.S. Dividend Growers Index, selecting stocks from all size segments with at least ten consecutive years of dividend increases. After March's annual reconstitution, that's 300 companies. However, the Index follows a modified market-cap-weighted scheme, so most holdings have negligible influence. Instead, mega-cap stocks like Apple ( AAPL ) and Microsoft ( MSFT ) are prominent despite low dividend yields. This approach makes VIG less appropriate for income investors and better suited for investors seeking capital appreciation. The table below lists additional screening criteria on the right, highlighting the changes with the Nasdaq Dividend Achievers Index, which VIG previously tracked.
In addition to the dividend growth requirement, the Index excludes REITs and removes the "top 25% of eligible stocks as ranked by indicated dividend yield (15% for existing constituents). I demonstrated how this screen drives most of the annual changes in March. This year, there were 42 additions and 12 removals, and stocks like Exxon Mobil ( XOM ) qualified because their yield was no longer considered too high. Therefore, the Index does not select beaten-down stocks like some high-dividend funds, resulting in above-average valuation ratios.
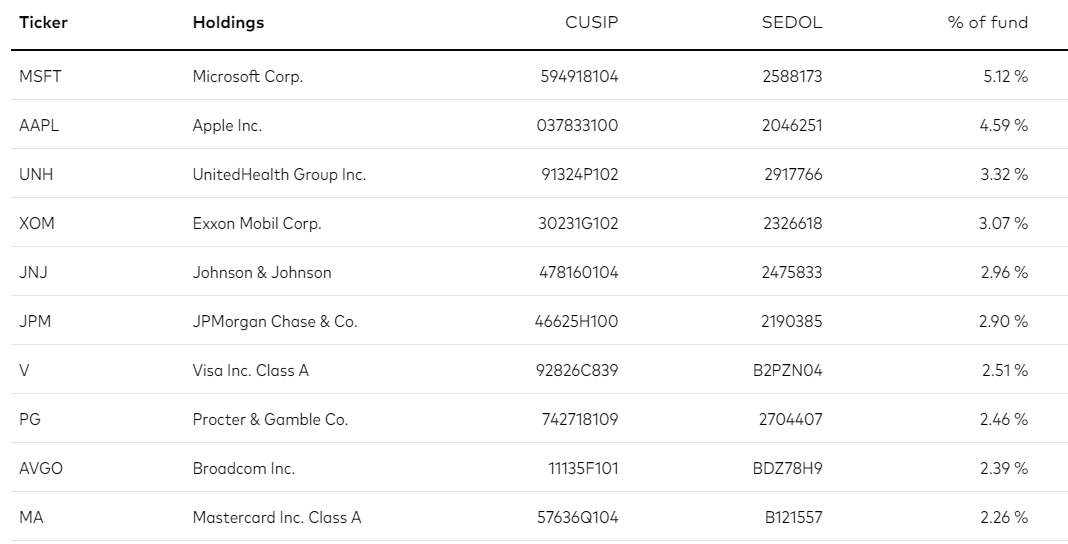
Microsoft and Apple remain well above their starting 4% weights from March, but I expect that to change shortly with the June rebalancing. VIG's Portfolio Composition File lists them as the top holdings, with shares translating to 5.11% and 4.56% allocations, respectively. UnitedHealth Group ( UNH ), Johnson & Johnson ( JNJ ), and Exxon Mobil round out the top five with 2.98%, 2.98%, and 2.97% weightings. The latest official holdings as of May 31, 2023, are listed below.
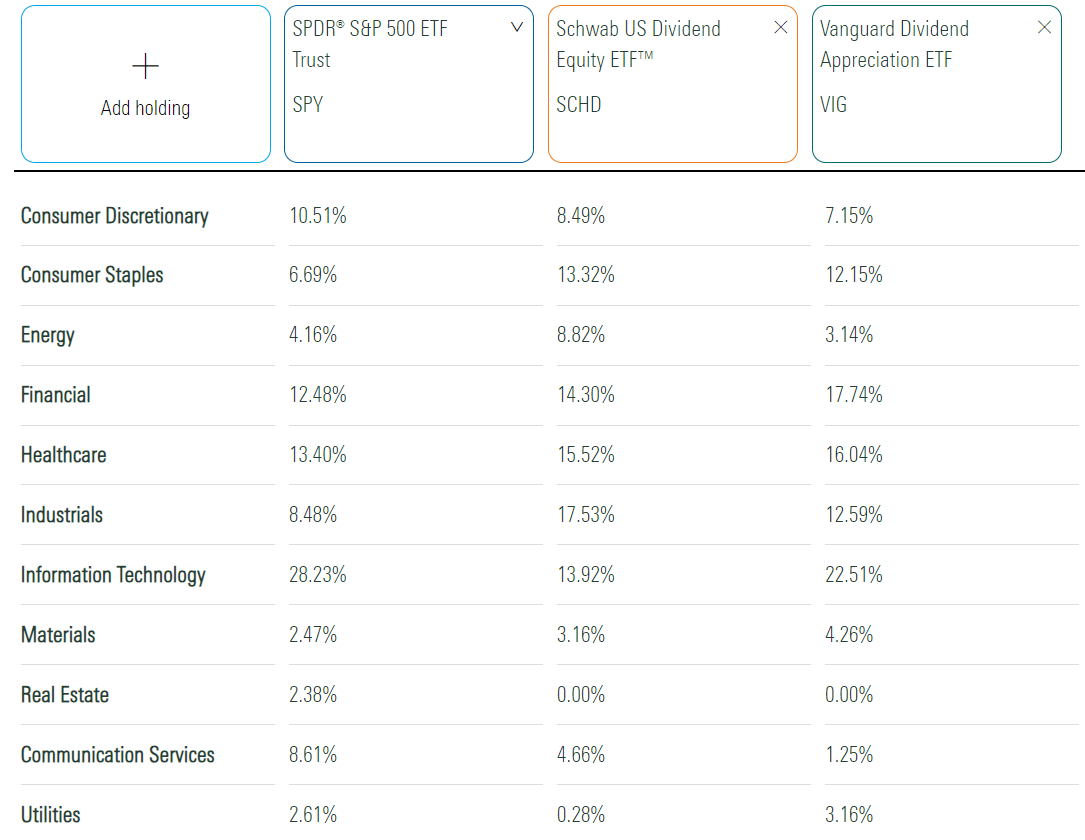
The following table highlights sector exposures for SPY, SCHD, and VIG. VIG's weightings are as of May 31, 2023, as that's the latest official holdings date provided by Vanguard. However, it's reasonably accurate. The most significant change in June was a decrease in Health Care (16.04% to 15.47%) following last week's selloff of UnitedHealth Group.
VIG and SPY are close substitutes; both have done well in this year's bull market. However, SCHD has struggled. It underweights Technology by 10-15% and overweights Energy by 5-6%. YTD, SCHD is down 2.91% compared to 6.19% and 14.91% gains for VIG and SPY.
Performance and Dividends
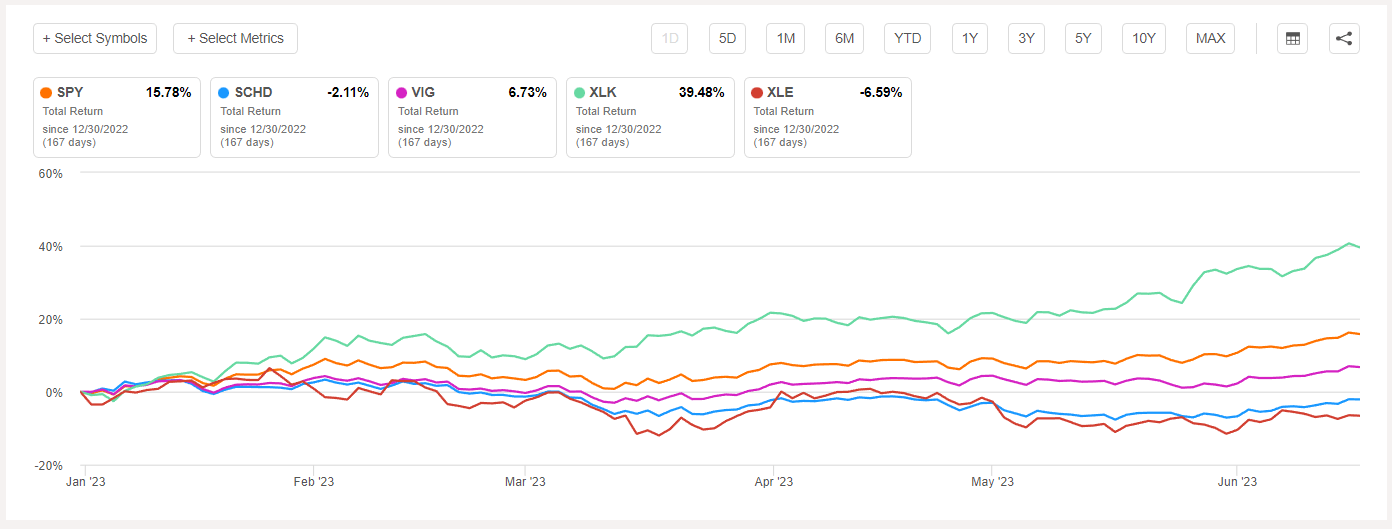
Over the long run, VIG lagged behind these peers, delivering a 12.16% annualized gain since SCHD launched in October 2011. However, it was the least volatile, so its risk-adjusted returns (Sharpe and Sortino Ratios) were comparable. SPY and SCHD gained 13.48% and 12.79% per year and could be better long-term holds. Still, I can't say which is best because, as we saw last year, market conditions can change quickly.
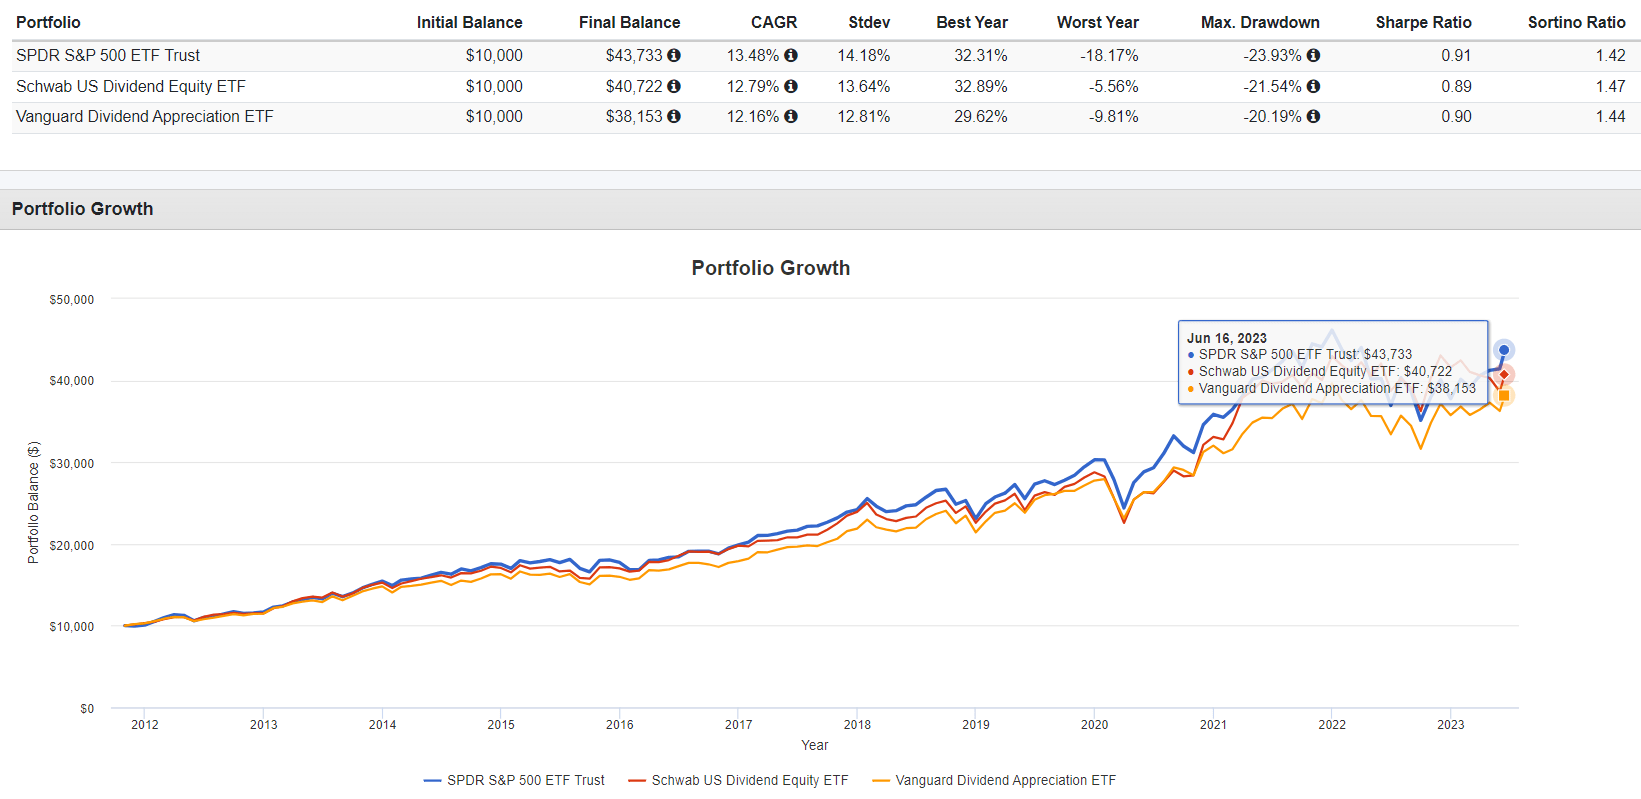
Performance charts like the one above can be misleading because even a few outliers can skew results. For example, SCHD outperformed VIG by 6.11% and 6.58% in 2021-2022 but has lagged by 8.81% in 2023. Had you just started investing in SCHD this year, you may be frustrated and wondering what all the fuss was about, but that doesn't make it a poor choice. Instead, I believe understanding market sentiment and evaluating an ETF's fundamentals can help you identify which one to overweight.
VIG receives an "A+" Dividend Grade from Seeking Alpha. As shown below, while VIG ranks poorly on yield, its mid- and long-term dividend growth rates are strong, and it's raised dividends for nine consecutive years.
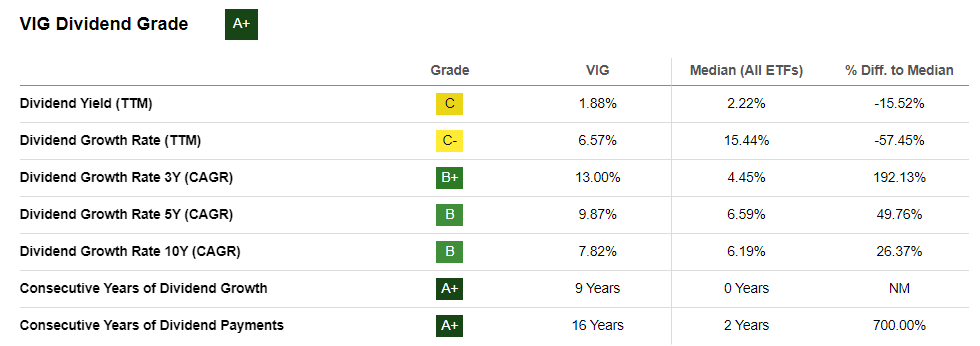
If you made a $10,000 investment in January 2012 and reinvested all dividends, your income would grow from $260 to $672 in 2022, or 9.96% annualized. SPY's annualized growth was 9.45%, while SCHD's was 15.64%.
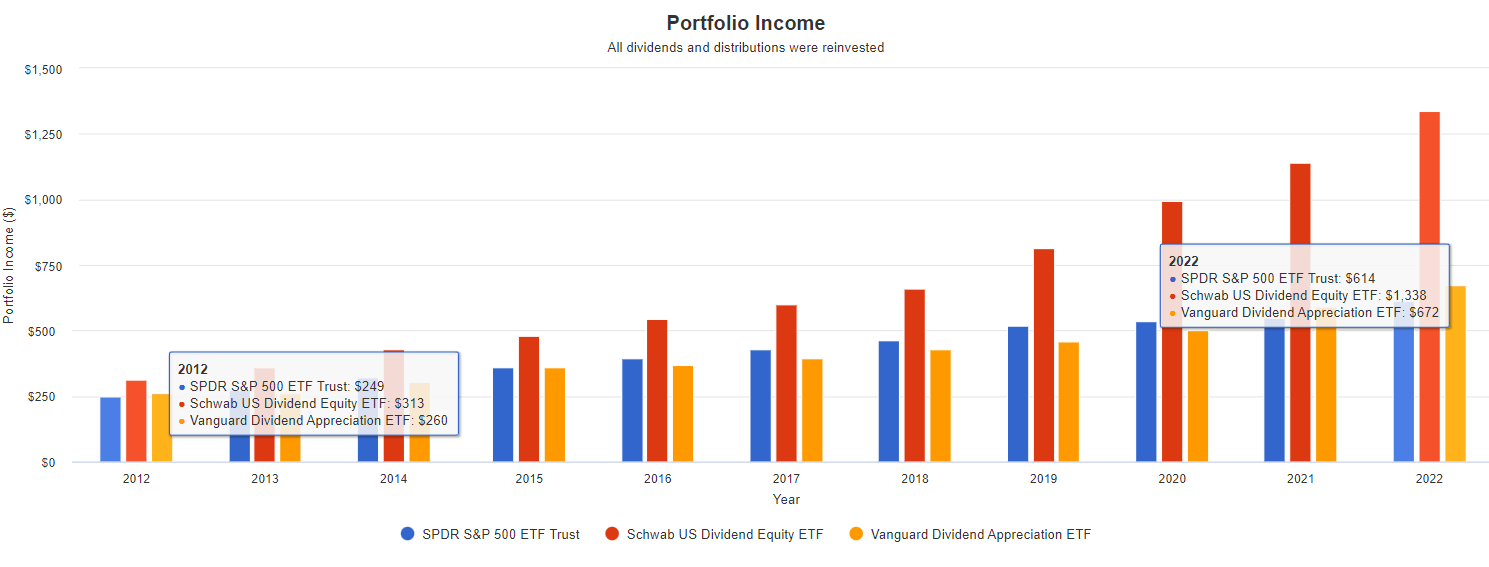
Clearly, SCHD wins in both yield and historical dividend growth. However, as I've warned several times over the last year, SCHD's double-digit dividend growth may not continue. It ranks poorly on sales and earnings growth, which, of course, funds dividend growth. It's also linked to SCHD's poor YTD returns, so let's look at how the three ETFs compare fundamentally next.
VIG Fundamentals
The following table highlights selected fundamental metrics for VIG's top 25 holdings, totaling 54%. Included are summary metrics for SPY and SCHD in the final rows.
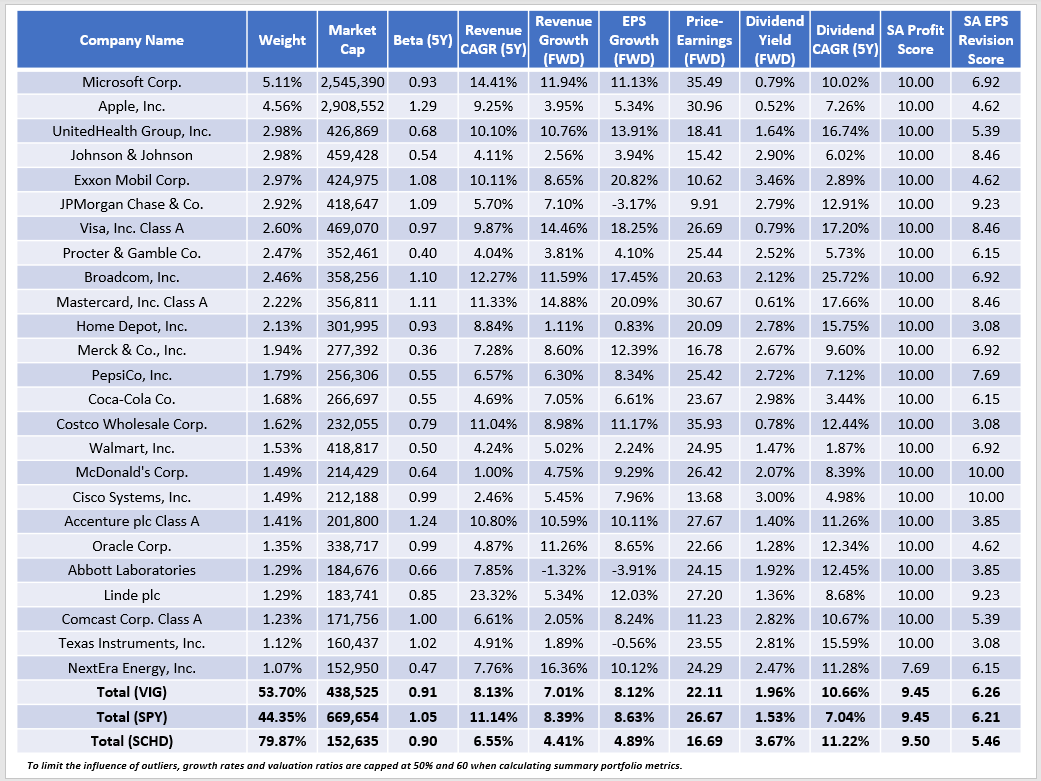
VIG is slightly less volatile than SPY, as indicated by its 0.91 five-year beta and the lower standard deviation figure presented earlier. It trades at 22.11x forward earnings, 4.56 points cheaper than SPY compared to 3.22 points in March. Therefore, it is more attractively valued, but earnings growth expectations have slipped by 0.22% (8.34% to 8.12%), while SPY's has increased by 0.47% (8.16% to 8.63%).
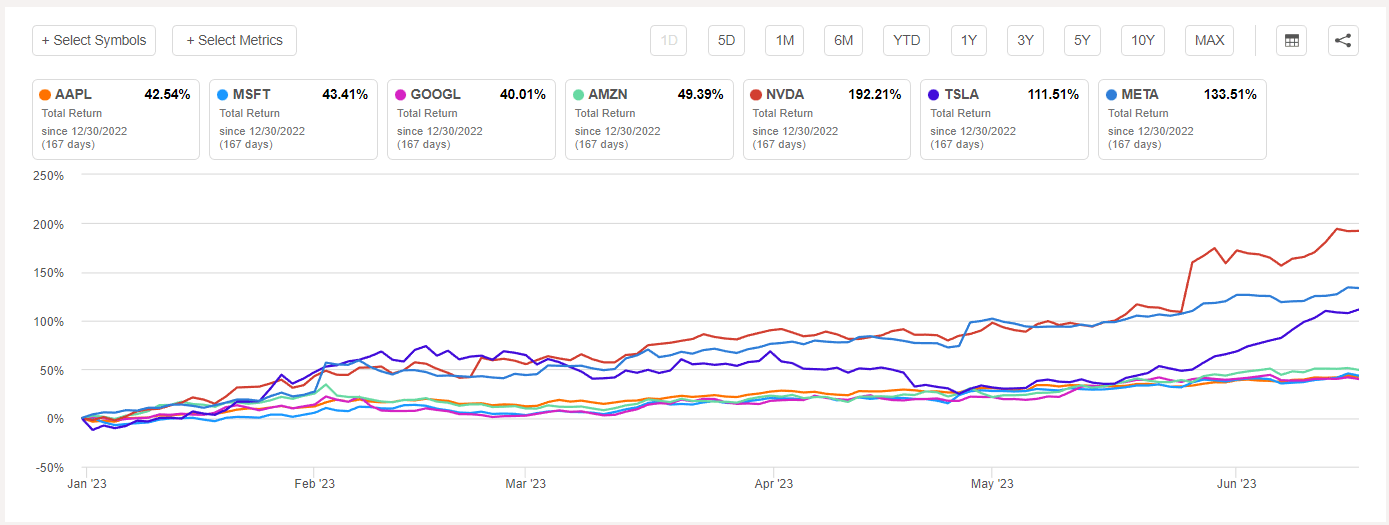
It's important to note that only a handful of mega-cap stocks are doing the market's heavy lifting. The following seven stocks comprise 27.70% of SPY but only 9.66% of VIG and 0% of SCHD. With an 87.51% average return, VIG is one way to take some reversal risk off the table while still maintaining enough exposure to growth stocks. SCHD avoids them altogether, putting it in an entirely different category.
In addition to solid growth estimates, I upgraded VIG to a buy in March because of a relatively strong EPS Revision Score, which measures Wall Street consensus earnings estimate changes over various periods. VIG was 5.73/10 at the time compared to 5.20/10 for SPY. To my surprise, Alphabet, Amazon, NVIDIA, and Meta Platforms beat Q1 expectations by 9.45%, 43.26%, 18.80%, and 13.07%, resulting in SPY closing the gap to just 0.05 points today. However, I believe these explosive price gains are short-lived. The seven stocks above contributed 11% of SPY's 15% YTD price gain. If earnings surprises aren't great again in Q2, I expect these gains to reverse partially, opening the door for VIG to take the lead. It's simply much more balanced. The average YTD price gain for VIG's top 25 holdings is 11.12% compared to 29.05% for SPY.
Finally, and perhaps most importantly, one feature common to all three ETFs is high profitability. Each has either a 9.45/10 or 9.50/10 Profitability Score, which I derived using individual Seeking Alpha Factor Grades. NextEra Energy ( NEE ) is the only top holding without a perfect "A+" Grade, so even though VIG doesn't explicitly screen for profitability, it's the logical result when you only include companies that consistently raise dividend payments. If this keeps up, VIG should remain a solid long-term performer.
Investment Recommendation
VIG's fundamentals relative to SPY have slightly deteriorated since its March reconstitution. However, I believe it's only temporary, given that only a handful of mega-cap stocks are responsible for SPY's exceptional first half of 2023. The Q1 earnings season was the best we've had in a year, but remember that one quarter is not a trend. To prepare for a possible disappointment in Q2, consider VIG for its similar earnings growth and earnings momentum statistics and its 4.56-point discount on forward earnings. Therefore, I've decided to maintain my buy rating since I still see it as a solid portfolio. Thank you for reading, and I look forward to continuing the discussion in the comments section below.
For further details see:
VIG: Capture Growth, Value, And Quality With Vanguard's $68B Dividend Appreciation ETF