VOO - VIG: Dividend Growers Outperform The SPX On 3 Key Metrics
2023-11-19 09:51:31 ET
Summary
- The Vanguard Dividend Appreciation ETF has performed closely in line with the S&P500 since its inception in 2006, but should outperform in the future.
- VIG has cheaper valuations, is much more diversified, and has a history of lower volatility when compared with the S&P500.
- However, 10-year returns are likely to lag behind cash and bonds amid slowing nominal GDP growth downside mean reversion in valuations.
The Vanguard Dividend Appreciation ETF ( VIG ) seeks to track the performance of the S&P US Dividend Growers Index, which holds stocks, excluding REITs, that have a history of raising dividends for 10 consecutive years. Due to the exclusion of the top 25% of the highest yielding stocks, the VIG has performed more closely in line with the S&P500 itself since its inception in 2006, compared to other dividend focused ETFs. Aside from faster dividend growth, the VIG has three advantages that are likely to result in continued outperformance in terms of risk-adjusted returns relative to the S&P500. However, the ETF is still only likely to post returns in line with cash over the long term due to slowing growth and high interest rates.
VIG Valuations Are Cheaper Than The S&P500
While the VIG is by no means cheap, its forward PE ratio is 19x versus 20.8x for the S&P500. This 8% discount compares to an 8% premium at the start of the year. The VIG also has a higher free cash flow yield at 4.3% versus 3.8% for the S&P500.
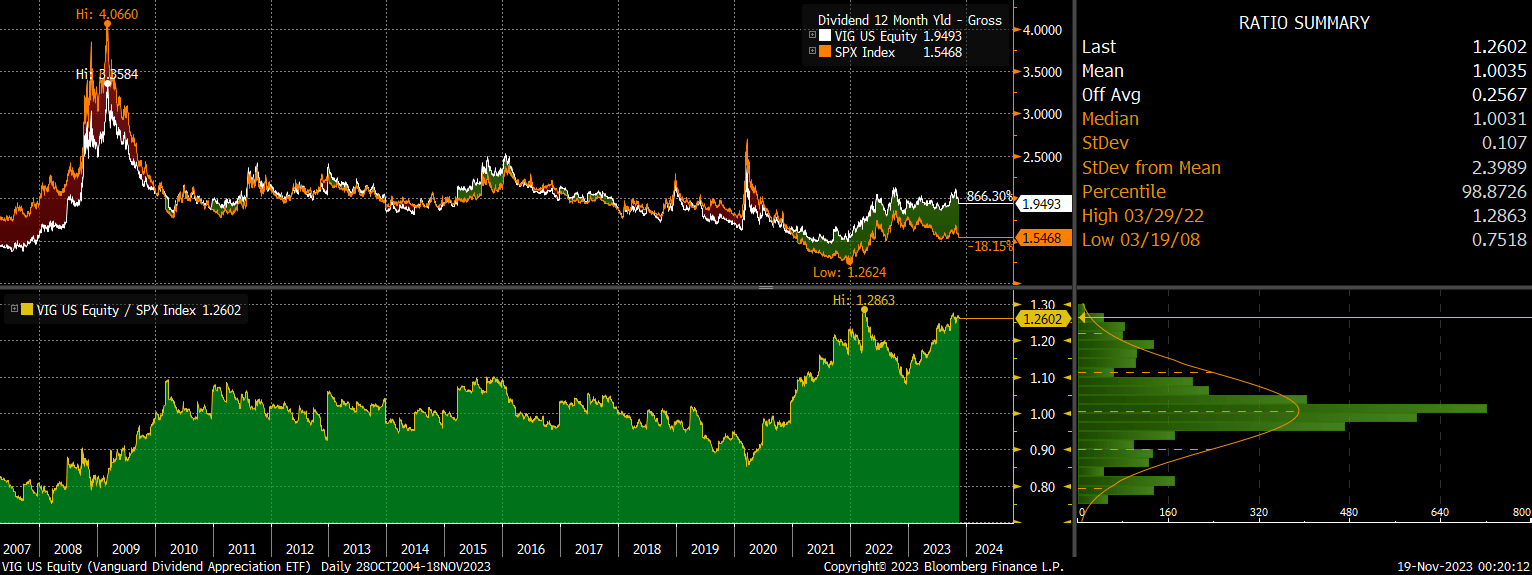
This valuation discount shows up in the VIG's dividend yield, which, at 2.0%, is now 0.4 percentage points and 26% higher than that of the Vanguard S&P 500 ETF ( VOO ). As the ETF excludes the top 25% highest-yielding companies, this is quite impressive and shows that this higher yield is not the result of large holdings of dividend traps.
VIG Is Much More Diversified With Less Exposure To Risky Mega Caps
This relative undervaluation and high dividend yield largely reflects the lower weighting of information technology and communication services stocks relative to the S&P500, as well as higher exposure to financial stocks. The VIG only holds two of the Magnificent 7 stocks, Apple and Microsoft, which make up less than 10% of the index compared to over 14% of the S&P500.
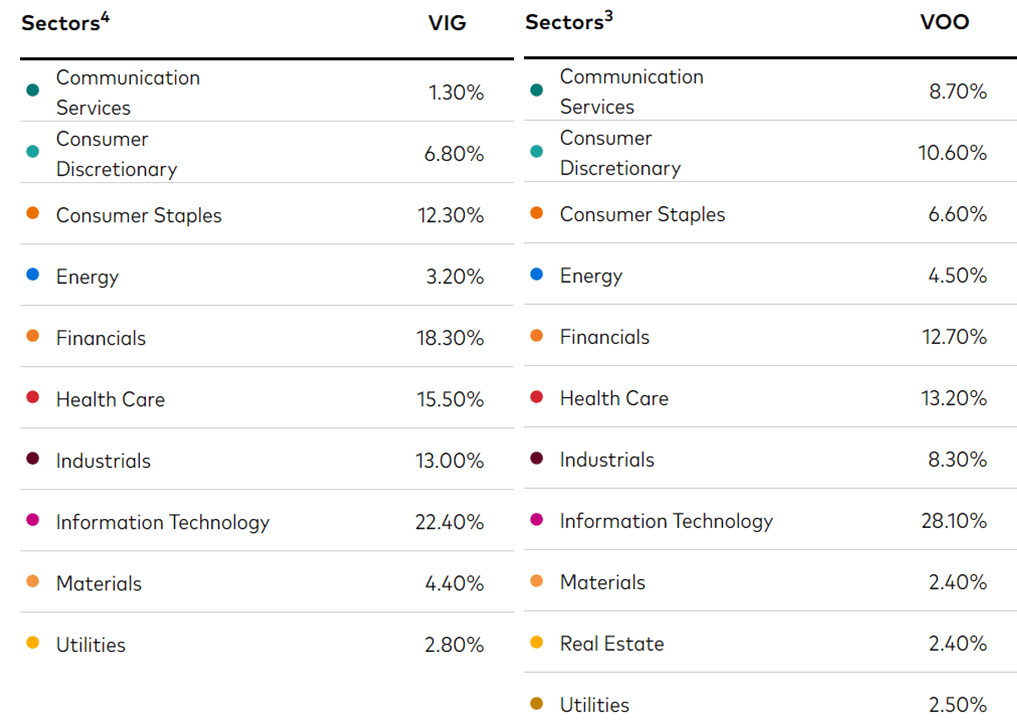
The Magnificent 7 stocks now account for a staggering 27% of the entire S&P500 and trade at PE ratios that are more than double the median S&P500 stock. Considering that the earnings of these 7 stocks already total $300bn, one fifth of the entire market, the market's view that these stocks can continue to grow faster than the overall market seems misplaced.
A History Of Lower Volatility
Cheaper valuations and lower concentration risk should allow the VIG to continue to display lower volatility than the S&P500. Despite posting similar total returns to the S&P500 since 2016, it has outperformed the benchmark in every single market downturn over this period. From a sharp ratio perspective, the VIG has therefore outperformed.
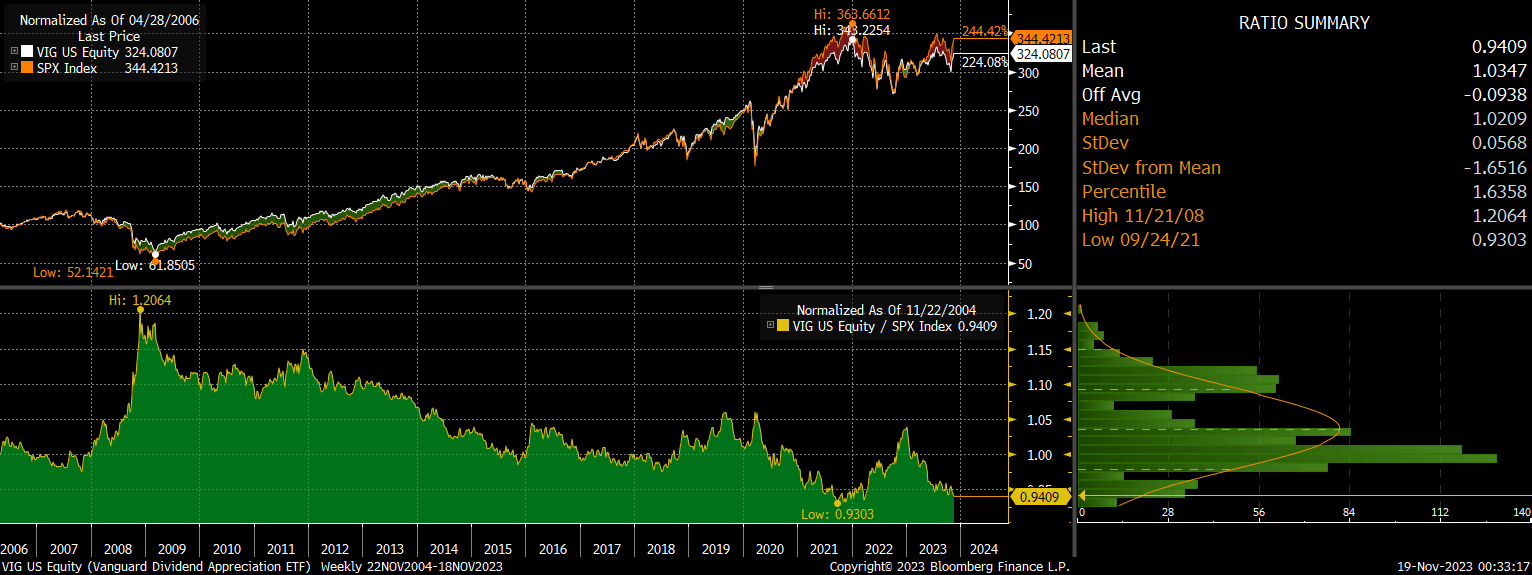
Keep in mind also that this historical lower volatility occurred when the dividend yield on the VIG was in line with the S&P500 or even lower. Going forward, the higher dividend yield should further help to reduce volatility relative to the benchmark.
Returns Still Likely To Lag Cash And Bonds
I expect the VIG to outperform the S&P500 by at least the 50bpp annual dividend yield advantage over the coming years, while stronger dividend growth and the potential for valuation mean reversion in tech should provide a percent or so of additional outperformance. However, the 10% annual returns seen over the past decade are likely a thing of the past. The 8% annual dividend growth rate seen over this period has occurred amid 5% nominal GDP growth and from a starting point of low dividend payouts relative to sales and earnings.
Nominal GDP growth is likely to move back below 4% over the coming years as 10-year inflation expectations are back at 2.3% and the structural drivers of real GDP growth (productivity and working age population growth) are running below 1.5% on a trend basis. We should also expect VIG dividend growth outperformance relative to GDP to slow, given how large dividend payouts have become relative to sales. Assuming a healthy 6% annual dividend growth rate, this would result in 8% total returns assuming no change in valuations. Considering that investors have typically required 4-5% excess returns over bonds on large cap US stocks, we should expect gradual downside pressure on valuations to drive 10-year returns below 5% annually.
For further details see:
VIG: Dividend Growers Outperform The SPX On 3 Key Metrics