VIG - VIG: Hedge Your Magnificent 7 Bets With This $84 Billion Dividend Growth ETF
2023-12-22 23:21:32 ET
Summary
- VIG is a high-quality dividend growth ETF that's not overly reliant on Magnificent 7 stocks. Expenses are just 0.06% and VIG has $84 billion in assets under management.
- Diversifying away from this group is crucial in 2024, as it's unlikely they'll account for all the market's gains for another year. Keeping quality high is the #1 priority.
- VIG does this well, and has a higher profit score than SPY when excluding the Magnificent 7. It also scores in the top 20% on dividend growth, consistency, and safety.
- Negatives include its 23.30x forward earnings valuation, representing only a slight discount to SPY, and comparatively weaker last quarter earnings results.
- Still, the positives outweigh the negatives, and I believe VIG provides good value heading into 2024. I reiterate my "buy" rating.
Investment Thesis
In September , I categorized the Vanguard Dividend Appreciation ETF ( VIG ) as a defensive dividend ETF most appropriate for investors with modest immediate income needs. I upgraded my rating after its Index reconstituted in March, and VIG has been one of the better-performing dividend ETFs since. However, today's article discusses whether VIG still has value heading into 2024. Briefly, its 23.30x forward P/E valuation represents only a minor discount compared to the SPDR S&P 500 ETF ( SPY ), and although its earnings growth and momentum metrics could be better, VIG still manages to maintain high-quality features despite limited exposure to Magnificent Seven stocks. Therefore, I still recommend dividend investors buy VIG, and I will provide a fundamental comparison with SPY, MOAT, SPHQ, DGRW, QUAL, and MGV in the article below.
VIG Overview
Strategy Discussion
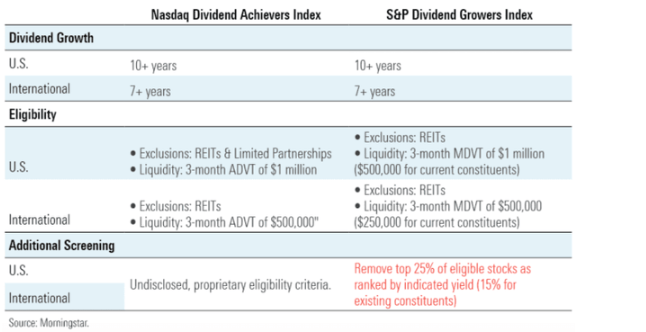
VIG tracks the S&P U.S. Dividend Growers Index, selecting U.S. stocks with ten consecutive years of dividend increases or more. This screen is surprisingly easy to achieve compared to five or ten years ago. Currently, the Index has 311 equity securities, including Apple ( AAPL ), a key addition from March. Additional criteria are summarized in the graphic below.
REITs are excluded, so all dividend income is qualified. The liquidity screen is standard, and previous analysis revealed that much of the year-to-year activity is linked to the dividend trap screen, bolded in red at the bottom right. The Index removes the top 25% of eligible stocks by indicated dividend yield (15% for existing constituents). In short, if a security's price dips too much, it's removed. This practice is supported by long-term data available at the Ken French Data Library, where securities in the top decile by yield tend to be poor performers across numerous decades. Note that high-dividend ETFs operate oppositely, where significant price declines are welcome because they improve a security's yield. That's not how VIG works, which helps to explain its low 1.86% dividend yield.
Another factor contributing to VIG's low dividend yield is its modified market-cap weighting scheme. Since Apple and Microsoft ( MSFT ) qualify, their market caps mean they are at the top of the holdings list. The Index places a 4% cap per security at each rebalancing, but there are enough qualifying mega-caps to keep the dividend yield low. Instead, VIG's objectives are capital appreciation and dividend growth, which are not mutually exclusive. Since dividends are paid out of earnings, consistently weak earnings growth will eventually limit dividend growth. This basic concept is why I always consider the growth factor for dividend ETFs, as dividend growth doesn't magically happen and is not based on the fund's history.
Analyzing Dividend ETFs: Willingness And Ability
You might have heard the terms "willingness" and "ability" used to describe an investor's risk tolerance. Generally, an advisor assesses both and chooses the most conservative one. This approach steers clients away from securities that jeopardize their investment objectives, even if it's not what they desire. I take a similar approach with dividend ETFs. I look for companies that want and can increase dividend payments.
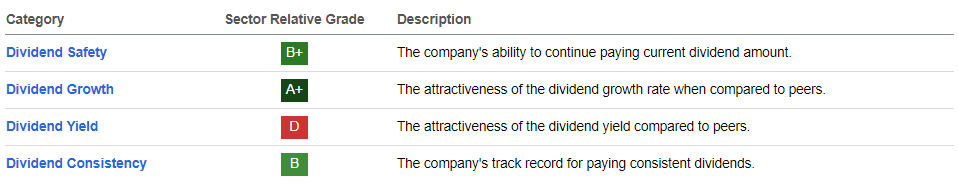
Seeking Alpha Dividend Grades provide an easy way to assess willingness and ability. In my view, the system works even better when evaluating ETFs because the risk of the system "getting it wrong" is spread out. Let's take a closer look, using Apple as an example.
The definition for the Dividend Safety Grade states that it's a measure of the company's ability to continue paying the current dividend amount. In contrast, the Dividend Consistency Grade reads more like a company's willingness to pay dividends, as does the Dividend Growth Grade. For me, the Dividend Yield Grade is the least useful, as it's only a function of a trailing dividend rate and current market price and does not incorporate any financial health metrics.
So, how does VIG compare with its peers? I calculated Dividend Scores for VIG and 369 diversified ETFs with weighted average market caps above $50 billion to find out. I converted the grade to a number between 1-10 to make the comparison easier. Here's how VIG ranks:
- Dividend Safety: #86/369
- Dividend Growth: #97/369
- Dividend Yield: #190/369
- Dividend Consistency: #8/369
On the three metrics I value most (Safety, Growth, Consistency), VIG's average ranking is #64/369, or better than approximately 83% of U.S. equity funds across all styles (value, dividend, blend, growth). That's pretty good, but it's important to know that dividend growth alone isn't a great predictive metric. In this same group, VIG ranks #90/206 on five-year total returns and #54/107 on ten-year total returns. Many of the top performers are plain vanilla growth funds, but several others take a multi-factor approach or are value-oriented, including:
- VanEck Morningstar Wide Moat ETF ( MOAT )
- Invesco S&P 500 Quality ETF ( SPHQ )
- WisdomTree U.S. Dividend Growth ETF ( DGRW )
- iShares MSCI USA Quality Factor ETF ( QUAL )
- Schwab U.S. Dividend Equity ETF ( SCHD )
- Schwab Fundamental U.S. Large Company ETF ( FNDX )
The one factor common to these six alternatives is a high profit score, which I calculated using Seeking Alpha Profitability Grades. Consider these average annualized ten-year returns when I categorize an ETF, regardless of its style, into profit score buckets (approximately 11 ETFs per bucket).
- Profit Score: 7.62-8.22, Average Annualized Return: 8.25%
- Profit Score: 8.23-8.64, Average Annualized Return: 9.26%
- Profit Score: 8.65-8.89, Average Annualized Return: 9.51%
- Profit Score: 8.90-9.03, Average Annualized Return: 9.78%
- Profit Score: 9.03-9.09, Average Annualized Return: 10.43%
- Profit Score: 9.10-9.24, Average Annualized Return: 10.74%
- Profit Score: 9.25-9.39, Average Annualized Return: 10.46%
- Profit Score: 9.39-9.48, Average Annualized Return: 11.36%
- Profit Score: 9.54-9.68, Average Annualized Return: 13.08%
- Profit Score: 9.72-9.95, Average Annualized Return: 13.34%
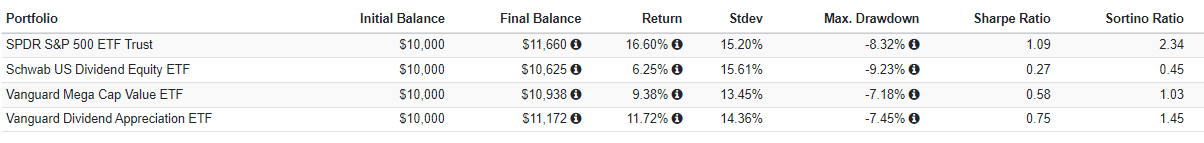
As mentioned, most top performers are growth ETFs like the Invesco QQQ ETF ( QQQ ) and its 9.66/10 profit score. However, there are several value/blend ETFs with solid track records, like SCHD, SPY, and the Vanguard Mega Cap Value ETF ( MGV ), which yields 2.42% and has a 9.42/10 profit score. These are possible alternatives, and as you can see, their track records are decent.
At a minimum, this performance chart is cause for a periodic evaluation of VIG, as there may be better choices. VIG has done relatively well since its Index reconstituted in March, considering its limited exposure to Magnificent Seven stocks. However, as I'll discuss shortly, a few yellow flags are worth reviewing.
VIG Analysis
Top Ten Holdings and Sector Exposures
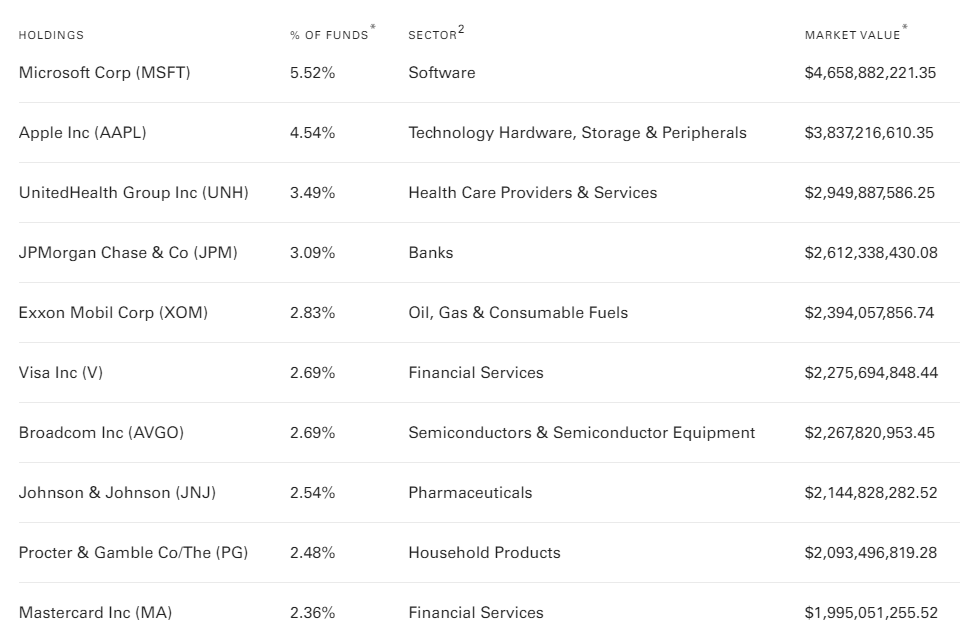
VIG's top ten holdings, led by Apple and Microsoft, are listed below. They're above the 4% maximum weighting, which will be corrected at the next rebalancing. UnitedHealth Group ( UNH ), JPMorgan Chase ( JPM ), and Exxon Mobil ( XOM ) round out the top five.
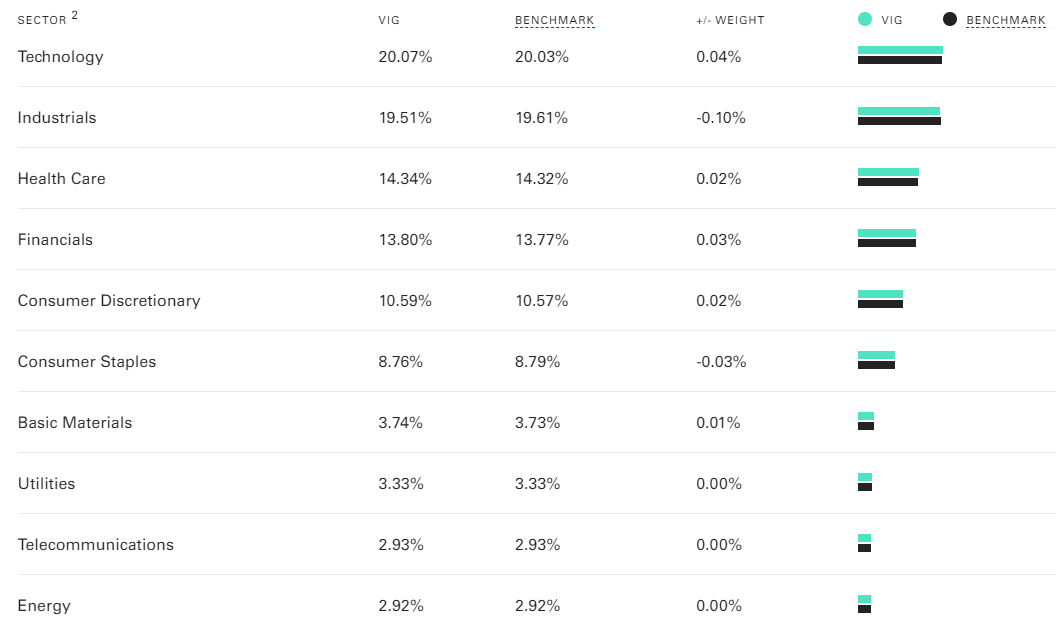
Exxon Mobil accounts for virtually all of VIG's Energy sector exposure. VIG's low allocation to this sector is the opposite of what you'll find among high-dividend ETFs. Most stocks in this sector trade at cheap valuations, whereas Technology stocks are mainly fast growers with relatively high valuations. As shown below, Technology is VIG's largest sector, followed by Industrials and Health Care at 19.51% and 14.34%, respectively.
Sector Snapshot
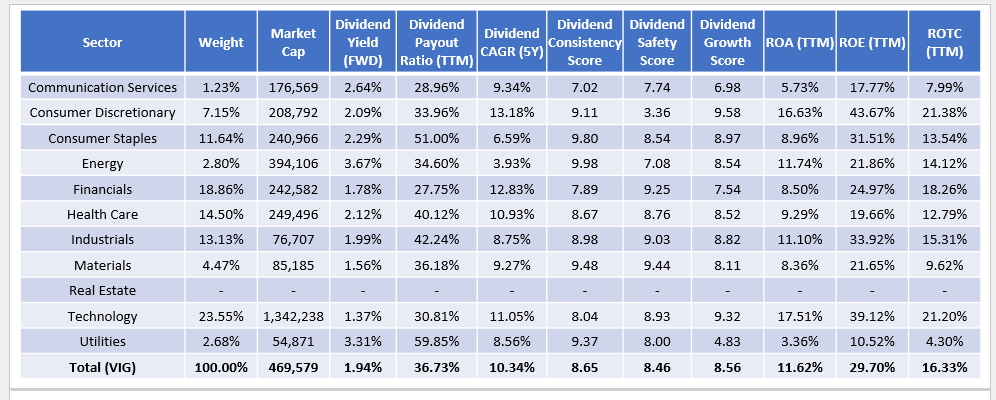
Before diving deeper into VIG's fundamentals, I want to provide a sector snapshot of the fund focusing on dividends and profitability. Here, we can get a solid idea of where VIG gets its features. For example, only two sectors (Energy and Utilities) have weighted average dividend yields above 3%, but they have minimal weightings. Instead, VIG is about dividend consistency, safety, and growth, with Consumer Staples, Health Care, Industrials, and Technology responsible for the lion's share.
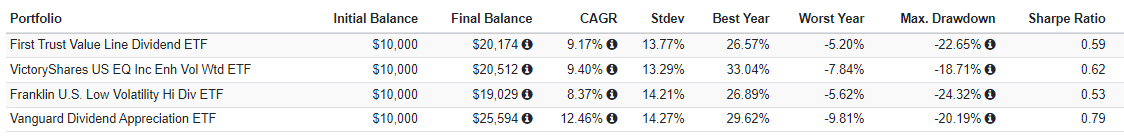
Consumer Discretionary and Technology have the highest return on total capital figures (21.38% and 21.20%). It's one piece of evidence that at least some growth stocks are needed to form a high-quality fund. Portfolios that substantially overweight Utilities, for example, tend to be low quality. To illustrate, the Utilities Select Sector SPDR ETF ( XLU ) has a 6.60/10 profit score. The First Trust Value Line Dividend ETF ( FVD ), the VictoryShares US EQ Income Enhanced Volatility Weighted ETF ( CDC ), and the Franklin U.S. Low Volatility High Dividend ETF ( LVHD ) are all examples of ETFs with high Utilities sector exposure but relatively long-term poor results compared to VIG since February 2016.
Sidenote: Why Invest For Dividends?
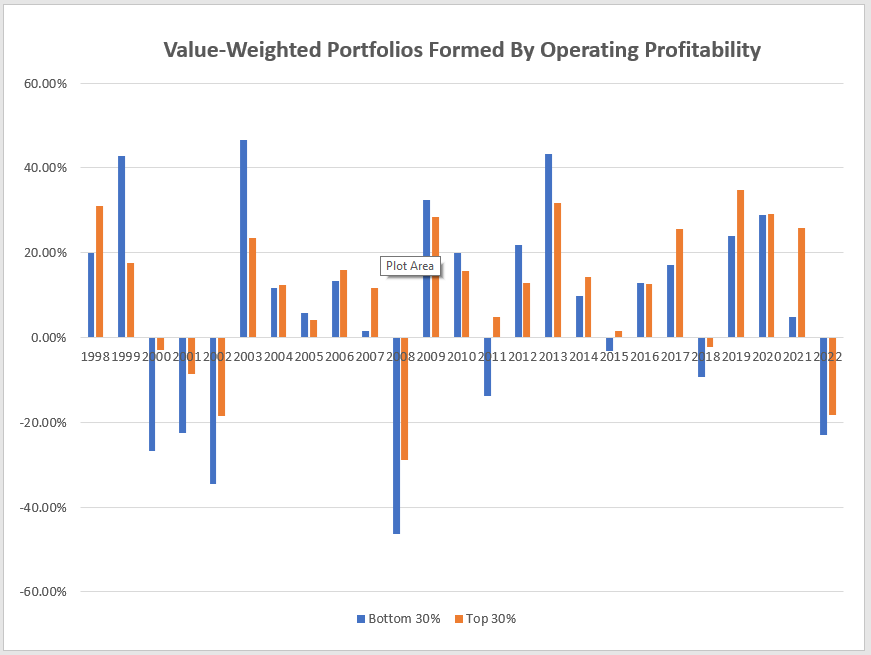
Based on the above results, it's easy to blame dividends. In fact, you might assume that investors must choose between dividends and total returns. However, I view profitability as the common problem, and dividend strategies sometimes sacrifice too much. That wasn't the case in the early 2000s when the largest U.S. stocks weren't profitable. To support this argument, consider these average annual returns for three value-weighted portfolios formed based on operating profitability for the 25 years between 1998-2022:
- Bottom 30%: 7.07%
- Middle 40%: 9.53%
- Top 30%: 10.96%
I've sourced these results from the Ken French Data Library at this link . Not only did the higher-quality portfolio outperform by an average of 3.89% per year, but it did so with fewer extremes. Take 1999, for example, when the low-quality portfolio gained 42.73% compared to 17.58% for the high-quality portfolio. That was a great year, but the reversal was swift, with the low-quality portfolio declining by 26.86%, 22.44%, and 34.66% between 2000-2002. We see similar patterns in the years following 2003, 2009-2010, and 2013. Even in 2020, when, logically, low-quality stocks should not have performed well, they still gained 28.86%. However, they underperformed by 21.01% in 2021 and 4.68% in 2022.
Given these findings, I recommend avoiding getting boxed into a particular style (value, dividends, blend, growth) and focusing on profitability first and foremost. Sometimes, investors might need to deviate to address an investment objective or a personality trait such as a tendency to panic sell. For example, some income investors need to see a growing stream of dividends regularly hit their accounts, even if they choose to reinvest them. The benefits are mainly psychological, and if you are prone to panic selling, dividend growth investing is a reasonable strategy.
VIG's Sub-Industry Fundamentals
Turning back to VIG, the following table highlights selected fundamental metrics for its top 25 sub-industries, totaling 74.58% of the fund. Compared to many of the high-quality funds listed earlier, it's a good level of diversification. VIG's 0.92 five-year beta suggests it's slightly less volatile than the broader market, whereas MOAT, SPHQ, and QUAL are closer to SPY.
I have a few observations:
1. I mentioned earlier how dividend growth was not independent of earnings growth. With VIG, estimated earnings per share growth is 7.50%, while historically, constituents have grown dividends by an annualized 10.34% over the last five years. Compared with the alternatives, it's pretty good. SPY, SPHQ, and QUAL have better combinations, but their starting gross dividend yields are 0.45-0.68% less, even without accounting for expenses. DGRW is about the same, and its track record proves that dividend strategies can beat SPY over the long run when quality is maintained. Finally, I'm disappointed in MGV's earnings and dividend growth metrics, which are 5.55% and 7.88%, respectively. It's not a great option if you're a dividend growth investor.
2. VIG's profit score is 9.40/10, and without the Magnificent Seven, it's 9.31/10. On the other hand, SPY's 9.41/10 score drops to 9.15/10 without them, a 0.26-point drop. Scores for the other ETFs listed, ex-Magnificent Seven, are as follows:
- MOAT: 8.74 to 8.67
- SPHQ: 9.86 to 9.76
- DGRW: 9.34 to 9.23
- QUAL: 9.66 to 9.56
- MGV: 9.42 to 9.42 (no exposure, no change)
The takeaway is that the Magnificent 7 stocks are vital to maintaining SPY's high quality, whereas, for the others, they aren't. VIG and these alternatives are ways to hedge your bets while keeping quality high.
3. VIG trades at 23.30x forward earnings, four points less than SPY. Given how DGRW and MGV trade at 22.69x and 18.93x forward earnings, it isn't a significant discount. Therefore, it's hard to argue for VIG and not DGRW, so I'm also using this opportunity to rate DGRW as a buy . SPHQ also looks competitive from a value/quality perspective, with a possible detractor being its 1.50% gross dividend yield (1.35% net).
4. One negative is how VIG's constituents reported comparatively weak earnings results last quarter. Sales and earnings surprises were 0.47% and 5.93% compared to 1.31% and 8.29% for SPY, and these results might lead to lower earnings revisions shortly. Semiconductors ( AVGO , QCOM , TXN ) is one sub-industry to watch. Broadcom is soaring as investors flock to AI stocks, but the results aren't there yet. As shown below, the company missed earnings expectations last quarter, and most analysts (16/18) have downgraded earnings estimates for the next quarter.
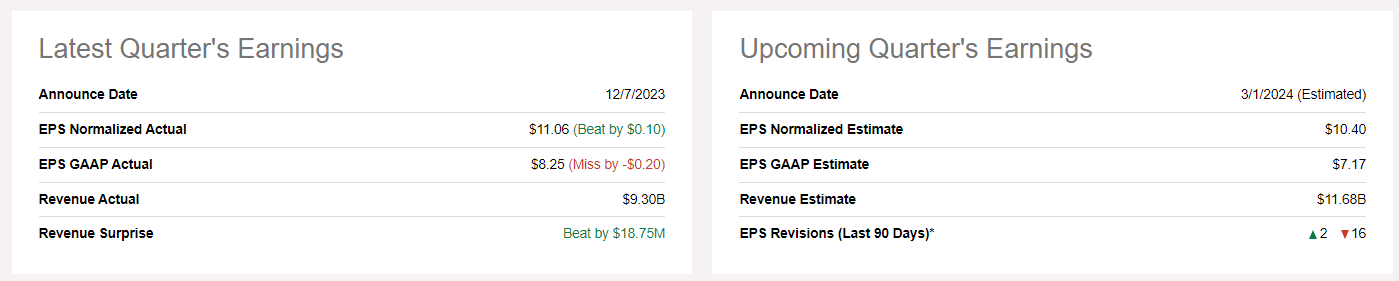
Investment Recommendation
VIG has value heading into 2024 because it does not overly rely on Magnificent Seven stocks. These stocks comprise 28.13% of SPY and are responsible for all the Index's gains this year, so hedging your bets makes sense. I also highlighted how quality is a key driver of long-term returns, so I encourage readers to take a style-neutral investment approach. That means going where the profits flow, regardless of whether you're a value, dividend, or growth investor. In the early 2000s, dividend stocks fit the bill. Nowadays, growth stocks are among the most profitable. VIG includes many of these, and even without the Magnificent Seven, its 9.31/10 profit score is solid.
You may deviate from quality to achieve another objective, but remember there are usually tradeoffs. SPHQ's holdings have excellent earnings and dividend growth rates, but its starting dividend yield is the same as SPY and is less diversified. MGV takes care of the dividend yield and value problems, but low earnings growth suggests low dividend growth, and the chances of it substantially underperforming in bull markets are high. SCHD is in a different category, offering an impressive 3.53% trailing dividend yield but an earnings growth rate of around 3%. It's no wonder it's struggled this year, and a turnaround largely depends on value investing coming into favor again. Getting the timing right is too difficult, so I prefer a multi-factor approach. With this in mind, VIG and DGRW score well on numerous metrics without relying on a small number of stocks, and for this reason, I've decided to keep my "buy" rating. Thank you for reading, and I look forward to your comments.
For further details see:
VIG: Hedge Your Magnificent 7 Bets With This $84 Billion Dividend Growth ETF