VIG - VIG Vs. SMDV: Going Small Poor Choice In Dividend Growth World
2023-06-30 07:00:00 ET
Summary
- The Vanguard Dividend Appreciation ETF invests based on the S&P U.S. Dividend Growers Index.
- The ProShares Russell 2000 Dividend Growers ETF invests based on the Russell 2000 Dividend Growth Index.
- Dividend Growth ETFs are popular among Seeking Alpha users, with three large-cap ETFs often outperforming the small-cap ProShares Russell 2000 Dividend Growers ETF.
- Differences in sector allocations and market-cap are key factors in explaining the return differences between the large-cap ETFs and the small-cap SMDV.
- Recent results also indicate that these dividend growth focused ETFs provide little advantage over the plain vanilla ETFs using the board index used by the other ETFs.
(This article was co-produced with Hoya Capital Real Estate )
Introduction
Dividend Growth ETFs are covered often by various Seeking Alpha contributors for a good reason: they are also widely followed by users of the Seeking Alpha platform. There are three popular Large-Cap ETFs I am familiar with, in order by Seeking Alpha followers:
- WisdomTree U.S. Quality Dividend Growth Fund ETF ( DGRW )
- iShares Core Dividend Growth ETF ( DGRO )
- Vanguard Dividend Appreciation Index Fund ETF ( VIG )
Since 2015, all three have done better for investors than the Small-Cap investing ProShares Russell 2000 Dividend Growers ETF ( SMDV ). If today mirrors their historical allocations, there are differences besides size that could explain the performance difference. While all four ETFs with be touched on during this review, the main comparison will be between the VIG ETF and the SMDV ETF.
Vanguard Dividend Appreciation Index Fund ETF review
Seeking Alpha describes this ETF as:
The investment seeks to track the performance of the S&P U.S. Dividend Growers Index that measures the investment return of common stocks of companies that have a record of increasing dividends over time. The adviser employs an indexing investment approach designed to track the performance of the index, which consists of common stocks of companies that have a record of increasing dividends over time. VIG started in 2006.
Source: seekingalpha.com VIG
VIG has $68.2b in AUM and Vanguard charges 6bps in fees. The TTM Yield is 1.9%.
Index review
Understanding the index is critical to knowing the ETF. S&P describes their index as:
The S&P U.S. Dividend Growers Index is designed to measure the performance of U.S. companies that have followed a policy of consistently increasing dividends every year for at least 10 consecutive years. The index excludes the top 25% highest-yielding eligible companies from the index.
Source: spglobal.com index
The index methodology document expands on the rule inclusion rules.
Companies classified as part of the Global Industry Classification Standard (GICS) Real Estate Investment Trust Industry (REITs), are excluded. Constituents are float-adjusted market capitalization weighted, subject to a single constituent weight cap of 4%. Any excess weight is proportionally redistributed to the uncapped constituents. This process proceeds iteratively until no constituent violates the 4% cap.
Source: spglobal.com index methodology
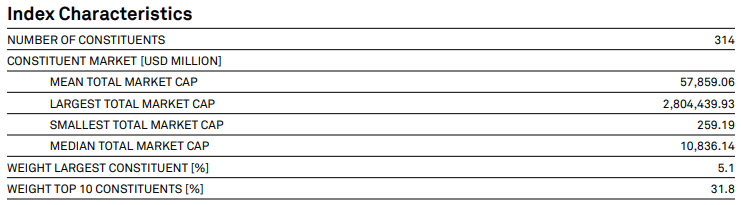
Some basic data about the index provided by S&P are:
spglobal.com index PDF
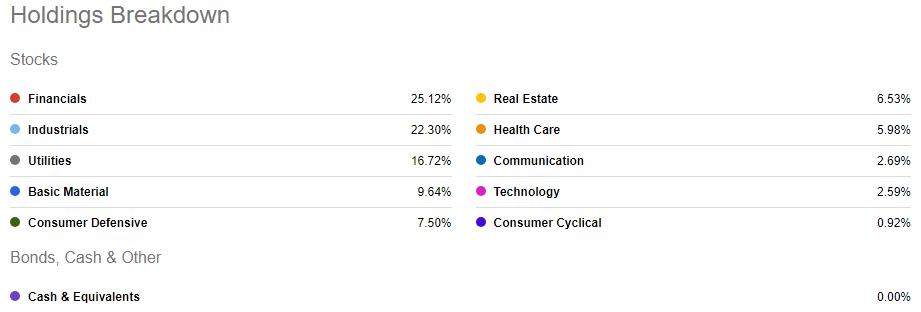
VIG holdings review
seekingalpha.com VIG sectors
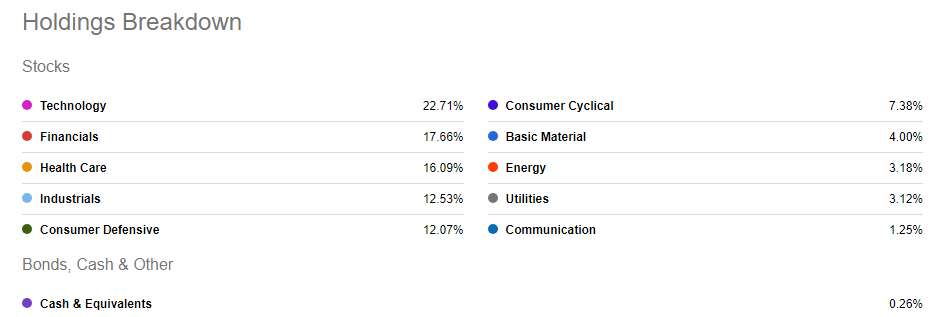
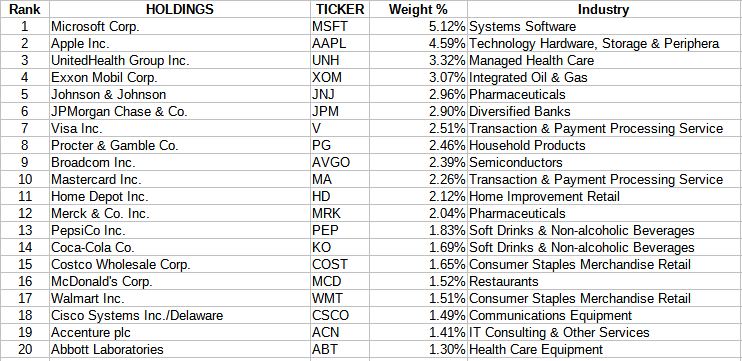
Compared to a non-factored S&P 500 ETF like the Vanguard S&P 500 ETF ( VOO ), VIG has a lower allocation to Technology stocks, which is not surprising since some pay no dividends. Financial and Industrials climb in allocation when compared to VOO. Vanguard also provides descriptions listed as sectors but more like industries. The Top 11 account for 50% of the portfolio:
advisors.vanguard.com; compiled by Author
The Top 20 stocks represent 49% of the portfolio.
advisors.vanguard.com; compiled by Author
VIG currently holds 314 stocks; the smaller half only provide 5% of the weight, which results in little effect on VIG's performance.
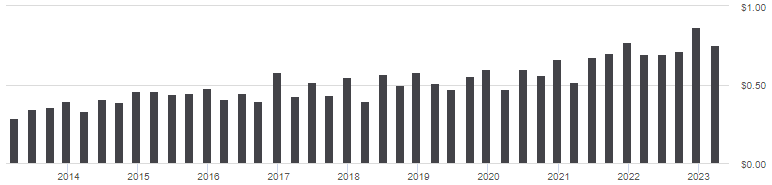
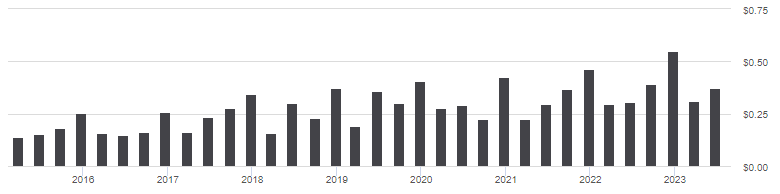
VIG distribution review
seekingalpha.com VIG DVDs
With a current yield below 2%, dividend appreciation/growth funds are not held for the income, but the growth of that income, which should assist in positive performance for the ETF overall. VIG has grown its dividends by 7.82% over the past decade; even more over the past five years: 9.87%. This are garnered VIG an "A+" grade from Seeking Alpha.
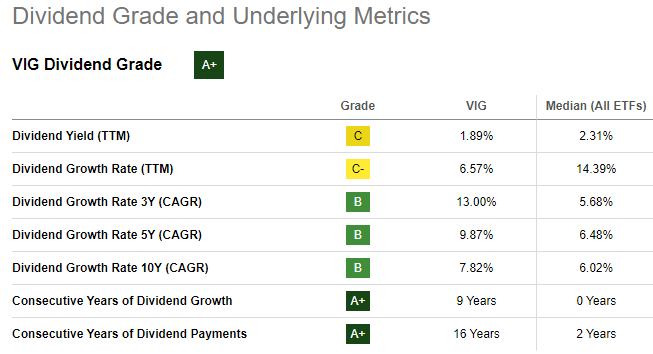
seekingalpha.com VIG scorecard
ProShares Russell 2000 Dividend Growers ETF review
Seeking Alpha describes this ETF as:
The fund invests in growth and value stocks of small-cap companies. It invests in dividend paying stocks of companies. The fund seeks to track the performance of the Russell 2000 Dividend Growth Index . The index contains a minimum of 40 stocks, which are equally weighted. No single sector is allowed to comprise more than 30% of the index weight. SMDV started in 2015.
Source: seekingalpha.com SMDV
SMDV has $792m in AUM and costs investors 40bps in fees. The TTM Yield is 2.82%.
Index review
The index targets companies that are currently members of the Russell 2000 Index and have increased dividend payments each year for at least 10 years. The index contains a minimum of 40 stocks, which are equally weighted. No single sector is allowed to comprise more than 30% of the index's weight. If there are fewer than 40 stocks with at least 10 consecutive years of dividend growth, the index will include companies with shorter dividend growth histories. The index is rebalanced each March, June, September and December, with an annual reconstitution during the June rebalance.
Source: proshares.com index
SMDV holdings review
seekingalpha.com SMDV sectors
SMDV currently holds 102 stocks, meaning some are not in the index. SMDV adjusts holdings and rebalances to equal weight each quarter. That said, the lowest weight currently is .80% just before the quarter ends. So unlike VIG, every stock effects the results. The SMDV holdings list did not include sector data.
proshares.com; compiled by Author
SMDV distribution review
seekingalpha.com SMDV DVDs
Probably slightly hampered by not having 10 years of data, Seeking Alpha gives SMDV a "B+" grade for their payout results.
seekingalpha.com SMDV scorecard
SMDV payouts are growing slower than what VIG investors have experienced over the last 3- and 5-year periods.
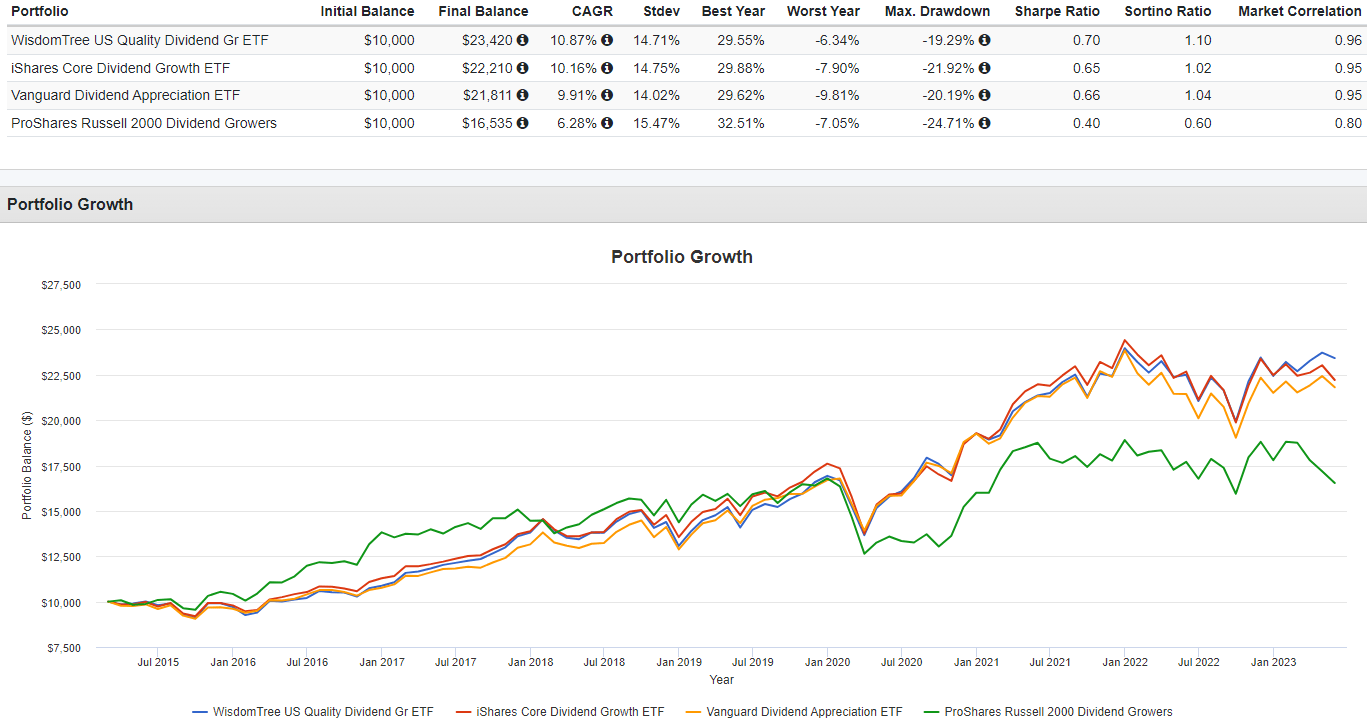
Comparing ETFs
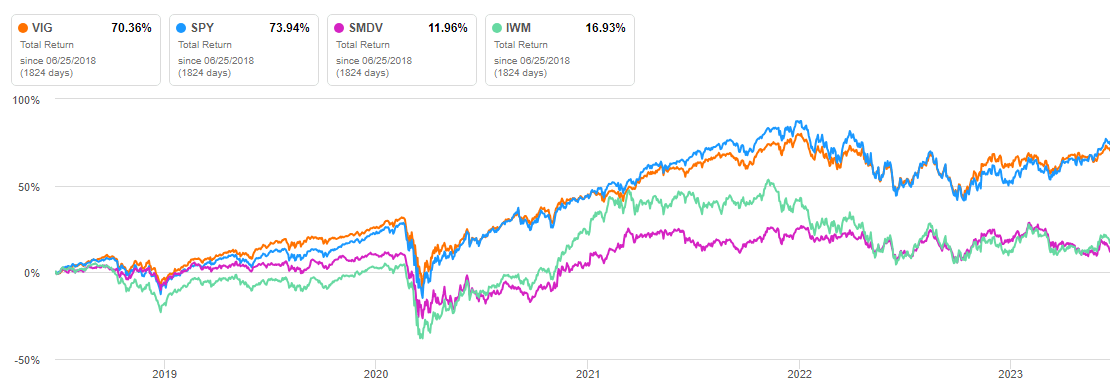
Since I hope to decipher why the Small-Cap strategy has been inferior since SMDV started lagging behind post-COVID, I included the other Large-Cap ETFs mentioned earlier.
PortfoloVisualizer.com
SMDV is the newest of the four ETFs, limiting the data back to March 2015. It was holding its own against the Large-Cap ETFs up until COVID struck, but has recovered slower since, thus one piece to the lagging performance puzzle is the higher perceived risk of smaller stocks.
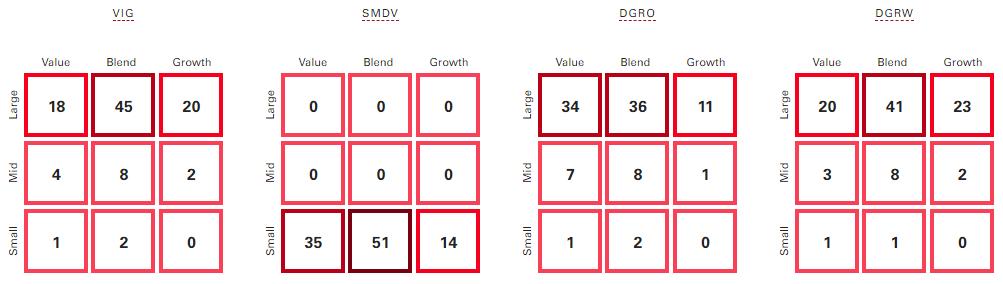
The next chart shows both market-cap allocations and the Growth/Value, as defined by Vanguard, of the four ETFs.
advisors.vanguard.com compare
While the three Large-Cap ETFs align on market-cap, there are wide differences in their allocations between Growth and Value stocks. While reminding readers that the current allocation might not reflect the past, it is probably close and thus it means the Growth/Value differences most likely didn't alter the returns between these ETFs. When comparing SMDV to DGRO, we see the current similar Growth//Value allocation doesn't seem to explain the return difference; making market-cap the prime "suspect".
Next I looked at the sector allocations.
Morningstar.com; compiled by Author
To get a simpler comparison, I used a difference source and only VIG and SMDV. Five of the eleven sectors differ by 10+% and become the new prime suspect explaining the return difference.
ETFRC.com
SMDV is overweight Financials and Utilities, neither of whom perform well in a rising interest rate market. Add the underweight in Technology stocks, who have done well in 2023, and thus lies a "smoking gun" as they would say in a detective movie.
I did look at one more set of data, commonly used to evaluate equity funds.
Morningstar.com; compiled by Author
Generally speaking the data validates the Growth/Value allocations pulled from Vanguard for the ETFs.
This is how I read the results, others might read the "evidence" differently and look forward to such comments.
- Sector allocation differences are the lead suspects in why returns no longer match.
- The decision for SMDV to "go small" has not been good since COVID.
- Allocations between Growth and Value stocks do not show a consistent pattern since all three Large-Cap are close in return but their allocations between these two stock classifications.
- While the current yield is higher, SMDV is underperforming in the main reason investors probably own these ETFs: dividend growth.
Portfolio strategy
Starting with the idea that investors own dividend growth/appreciation ETFs not for income, either now or in the future, the best strategy is owning the ones with the highest dividend growth rates (duh!?). That said, as mentioned, that is only one factor that drives CAGR, the ultimate measure of a ETFs success for its investors. Factors like market-cap and sector allocations become as important (or even more so) than how fast the dividends are growing and that analysis should be part of any due diligence.
A very important question to also ask and research is a simple one: "Do dividend growth/appreciation ETFs perform better than their plain index ETF counterpart?". The next chart, using five years of data, says stay with the plain vanilla ETF in both cases.
seekingalpha.com charting
Most of the shorter timeframes show the same results but not 100% of the time.
Final thoughts
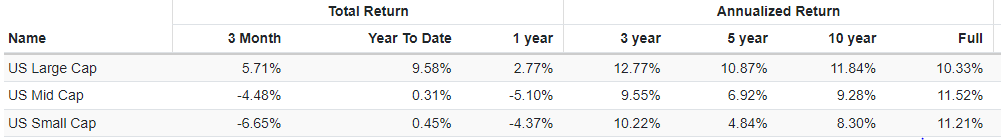
While the above results indicate Large-Cap stocks provide better results, longer history back 50+ years favor Mid- and small-Cap stocks.
PortfolioVisualizer.com
The point being which stocks are the best changes over time. I remember (or heard about) the "Nifty Fifty", the 50 stocks to buy and hold forever from the 1960s/70s. As reviewed in another Seeking Alpha Contributor's article , that hasn't worked out well.
For further details see:
VIG Vs. SMDV: Going Small Poor Choice In Dividend Growth World