VIG - VIG: What My $2 Million Investment Fund Is Buying Now
2023-03-21 07:00:00 ET
Summary
- The banking crisis isn't over, though it does appear to be mostly contained.
- A contraction in bank lending is expected to put the US into a recession in the next few months.
- US earnings declines could force the stock market to fall 12% to 29%. But the world's best dividend blue chips can help you sleep well at night no matter how bad things get.
- Vanguard's Dividend Appreciation ETF owns 300 of the world's best aristocrats and future aristocrats. Since 2006 it's been growing its dividends every year, something not even the aristocrat ETF has done.
- VIG is 14% historically undervalued, and offering 13% to 14% long-term return potential. It's a potentially very strong buy for anyone seeking the ultimate Ultra SWAN ETF for this recession. My family's $2 million investment fund is buying it right now, and you should consider potentially doing the same.
This article was published on Dividend Kings on Monday, March 20.
After a rather exciting week, the weekend brought plenty of new information for investors to digest.
Here's a quick update on the banking crisis of 2023 and what it means for the economy, and how my family's $2 million investment fund is responding.
Banking Crisis Update
The biggest news is the government-sponsored takeover of Credit Suisse ( CS ) by UBS ( UBS ) on Sunday.
- $3.25 billion all-stock deal
- $9 billion in government backstops against legal claims and losses
- $108 billion credit line from the Swiss National Bank
- $17 billion of CS's riskiest bonds are being written down to zero
Credit Suisse investors are getting taken out at effectively $0.8 per share, or a 60% haircut from Friday's close.
Why was this deal necessary? Because Credit Suisse has been struggling through a 16-year turnaround, and the bond market was estimating a 31% chance that CS was going to fail within a year.
Last week they saw $11 billion in deposit outflows and nearly $500 million coming out of their mutual funds.
For context, that's a rate that's 5X higher than last year, and the outflow was expected to accelerate this week.
The Swiss Government coordinated this deal with central banks from around the world to make sure that if it needed any further help providing liquidity central banks would do so.
Sunday night the central banks of Canada, the US, UK, European Union, and Japan announced additional dollar liquidity swap line access to ensure that any major global bank that needs liquidity can get it.
First Republic's Troubles Grow
Last week S&P, Fitch, and Moody's all downgraded First Republic ( FRC ) to junk, and S&P downgraded them a second time on Sunday night.
- first downgrade from A- stable to BB+ negative outlook
- second downgrade from BB+ to B+ negative outlook
- from 2.5% bankruptcy risk to 25% risk in a week
- S&P says if the outflows continue FRC could be downgraded further
Most likely Fitch and Moody's will be following suit this week.
Why are the rating agencies continuing to slash FRC's rating despite a $30 billion deposit backstop from 11 banks?
Bloomberg
Because these $30 billion in deposits have been pledged for 120 days and don't solve the main issue for FRC.
On March 15, FRC had an SEC filing in which it disclosed it had borrowed about $100 billion from the Fed and other government agencies in the past week.
The bank's total liquidity across its credit lines at JPM and the Fed's new lending program plus $34 billion cash (on March 15th) comes to roughly $200 billion.
That's more than the $176 billion in deposits FRC had before the crisis began.
In other words, FRC isn't facing a liquidity crisis per se. It has enough access to cash to pay out every depositor all their money if they want it. The trouble is that FRC appears to be facing a bank run.
With FRC tapping 50% of its $200 billion in liquidity in a single week, it appears that around 50% of FRC's deposits have fled in the last week.
This creates two problems for FRC. First, even if outflows stopped entirely, its profitability is now so hampered that its equity is likely worth around zero.
A bigger problem is that most of the Fed lending programs it tapped were in the form of a 60-day loan that must be repaid with 4.75% interest within 65 days or else the Fed will liquidate FRC.
With rating agencies slashing its ratings, and rumors swirling that FRC is trying to sell stock in a private offering (highly dilutive) the stock price has been crashing.
All this has been fueling the bank run that's caused its deposits to potentially fall 50% in a week.
The most likely outcome will be the government trying to put together a takeover of FRC by a larger bank sometime in the next two months.
- most likely over a weekend just like we saw with Credit Suisse
FRC is the 15th largest bank in the country, with assets and deposits slightly larger than SVB.
- SVB's VC clients have been returning in droves now that the FDIC guarantees all deposits
- Secretary of the Treasury Janette Yellen says uninsured deposits at banks other than SVB and Signature are still at risk
So what does this mean for the overall banking system, economy, and stock market?
What's Next For US Banks?
According to the New York Times, FRC is now trying to sell all or part of itself, potentially to a private equity firm (like Blackstone).
FDIC has just announced that Signature Bank's 100% insured deposits are being taken over by New York Community Bancorp ( NYCB ).
According to a recent study, 186 regional banks are at risk of failing.
For context, there are 4,154 banks in the US insured by the FDIC.
Janet Yellen has said that the FDIC is not insuring all deposits for all banks though a coalition of midsize banks has requested this for two years.
No Signs Of A Global Financial Crisis
Ycharts
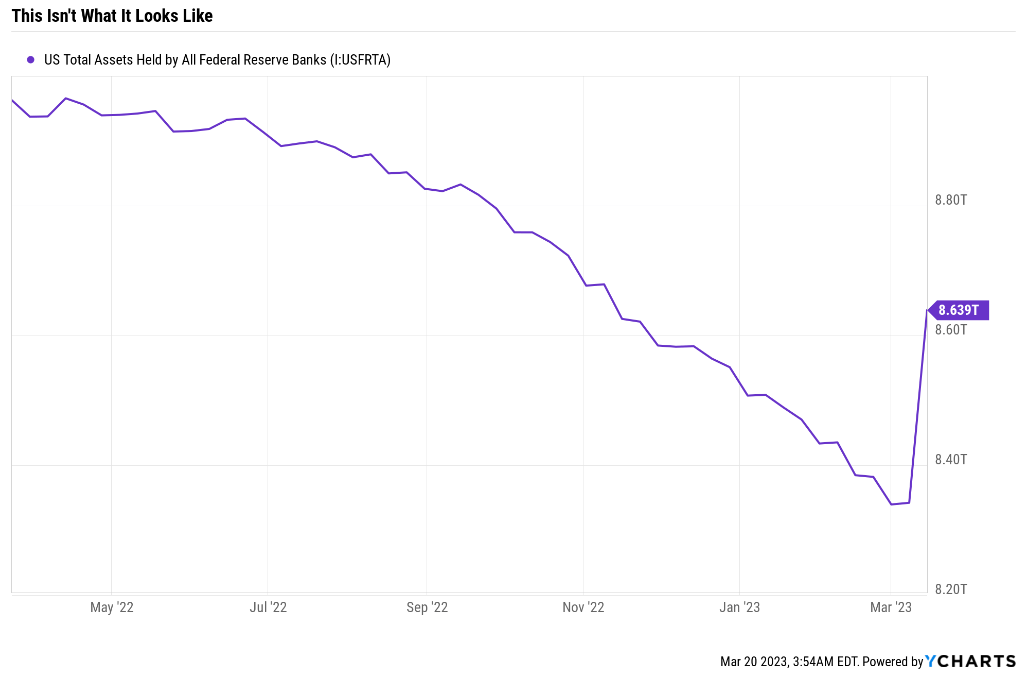
Last week Twitter was abuzz about the $300 billion increase in the Fed's balance sheet and how this was effectively the return of QE.
Actually, according to Bloomberg, it's not QE because what happened was that banks tapped the Fed for $300 billion in loans.
- $12 billion under the new Fed lending facility
The way QE works is the Fed prints money to permanently buy bonds that sit on its balance sheet and get reinvested once they mature.
This increase in the balance sheet from bank lending facilities is temporary.
- most of these loans are for 30 days or less
- once the loans are repaid, the Fed destroys the "new money"
In other words, this temporary increase in the Fed's balance sheet doesn't signal a financial catastrophe is brewing. How can we tell?
Ycharts
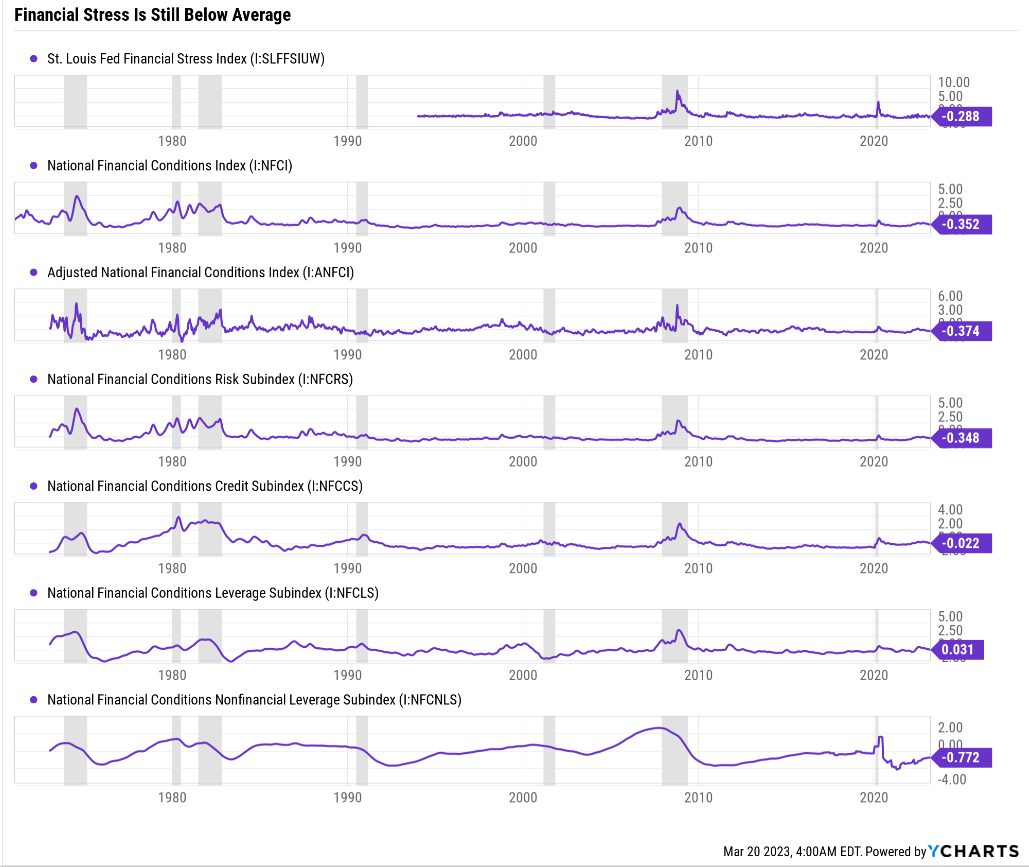
The St. Louis and Chicago Fed maintain weekly financial stress indexes that cover over 130 metrics. Everything from yield curves to credit spreads to loan default rates for every kind of loan.
Zero is the average since 1993 (for St. Louis Fed) and 1973 (for Chicago Fed) and during recessions and financial crises financial stress tends to rise to 1+.
Across all but a single metric, they are all negative, indicating below-average financial stress.
The only metric that isn't negative is 0.03, basically at the historical average.
In other words, when you actually look at the data, rather than dramatic headlines or Twitter, there's no indication of a rampaging financial crisis that threatens to bring about a severe recession like 2008.
What About The Economy?
Goldman Sachs believes that the regional banking crisis in the US will result in regional banks pulling back on lending significantly and equaling 25 or 50 basis points worth of additional Fed rate hikes.
Bank of America believes that while the risk of a US banking contagion is low small banks will significantly pull back on lending to small businesses, which employ 50% of Americans.
Thus BAC expects unemployment to rise in the coming months, which is what the Fed wants to combat inflation.
The recession the bond market expected in the first half of 2024 has now been moved up to the second half of 2023.
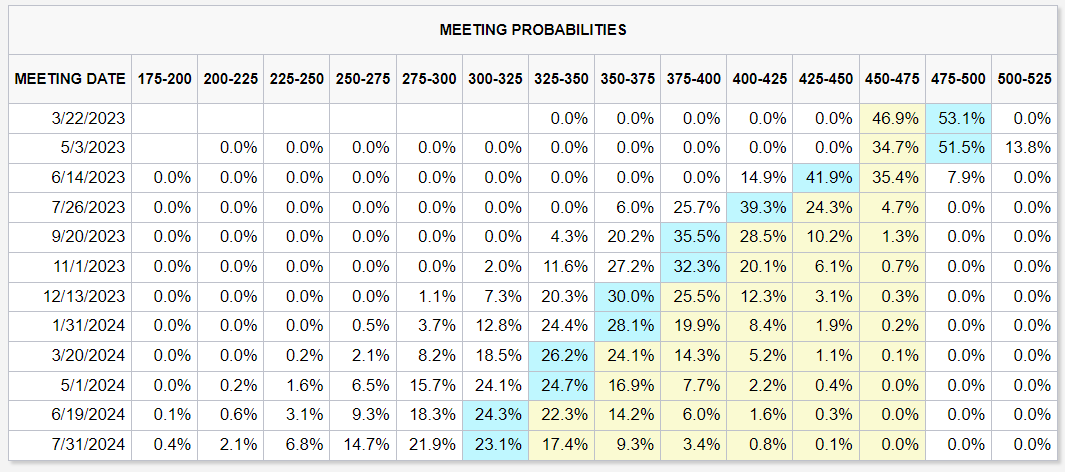
CME Group
The bond market is now pricing in a 50% chance that the Fed hikes one more time and then ends its rate hike cycle and starts cutting rates by mid year.
1.5% worth of rate cuts are priced in my mid 2024, as the bond market thinks the recession is now months away.
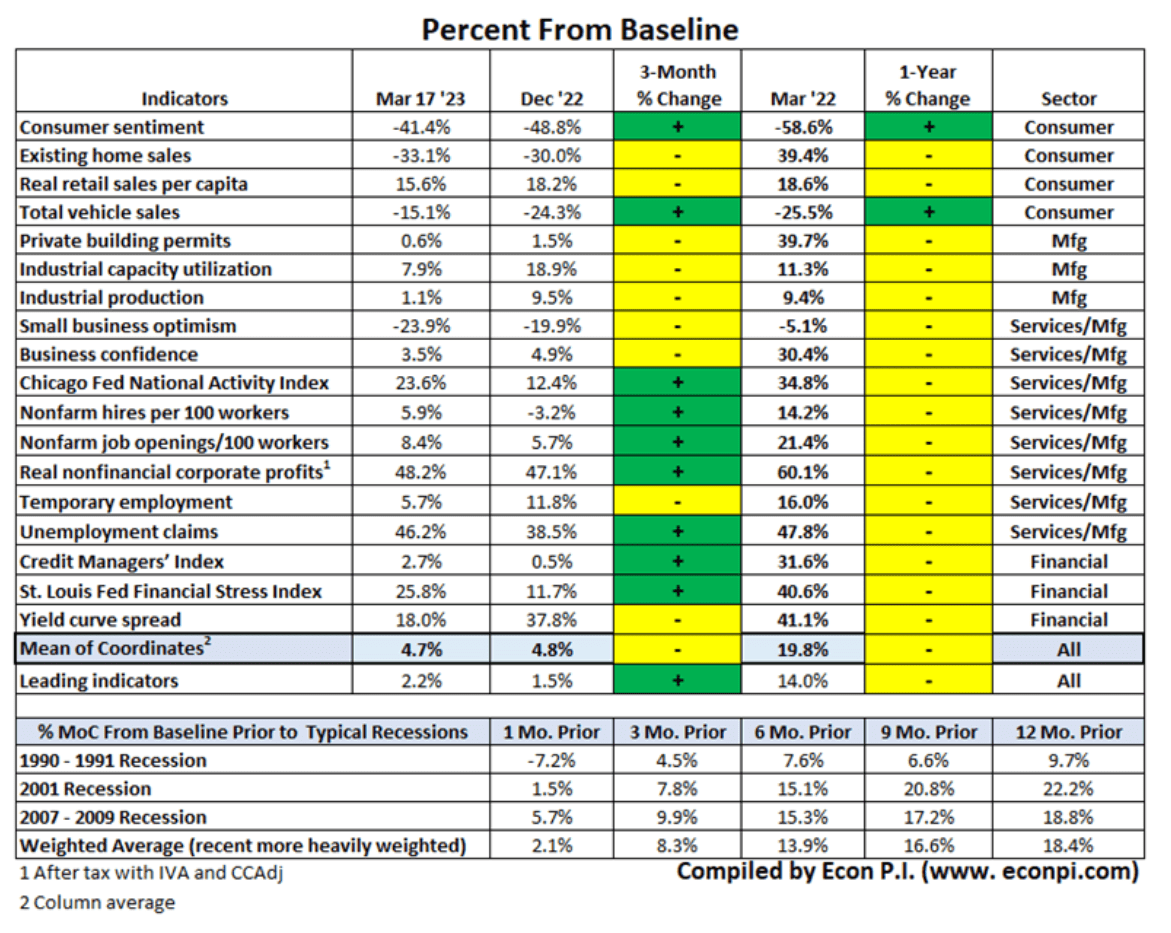
David Rice
Nine leading indicators that predict the average of 18 leading indicators are currently 2.2% above historical baseline and contracting at an accelerating rate on a month-to-month basis.
This means that the economic data points to a potential recession beginning in about four months.
That's consistent with the bond market's forecast. How can we tell?
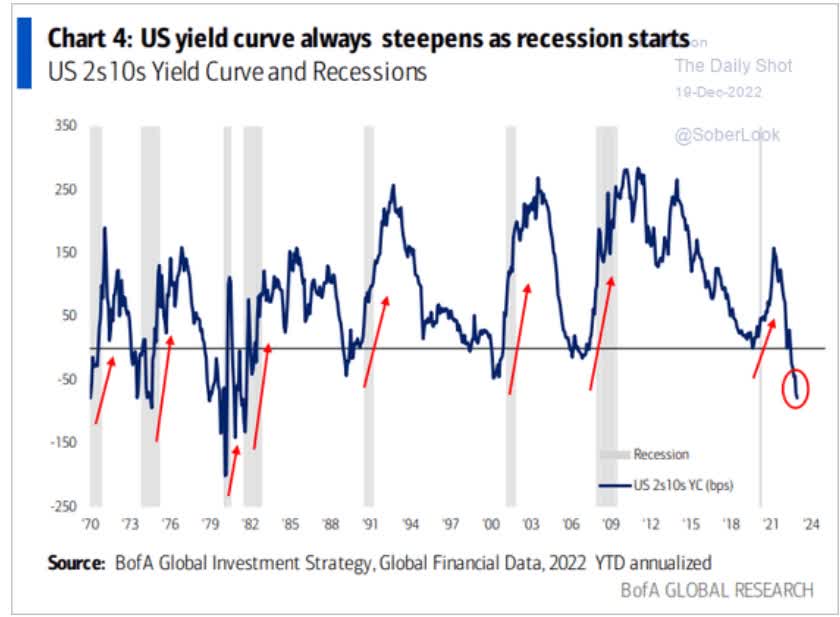
Daily Shot
Many people know about the famous yield curve, which has predicted every recession since 1960.
The inversion of the yield curve usually means a recession is coming within two years. However, the uninversion of the curve has always signaled when a recession is right about to begin.
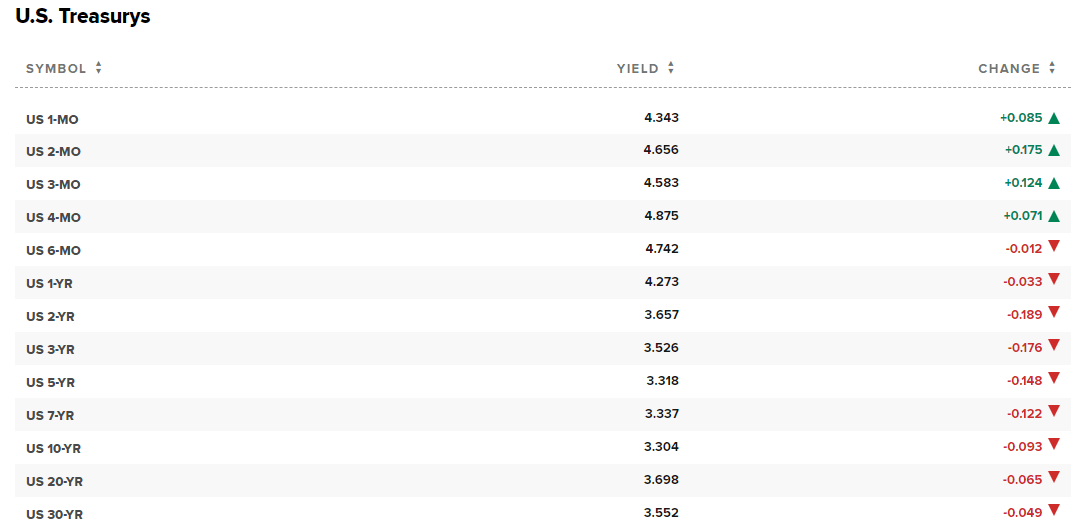
CNBC
The yield curve went from -1.07% a week ago to -0.35% as of the morning of March 20.
Historically, once the yield curve uninverts, a recession is usually a few weeks away because the bond market is pricing in fast Fed rate cuts.
- uninversion has always been followed by recession within one year
What About The Stock Market?
CNBC
The stock market, after an initial 0.5% rally on the Credit Suisse takeover news, resumed its risk-off, recession fear decline.
Mind you, this is hardly a stock market crash along the lines of the Pandemic or GFC.
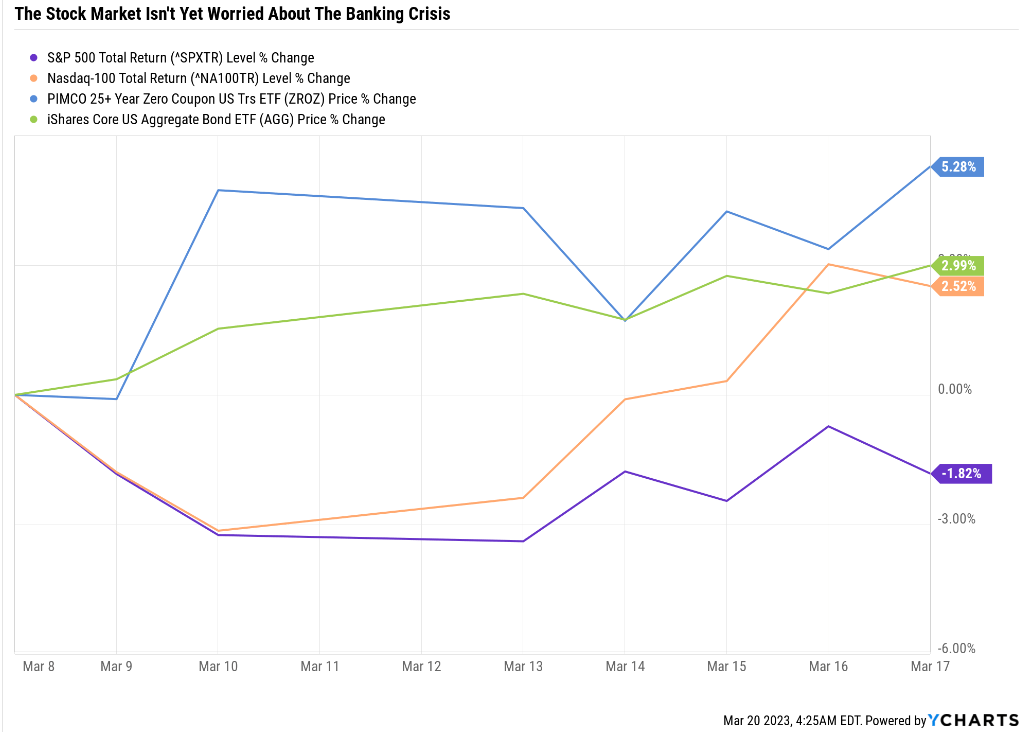
Ycharts
Since the banking crisis began, the stock market is basically flat, and the Nasdaq, due to a lack of banking exposure, is actually up.
- lower rates are beneficial for growth stocks, all else being equal
The big winner of the banking crisis so far are bonds, with the collapse in Fed rate hike expectations resulting in an 8-standard-deviation crash in bond yields.
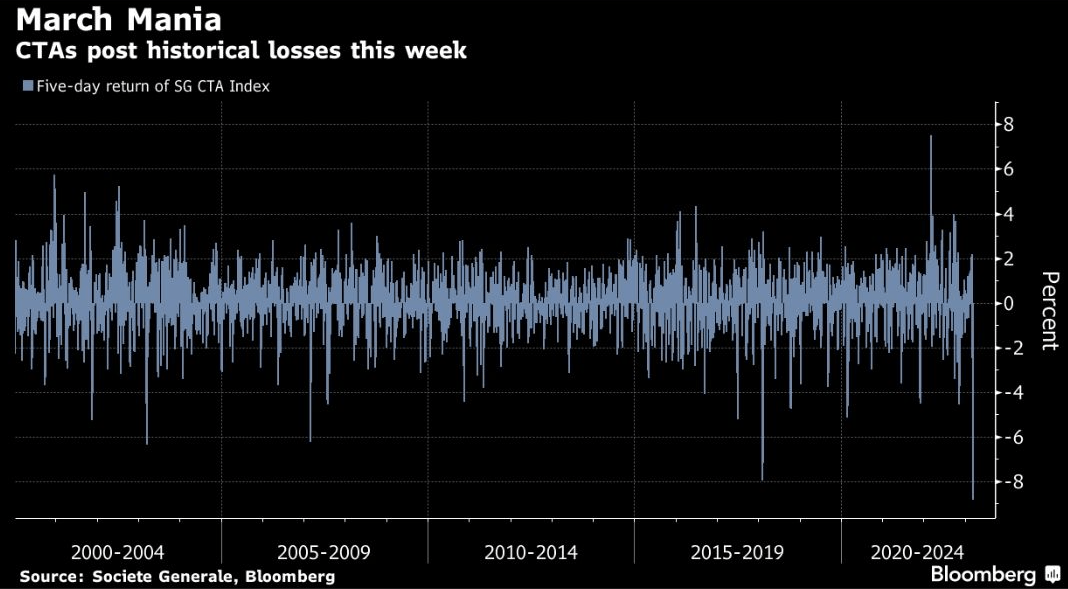
Bloomberg
Managed futures, which were still short bonds, especially 2-year yields that track the Fed Funds rate before the crisis began, suffered their worst week in recorded history.
- the best funds of 2022 suffered the worst
- falling as much as 7% in a single day
- when 2-year yields fell 0.61% in a single day, the most in 41 years \
Last week, for the first time in history, 2-year yields were up or down 25 basis points for four consecutive days.
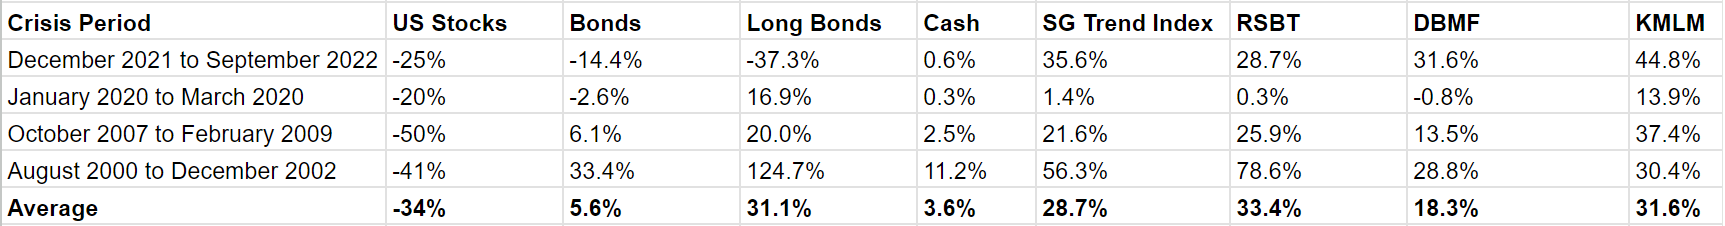
This Is Why It's Good To Own Both Bonds And Managed Futures
Seeking Alpha
Since 1980 bonds and managed futures have never failed to be flat or go up during bear markets. And that's proving true even during the worst flash crash for managed futures in history.
- managed futures will steadily go long bonds, and short stocks and cyclical commodities and long the dollar as the recession takes hold
- the optimal recession trade is why they historically are such great hedges in recessionary bear markets
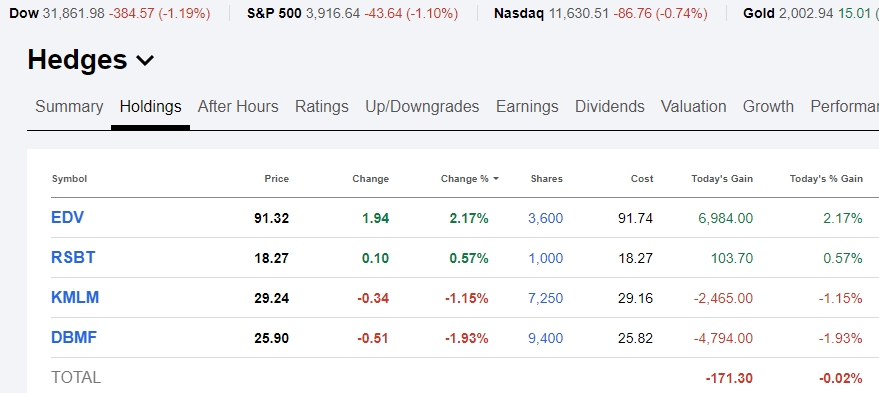
Soc Gen, Krane Shares
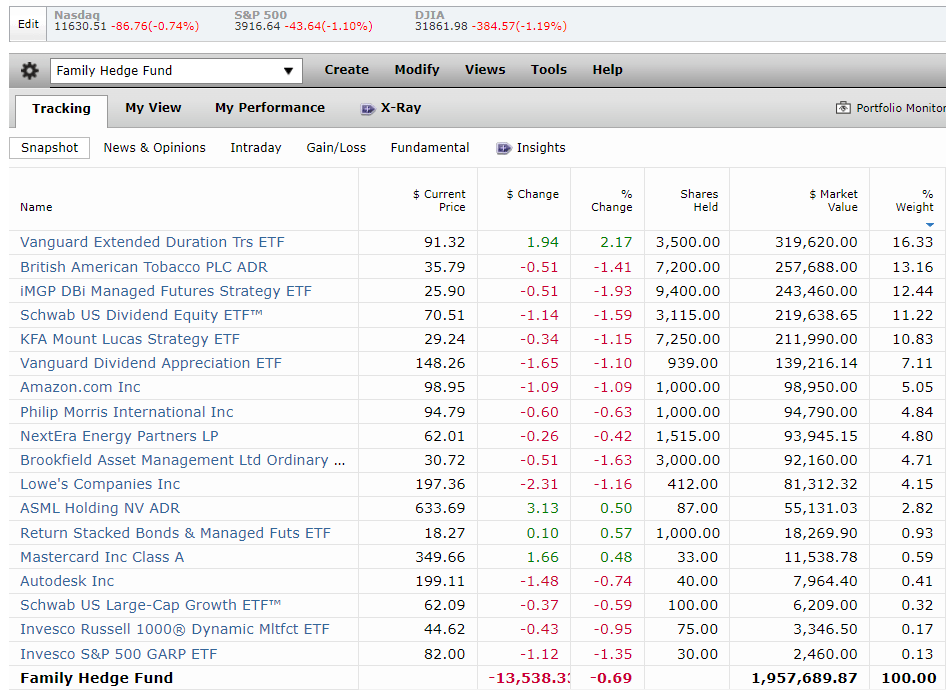
This brings me to how my family's $2 million investment fund is doing in these crazy times when bond yields trade like crypto.
Why My Family's $2 Million Investment Fund Is Buying VIG Right Now
The stock market is likely to fall in the coming months, as the market prices in the coming recessionary earnings contraction.
S&P Bloomberg Bear Market Bottom Consensus Estimates
| Earnings Decline |
| S&P Trough Earnings |
| X Blue-Chip Consensus PE of 16.8 |
| Decline From Current Level |
| Peak Decline From Record Highs |
| 0% |
| 227 |
| 3821 |
| 2.4% |
| -20.7% |
| 5% |
| 216 |
| 3630 |
| 7.3% |
| -24.7% |
| 10% (consensus) |
| 205 |
| 3439 |
| 12.2% |
| -28.6% |
| 13% (average since WWII) |
| 198 |
| 3324 |
| 15.1% |
| -31.0% |
| 15% |
| 193 |
| 3248 |
| 17.1% |
| -32.6% |
| 20% |
| 182 |
| 3057 |
| 22.0% |
| -36.6% |
(Source: DK Research Terminal, Bloomberg)
At the moment the Bloomberg blue-chip consensus expects the market to fall about 12% from here and take out a new low just below October's 3490.
The historically average recessionary earnings decline would be a 15% correction from here and a 31% peak decline from record highs.
- 33% is the average recessionary bear market decline since WWII
However, these estimates might be a bit optimistic because the average trough forward PE during non-financial crisis recessions is actually 13 to 15.
| Earnings Decline |
| S&P Trough Earnings |
| X historical 14 trough PE |
| Decline From Current Level |
| Peak Decline From Record Highs |
| 0% |
| 227 |
| 3184 |
| 18.7% |
| -33.9% |
| 5% |
| 216 |
| 3025 |
| 22.8% |
| -37.2% |
| 10% |
| 205 |
| 2866 |
| 26.8% |
| -40.5% |
| 13% |
| 198 |
| 2770 |
| 29.3% |
| -42.5% |
| 15% |
| 193 |
| 2707 |
| 30.9% |
| -43.8% |
| 20% |
| 182 |
| 2547 |
| 35.0% |
| -47.1% |
(Source: DK S&P Valuation Tool, FactSet)
If we get the historically average 13% decline in forward earnings estimates and stocks trough at 14X earnings, stocks could fall much further.
Mind you in a mild recession, they could still fall the historical amount.
The longer it takes for a recession to begin, the smaller the peak decline is likely to be.
So why is my family buying Vanguard's Dividend Appreciation ETF during these troubled and uncertain times?
The Best Aristocrats And Future Aristocrats To Help You Sleep Well At Night No Matter What
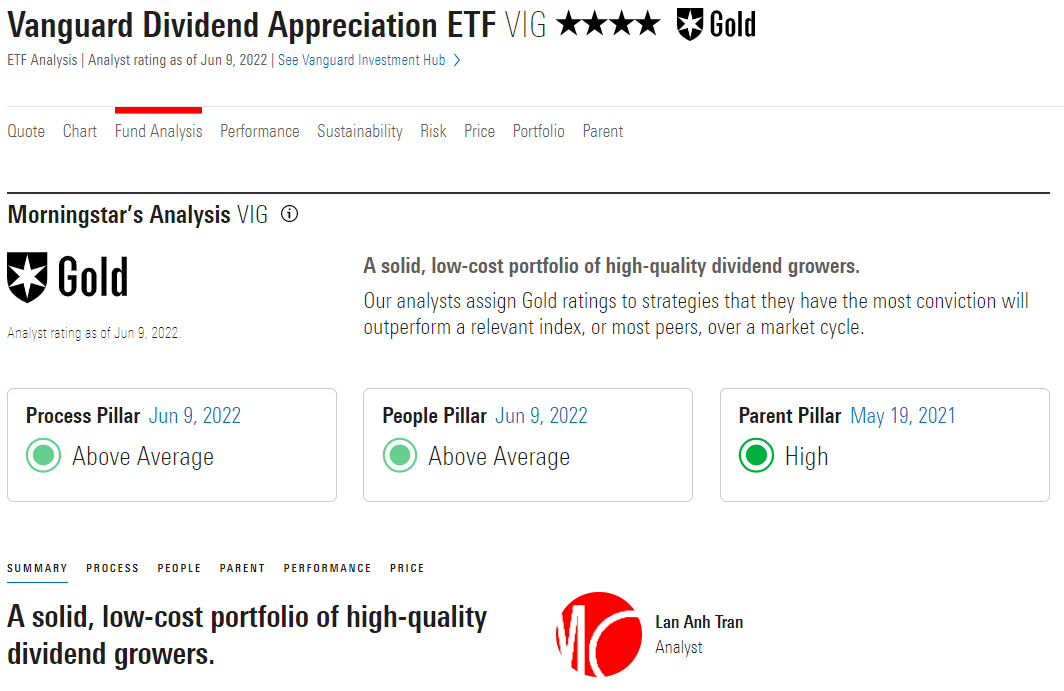
Morningstar
My family's investment fund owns a lot of VIG already, and we're building up our ( VIG ) position right now.
Why? Because VIG is the best dividend aristocrat ETF, I've ever come across.
Long-Term Consensus Total Return Potential
| Investment Strategy |
| Yield |
| LT Consensus Growth |
| LT Consensus Total Return Potential |
| Long-Term Risk-Adjusted Expected Return |
| ZEUS Income Growth (My family investment fund) |
| 4.3% |
| 9.9% |
| 14.2% |
| 9.9% |
| Vanguard Dividend Appreciation ETF |
| 2.0% |
| 11.3% |
| 13.3% |
| 9.3% |
| Schwab US Dividend Equity ETF |
| 3.6% |
| 9.4% |
| 13.0% |
| 9.1% |
| Nasdaq |
| 0.8% |
| 10.9% |
| 11.7% |
| 8.2% |
| Dividend Aristocrats |
| 1.9% |
| 8.5% |
| 10.4% |
| 7.3% |
| S&P 500 |
| 1.7% |
| 8.5% |
| 10.2% |
| 7.1% |
| REITs |
| 3.9% |
| 6.1% |
| 10.0% |
| 7.0% |
| 60/40 Retirement Portfolio |
| 2.1% |
| 5.1% |
| 7.2% |
| 5.0% |
(Sources: DK Research Terminal, FactSet, Morningstar)
VIG offers a slightly better yield than the S&P, but that's not its claim to fame. VIG is my favorite dividend growth ETF because of its superior growth profile to the market resulting in analysts expecting similar returns in the future as dividend blue-chips have delivered over the last 50 years.
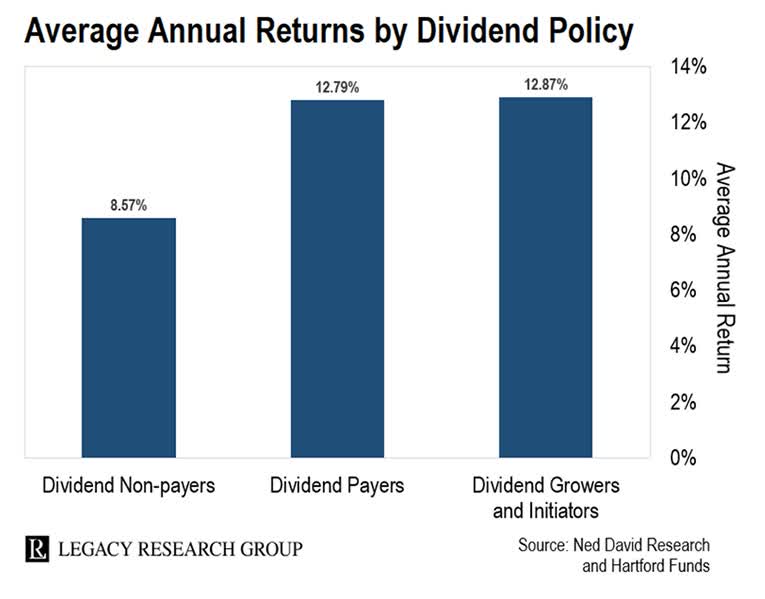
Legacy Research
VIG's second claim to fame is that it's never suffered a negative year of dividend income growth, not even during the Great Recession.
- NOBL, the dividend aristocrat ETF has slightly variable annual income due to rebalancing
What makes VIG the best aristocrat ETF you can buy? Because it also owns future aristocrats and is the best Ultra SWAN ETF I've ever come across.
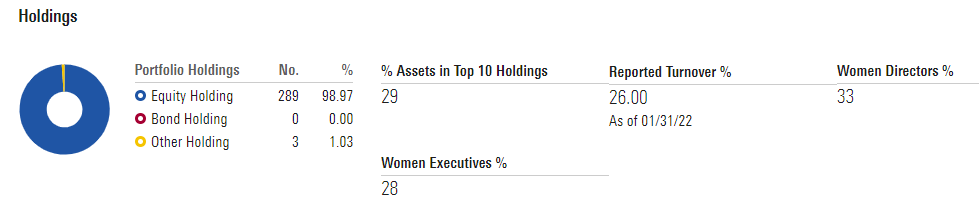
Morningstar
Here's how VIG operates.
The fund tracks the S&P U.S. Dividend Growers Index, which provides a market-cap-weighted portfolio of stocks with at least 10 consecutive years of increasing their regular dividend payments.
Securities must have more than $100 million in market cap and $1 million in three-month median daily trading value to be eligible for additions. Existing constituents face lower thresholds to reduce turnover.
On top of the long lookback period, the index excludes stocks with unsustainable yields likely to have trouble growing their dividends.
The index removes existing constituents ranking in the top 15% by indicating annual yield and new eligible securities in the top 25%.
Selected constituents are weighted by their float-adjusted market cap, subject to a 4% cap on any individual holdings' weight." - Morningstar
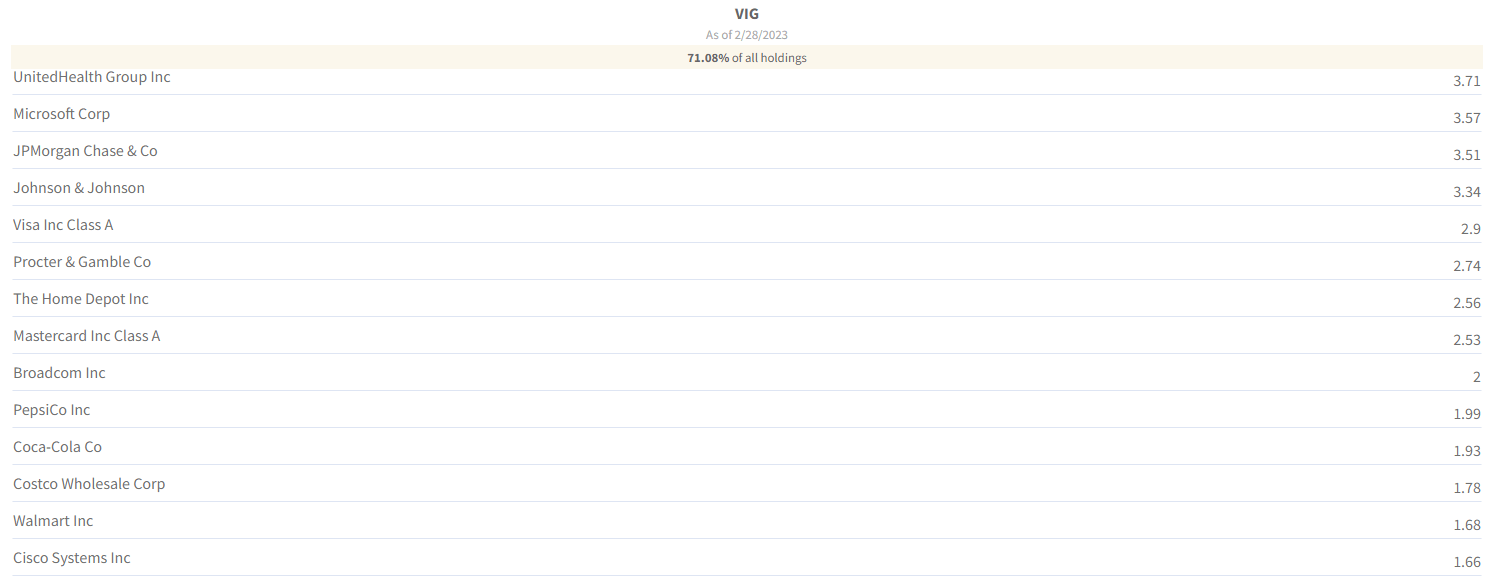
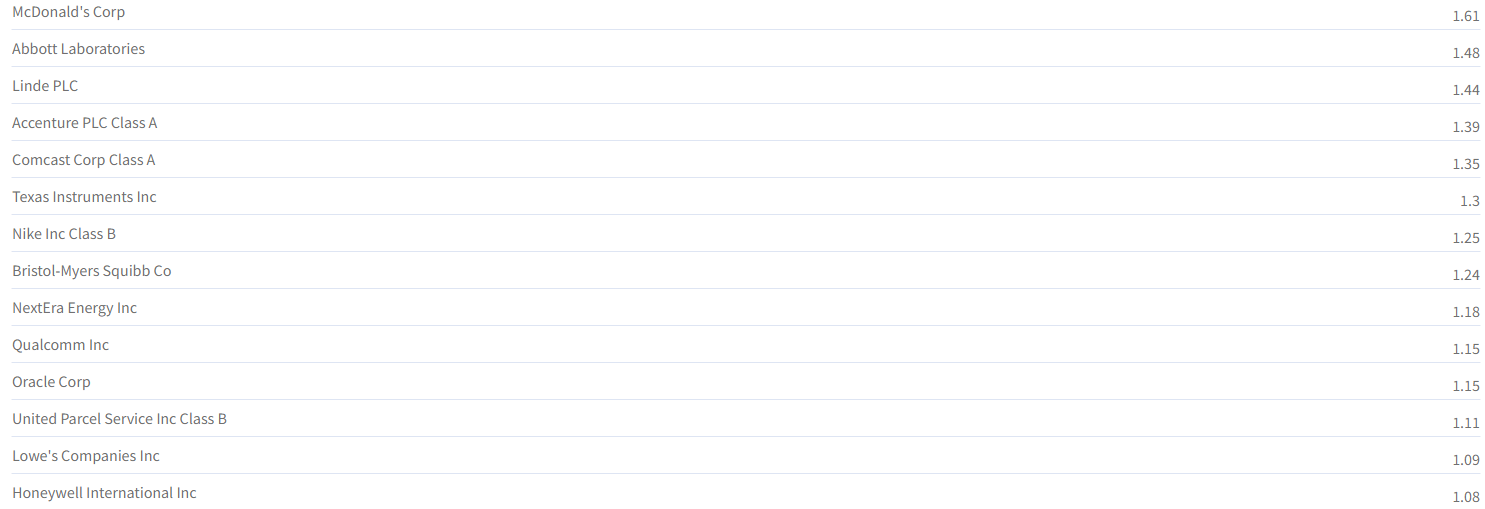
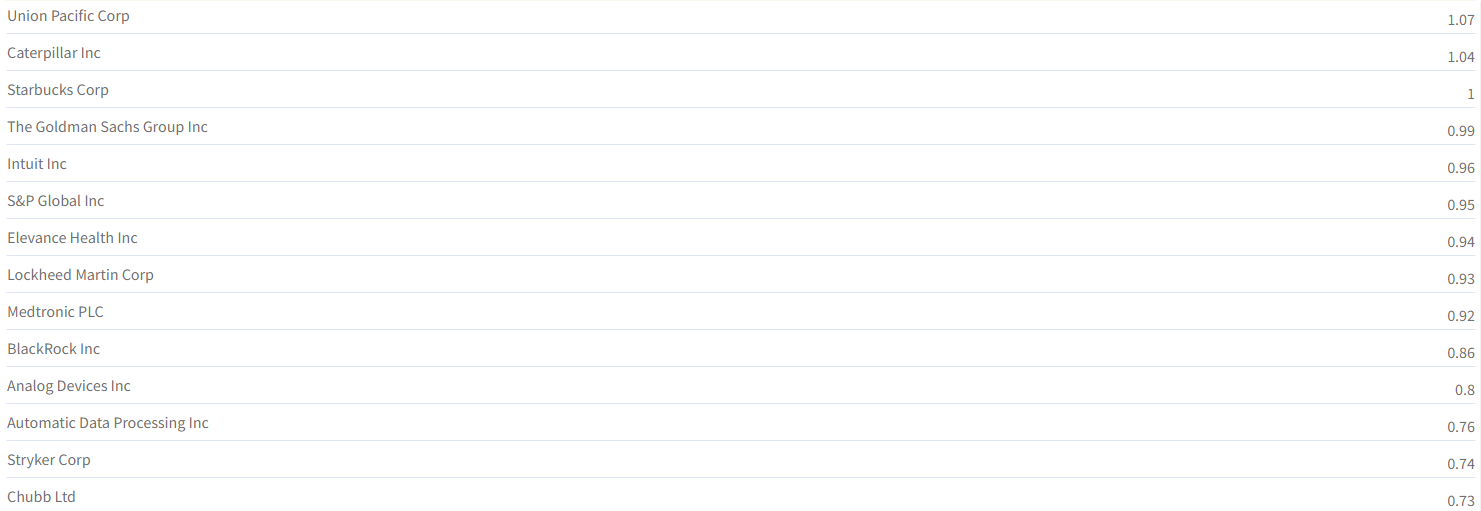
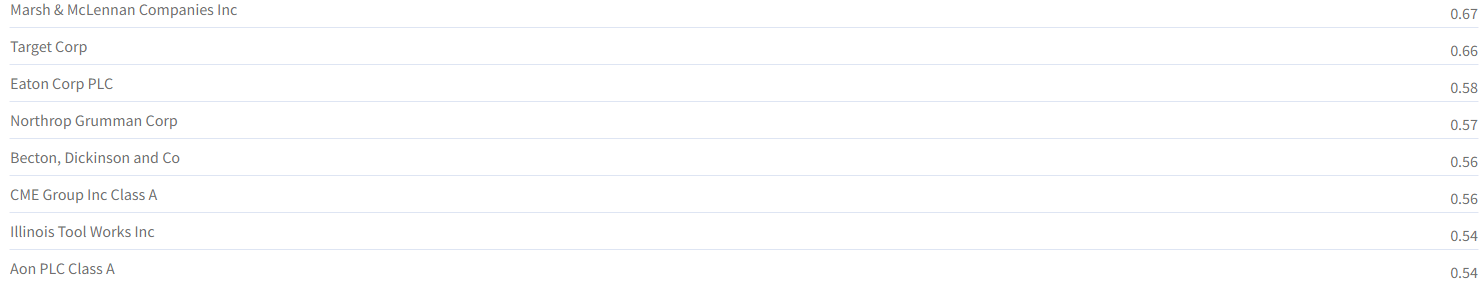
What does this actually mean in terms of companies VIG owns? That it owns nearly every aristocrat worth owning and future aristocrats as well.
Morningstar
This is a nearly 300-stock diversified portfolio.
Morningstar
The only sector VIG doesn't own is REITs, and that's by design.
Fund Visualizer
Fund Visualizer
Fund Visualizer
Fund Visualizer
These are some of the world's best companies, with the most dependable dividends, strongest balance sheets, and skilled and adaptable management teams.
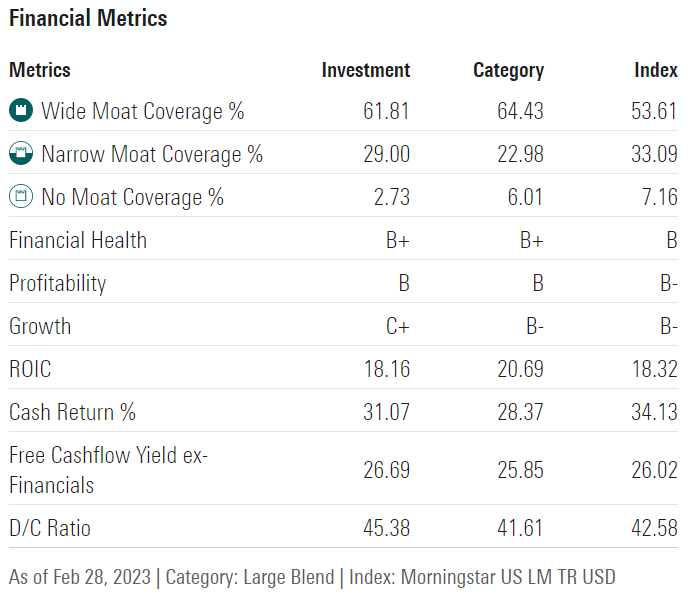
Morningstar
This is a very moaty group of companies with strong balance sheets, modest payout ratios, and 27% free cash flow margins.
- as high quality as you can get
- and exactly what you want to own in a recession
Dividend Income You Can Trust In Any Economic Conditions
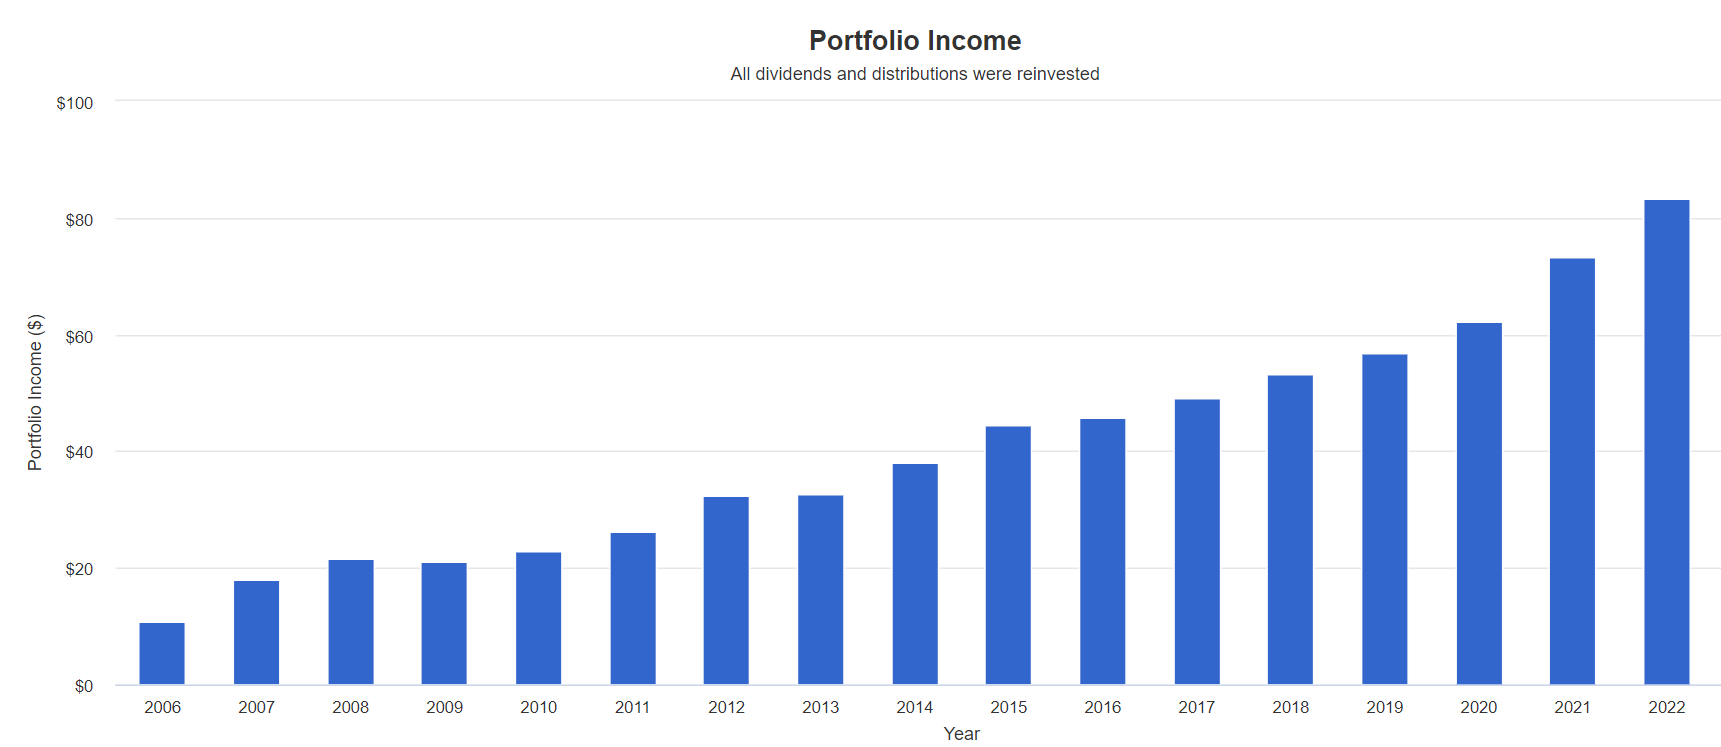
Portfolio Visualizer Premium
VIG's dividend growth has averaged about 11% annually since inception, including a 14% hike in 2022.
- S&P's dividends grew 11% last year
I've never seen any ETF whose annual dividends remained flat during the Great Recession and delivered such dependable income growth since.
Bottom Line: In Uncertain Times, VIG Is The Best Aristocrat ETF You Can Buy
Let me be clear: I'm NOT calling the bottom in VIG (I'm not a market-timer).
Even Ultra SWANs can fall hard and fast in a bear market.
Fundamentals are all that determine safety and quality, and my recommendations.
- over 30+ years, 97% of stock returns are a function of pure fundamentals, not luck
- in the short term, luck is 25X as powerful as fundamentals
- in the long term, fundamentals are 33X as powerful as luck
While I can't predict the market in the short term, here's what I can tell you about VIG.
These are 300 of the world's best dividend growth blue chips, with strong balance sheets, great management, good risk management, and a track record for dividend dependability that's second to none.
- fair value $172.60
- current price: $148.26
- historical discount: 14%
- DK rating: potential very strong buy
Today VIG is trading at an attractive 14% historical discount which for an Ultra SWAN ETF is a potentially very strong buy.
While I can't tell you what VIG is going to do in the next week, month, or even this year, I can tell you that owning 300 of the world's best aristocrats and future aristocrats is the lowest risk road to riches you can travel.
And that's why my family's $2 million investment fund is buying VIG right now and you might want to consider buying some too.
For further details see:
VIG: What My $2 Million Investment Fund Is Buying Now