VIGI - VIGI Compared To Peers: High Valuation But Good Track Record
2023-11-09 16:09:32 ET
Summary
- Vanguard International Dividend Appreciation Index Fund ETF Shares tracks the S&P Global Ex-U.S. Dividend Growers Index and has 322 holdings.
- The portfolio is mostly invested in developed countries, with Japan, Switzerland, and Canada being the top three countries.
- The VIGI ETF is the largest and most liquid fund among its competitors, with a good dividend growth rate and 5-year total return. However, it is expensive in terms of valuation ratios.
This article series aims at evaluating ETFs (exchange-traded funds) regarding the relative past performance of their strategies and metrics of their current portfolios. Reviews with updated data are posted when necessary.
VIGI strategy and portfolio
Vanguard International Dividend Appreciation Index Fund ETF Shares ( VIGI ) is tracking the S&P Global Ex US Dividend Growers Index. From inception on 02/25/2016 until the third quarter of 2021, it was tracking the Nasdaq International Dividend Achievers Select Index. When Vanguard changed the underlying index of their very popular Dividend Appreciation ETF ( VIG ) in Q3 2021, they did the same for the international fund. VIGI has changed indexes two years ago, but has always implemented a dividend growth strategy. As of writing, VIGI has 322 holdings, a 12-month distribution yield of 2.21% and a total expense ratio of 0.15%. Distributions are paid quarterly. It is available as a mutual fund ( VIAAX ). As described by Vanguard , the underlying index focuses on:
common stocks of high-quality companies located in developed and emerging markets, excluding the United States, that have both the ability and the commitment to grow their dividends over time .
Eligible stocks must:
- Be in the S&P Global Ex-U.S. BMI index.
- Not be listed in Shenzhen or Shanghai stock exchanges (mainland China).
- Not be classified as real estate investment trust ("REIT").
- Have a 3-month median daily trading volume of at least $500,000.
- Have been growing dividends for at least 7 years.
Stocks with the highest yields are excluded (top 25% for new candidates, top 15% for constituents).
Constituent weights are based on float-adjusted capitalization and capped at 5%. The index is reconstituted annually in March and rebalanced quarterly. Additionally, a monthly review may exclude companies cutting or suspending their dividends. In the most recent fiscal year, the portfolio turnover rate was 22%.
The portfolio is mostly invested in developed countries (87% of asset value) and in large companies (82%). The top 3 countries represent half of asset value: Japan (17.6%), Switzerland (16.7%) and Canada (16.2%). The UK follows at 10.3%, and other countries weigh no more than 7%. Hong Kong and Taiwan weigh 3.5% together, so direct exposure to geopolitical risks related to China is low. The next chart lists countries with a weight over 1%, which represent 95% of assets in aggregate.
VIGI geographical allocation (chart: author; data: Vanguard)
The portfolio is heavy in healthcare, with 23% of asset value in this sector. Industrials, financials, consumer staples and technology are between 11% and 16%. Other sectors weigh no more than 9%.
VIGI sector breakdown (chart: author; data: Vanguard)
The top 10 holdings, listed below, represent 34.8% of the portfolio’s value. The heaviest one weighs 5.15%, so risks related to individual companies are moderate.
| HOLDINGS |
| Weight % |
| Industry |
| Novo Nordisk A/S |
| 5.15% |
| Pharmaceuticals |
| Novartis AG |
| 4.27% |
| Pharmaceuticals |
| Nestle SA |
| 3.97% |
| Food Products |
| Roche Holding AG |
| 3.75% |
| Pharmaceuticals |
| SAP SE |
| 3.56% |
| Software |
| Sanofi |
| 3.22% |
| Pharmaceuticals |
| Toronto-Dominion Bank |
| 2.97% |
| Banks |
| Sony Group Corp |
| 2.77% |
| Household Durables |
| Reliance Industries Ltd |
| 2.61% |
| Oil, Gas & Consumable Fuels |
| AIA Group Ltd |
| 2.51% |
| Insurance |
VIGI vs. competitors
The next tables and charts compare characteristics of VIGI and four other non-hedged global dividend growth ETFs:
- Invesco International Dividend Achievers ETF ( PID )
- iShares International Dividend Growth ETF ( IGRO )
- WisdomTree International Quality Dividend Growth Fund ( IQDG )
- WisdomTree Global ex?U.S. Quality Dividend Growth Fund ( DNL ).
| VIGI |
| PID |
| IGRO |
| IQDG |
| DNL |
| Inception |
| 2/25/2016 |
| 9/15/2005 |
| 5/17/2016 |
| 4/7/2016 |
| 6/16/2006 |
| Expense Ratio |
| 0.15% |
| 0.53% |
| 0.15% |
| 0.42% |
| 0.42% |
| AUM |
| $5.36B |
| $939.70M |
| $588.69M |
| $859.27M |
| $578.27M |
| Avg Daily Volume |
| $18.31M |
| $4.16M |
| $2.52M |
| $4.41M |
| $2.49M |
| Holdings |
| 347 |
| 51 |
| 422 |
| 247 |
| 304 |
| Top 10 |
| 35.00% |
| 39.09% |
| 27.02% |
| 39.67% |
| 35.97% |
Data: Seeking Alpha.
VIGI is the largest (in assets under management, or AUM) and the most liquid fund of this list. It is second to IGRO in holding diversification and has the cheapest expense ratio, tie with IGRO.
| VIGI |
| PID |
| IGRO |
| IQDG |
| DNL |
| Yield (trailing 12 month) |
| 2.21% |
| 3.58% |
| 2.76% |
| 1.90% |
| 2.05% |
| 3 Yr Dividend Growth (annualized) |
| 8.19% |
| 0.65% |
| 4.95% |
| 2.62% |
| 0.10% |
| 5 Yr Dividend Growth (annualized) |
| 6.34% |
| 0.59% |
| 0.96% |
| 7.53% |
| 4.12% |
It is in the middle of the pack regarding the dividend yield, the best one by far for the 3-year dividend growth, and second for the 5-year dividend growth.
| VIGI |
| PID |
| IGRO |
| IQDG |
| DNL |
| Price/earnings |
| 21.33 |
| 17 |
| 14.11 |
| 20.35 |
| 15.62 |
| Price/book |
| 2.89 |
| 1.63 |
| 1.62 |
| 4.16 |
| 3.19 |
| Price/sales |
| 1.99 |
| 1.71 |
| 1.34 |
| 2.07 |
| 1.75 |
| Price/cash flow |
| 14.53 |
| 7.2 |
| 9.52 |
| 14.69 |
| 10.23 |
Data source: Fidelity.
Valuation ratios are not attractive: VIGI is the most expensive of the group regarding price-to-earnings and the second most expensive in price-to-cash-flow.
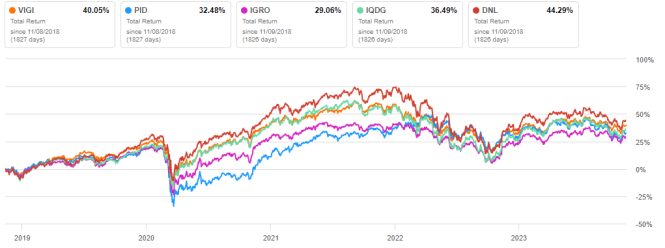
As for performance, VIGI is second to DNL in 5-year total return, as plotted on the next chart.
VIGI vs competitors, 5-year total return (Seeking Alpha)
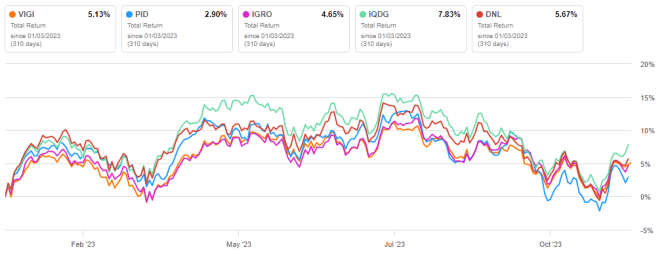
In 2023 to date, it is in the middle of the pack:
VIGI vs competitors, year-to-date (Seeking Alpha)
Takeaway
Vanguard International Dividend Appreciation ETF holds over 300 global stocks growing dividends for at least 7 years, excluding the U.S. and mainland China. It is the international equivalent of VIG, the largest dividend-growth ETF. Both funds have changed underlying indexes in 2021, but the new strategy is very similar to the old one. VIGI is well-diversified across countries, sectors and holdings.
Relative to competitors, Vanguard International Dividend Appreciation Index Fund ETF Shares is expensive regarding valuation ratios, but it is well-ranked in dividend growth rate and 5-year total return. The fund is not hedged against currency risks. The strengthening dollar index has been a drag for years in global equity funds, but currency risk might play in their favor in the future.
For further details see:
VIGI Compared To Peers: High Valuation, But Good Track Record