WDIV - VIGI: Seeking Global Dividend Growth
Summary
- VIGI is an international dividend growth ETF.
- Its top 3 countries are Canada, Switzerland and Japan.
- Healthcare is its heaviest sector.
- VIGI has beaten high-yield international ETFs in total return since inception.
This dividend exchange-traded fund ("ETF") article series aims at evaluating products regarding the relative past performance of their strategies and quality of their current portfolios. As holdings and their weights change over time, reviews may be updated when necessary.
VIGI strategy and portfolio
The Vanguard International Dividend Appreciation ETF ( VIGI ) is tracking the S&P Global Ex US Dividend Growers Index. From inception on 02/25/2016 until the third quarter of 2021, it was tracking the Nasdaq International Dividend Achievers Select Index. When Vanguard changed the underlying index of their very popular Dividend Appreciation ETF ( VIG ) in Q3 2021, they did the same for the international fund. As of writing, VIGI has 315 holdings, a 12-month distribution yield of 1.53% and a total expense ratio of 0.15% (it was 0.2% last year).
As described in the prospectus by Vanguard , the underlying index:
“focuses on common stocks of high-quality companies located in developed and emerging markets, excluding the United States, that have both the ability and the commitment to grow their dividends over time .”
VIGI has a new index, but continues implementing the same concept of dividend growth: constituents must show growing dividends for at least seven years, like in the old index. The liquidity threshold for constituents is similar. It should not significantly modify the set of eligible stocks. Both new and old indexes are reconstituted annually in March with a monthly review to check dividend cuts and suspensions for exclusion.
The differences are:
- Undisclosed rules disappear, making the strategy more transparent.
- Stocks with the highest yields are removed from the investable universe (top 25% for new candidates, top 15% for constituents).
- MLPs, which were excluded from the old index, are now in the universe.
- The new index is weighted on float-adjusted capitalization instead of market cap. The 4% weight limit is still enforced on reconstitution.
- The reconstitution and rebalancing becomes a 3-day process instead of single day. It may allow portfolio managers to have orders executed at slightly better prices.
Morningstar has published an extensive article here about the index change in VIG and VIGI.
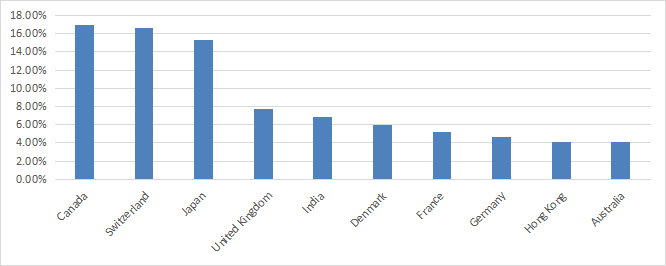
The portfolio is mostly in developed countries (87%) and large companies (84%). The top 3 countries together weight about 49% of asset value: Canada (17%), Switzerland (16.6%) and Japan (15.3%). China and Hong Kong together weight less than 8%: direct exposure to geopolitical and regulatory risk is more acceptable than in some global dividend ETFs .
VIGI countries ( chart: author; data: Vanguard)
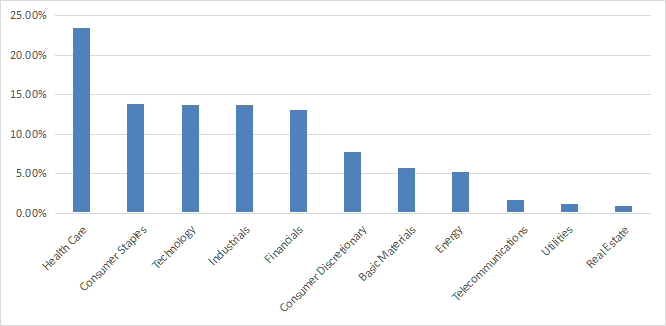
The portfolio is overweight in healthcare, with 23.5% of asset value. Consumer staples, technology, industrials and financials are between 13% and 14%. Other sectors weight less than 8% each.
VIGI sectors (chart: author; data: Vanguard)
The top 10 holdings listed below weight 35.4% of the portfolio. No holding weighs more than 5%, so risks related to individual companies are moderate.
| HOLDINGS |
| Weight % |
| Industry |
| Novo Nordisk A/S |
| 4.60% |
| Pharmaceuticals |
| Novartis AG |
| 4.35% |
| Pharmaceuticals |
| Nestle SA |
| 4.13% |
| Packaged Foods & Meats |
| Roche Holding AG |
| 3.56% |
| Pharmaceuticals |
| Tencent Holdings Ltd. |
| 3.30% |
| Interactive Media & Services |
| AIA Group Ltd. |
| 3.25% |
| Life & Health Insurance |
| Toronto-Dominion Bank |
| 3.18% |
| Diversified Banks |
| Sanofi |
| 3.08% |
| Pharmaceuticals |
| Diageo plc |
| 2.97% |
| Distillers & Vintners |
| Reliance Industries Ltd. |
| 2.95% |
| Oil & Gas Refining & Marketing |
Past performance
The next table compares VIGI performance and risk metrics since inception with five international dividend-oriented ETFs. The WisdomTree Global ex-U.S. Quality Dividend Growth ETF ( DNL ) and the Invesco International Dividend Achievers ETF ( PID ) are in the same dividend growth style as VIGI, with higher yields (3-4%). The other ones are in the high yield style: the First Trust Dow Jones Global Select Dividend ETF ( FGD ) and the SPDR S&P Global Dividend ETF ( WDIV ) are in a 5-7% yield range, the Global X SuperDividend ETF ( SDIV ) has a 13% yield.
| since inception |
| Total Return |
| Annual.Return |
| Drawdown |
| Sharpe ratio |
| Volatility |
| VIGI |
| 50.06% |
| 6.44% |
| -29.73% |
| 0.44 |
| 13.76% |
| DNL |
| 55.77% |
| 7.06% |
| -31.64% |
| 0.45 |
| 15.80% |
| PID |
| 59.20% |
| 7.42% |
| -43.36% |
| 0.43 |
| 17.98% |
| FGD |
| 32.46% |
| 4.42% |
| -43.26% |
| 0.28 |
| 18.18% |
| WDIV |
| 35.05% |
| 4.73% |
| -40.11% |
| 0.28 |
| 16.11% |
| SDIV |
| -23.02% |
| -3.95% |
| -56.62% |
| -0.13 |
| 21.76% |
Data calculated with Portfolio123
The next table does the same in 2022 YTD.
| 2022 to date |
| Total Return |
| Annual.Return |
| Drawdown |
| Sharpe ratio |
| Volatility |
| VIGI |
| -21.10% |
| -29.67% |
| -21.30% |
| -1.63 |
| 14.82% |
| DNL |
| -28.79% |
| -39.60% |
| -29.27% |
| -1.42 |
| 25.26% |
| PID |
| -6.65% |
| -9.72% |
| -15.08% |
| -0.43 |
| 18.72% |
| FGD |
| -15.27% |
| -21.81% |
| -21.33% |
| -1.51 |
| 17.47% |
| WDIV |
| -9.48% |
| -13.75% |
| -12.55% |
| -1.29 |
| 11.30% |
| SDIV |
| -23.27% |
| -32.52% |
| -26.34% |
| -2.09 |
| 19.73% |
Numbers show that dividend quality is superior to high yield in total return on the long-term. In 2022, PID and WDIV have been more resilient than other funds in the list thanks to their heavier exposure to utilities. They look more defensive, but short-term performance may not be representative of excess return on a full market cycle.
SDIV total return since 2016 is negative, pointing to a steep capital decay. High yields come with high risks measured in drawdown and volatility. Income-seeking investors should reconsider their attraction for high yields and rather look at quality yields, completing the distributions by withdrawing a small portion of capital every year. It looks better in total performance, less risky in capital volatility, and it may be more tax efficient (one can choose when taking capital gains and losses, not distributions).
A note of caution on valuation
Compared to the same competitors, VIGI is the most expensive of the list regarding P/E and price-to-cash flow ratios (see next table). However, valuation metrics must be taken with a lot of caution. They are biased not only by the sector composition, but also by country weights. For example, the P/E ratio looks cheap in financials and expensive in real estate, but it is unreliable in these sectors and cannot be compared to other ones. Another example regarding countries: the capital-weighted average P/E ratio is 25.67 in India, whereas it is 12.81 in Canada (source: Finviz ).
| VIGI |
| DNL |
| PID |
| FGD |
| WDIV |
| SDIV |
| Price / Earnings TTM |
| 18.47 |
| 10.75 |
| 15.6 |
| 6.59 |
| 11.19 |
| 4.19 |
| Price / Book |
| 2.93 |
| 3.62 |
| 2.1 |
| 0.82 |
| 1.12 |
| 0.74 |
| Price / Sales |
| 2.18 |
| 2.04 |
| 2.26 |
| 0.68 |
| 1.07 |
| 0.63 |
| Price / Cash Flow |
| 15.42 |
| 7.51 |
| 10.13 |
| 5.15 |
| 8.27 |
| 4.09 |
Data source: Fidelity
Moreover, the cheapest fund, SDIV, is also the worst performer. In short, don't compare funds using valuation ratios that may not be comparable.
Takeaway
VIGI holds 315 dividend-growth stocks of companies based outside the U.S. It is the international equivalent of VIG, one of the most popular dividend-growth funds. Both funds have changed underlying indexes in 2021, but the new strategy is very similar to the old one. Healthcare is the heaviest sector, followed by consumer staples, technology, industrials and financials. The fund is not hedged against currency risks. The strengthening U.S. dollar has been a drag in recent share price performance, but it may support foreign companies profitability on the mid-term. Exposure to China and Hong Kong is low.
VIGI beats international high-yield funds in total return and risk metrics since inception. DNL and PID have beaten VIGI since March 2016, but VIGI is less volatile. However, the difference is less than one percentage point in annualized return and price history is a bit short to call a winner. VIGI has a 4-star rating at Morningstar. For transparency, a dividend-oriented part of my equity investments is split between a passive ETF allocation and my actively managed Stability portfolio (14 stocks), disclosed and updated in Quantitative Risk & Value.
For further details see:
VIGI: Seeking Global Dividend Growth