VYMI - VIGI Vs. VYMI: Which Dividend ETF Is The Better Buy?
2023-06-02 08:00:00 ET
Summary
- Earlier this year, I wrote a thorough review of the best Vanguard funds to buy in 2023.
- In this article, I want to zoom in on Vanguard's two foreign dividend ETFs, which are an attractive low-cost way to instantly diversify your income internationally.
- These Vanguard ETFs are the two largest focused on non-US dividend stocks: one tilting towards high dividend yields, while the other seeks more dividend growth.
- At first, the 4.6% yield of the high dividend ETF may make that one more attractive to yield seekers, but growth and dividend cut risk also factor into total return.
- My preference is to directly buy the dividend stocks both of these ETFs hold, as they respectively provide valuable screens on dividend growth and yield.
In February of this year, I wrote a thorough review of the best Vanguard funds to buy in 2023 , which assumed the reader's priority was in the broadest diversification at the lowest possible cost. Brief summary of that article: you can own one of the most broadly diversified portfolios of global stocks and bonds by buying just two ETFs, but you can even further reduce your costs and improve your tax efficiency by breaking these down into at least 5 different Vanguard ETFs. Although doing so would start deviating from the Vanguard philosophy of simply "owning the whole market", the bond side of the diagram in that article also suggests many ways to better align your fixed income allocation with your tax situation and time horizon. This article will focus on the stock side of your asset allocation, specifically with the view of increasing your dividend income, and specifically by doing so by looking at Vanguard's two international dividend stock ETFs:
- Vanguard International High Dividend Yield ETF ( VYMI ), and
- Vanguard International Dividend Appreciation ETF ( VIGI )
As the names imply, VYMI focuses more on owning non-US stocks with relatively high dividend yields, while VIGI seems to place a higher priority on lower yielding stocks with higher expected dividend growth. These two ETFs pair with Vanguard's corresponding US domestic dividend focused ETFs: the Vanguard High Dividend Yield ETF ( VYM ) and the Vanguard International Dividend Appreciation ETF ( VIG ). VYMI and VIGI have significantly higher expense ratios of 0.22% and 0.15% respectively, versus 0.06% for each of VYM and VIG, though investors may consider this worthwhile for the significantly higher yield of VYMI and growth diversification of VIGI. On top of these higher expense ratios, it is also worth noting that both VYMI and VIGI have often traded at premiums to their net asset value ((NAV)) consistently around 0.2% for most of the past 5 years, quite unlike VYM or VIG, or most other US ETFs for that matter.
The below chart compares the dividend yields of these four ETFs over the past 5 years:
This next chart shows that, over the past 5 years and like broader non-dividend focused ETFs, US stocks have been outperforming non-US stocks. As the above chart explains, part of this is due to the yields on foreign stocks rising relative to the dividend yields on US stocks, as rising yields correspond to falling prices and vice versa.
It may also be notable that the difference in past performance between VYMI and VIGI over the past 5 years has not been as wide as the difference in returns between VYM and VIG, perhaps indicating that value has underperformed growth by less internationally than in the US. The 4.6% yield of VYMI is currently quite attractive, and the only yield of these four funds that currently exceeds the yield on 10-year US treasury notes ( US10Y ).
Since my focus is on non-US dividend stocks, and my goal is to try and earn a high dividend yield while still enjoying some growth and avoiding dividend cuts, I wanted to write this article specifically comparing VYMI and VIGI. I will do this comparison first by country, then by sector, then by a few of their top names.
VYMI vs VIGI: Country Exposure
Both VYMI and VIGI aim to cover the total investable non-US market, including both developed and emerging markets. According to Vanguard's classification, about 22% of VYMI is invested in emerging markets versus only 9% of VIGI, which may surprise some readers who might expect emerging markets to be home to more dividend growth opportunities. More than half of this difference is due to two of VYMI's top three market overweights: China, where VYMI allocates 5.1% more than VIGI, and Taiwan, where VYMI allocates 3.7% more than VIGI. VYMI's second largest relative overweight, at 3.9%, is to Australia, which is not classified as an emerging market, but is a natural resource export market highly correlated with emerging markets. So at a high level, it is fair to say that VYMI has significantly more exposure to emerging markets, and specifically to Greater China, relative to VIGI.
VIGI's five heaviest country overweights relative to VYMI are to Switzerland, Canada, Denmark, India, and Japan, though these are relatively small at around 0.5 - 1.1% each.
While I could write a separate article on each of these different markets, this high-level country view already shows quite a clear contrast between how these two funds look at the world map level.
VYMI vs VIGI: Industry Exposure
Since VYMI's index is designed to select the non-US stocks with the highest dividend yields, it should not be a surprise that VYMI has a relatively high weight in industries that tend to be associated with high yields and relatively low growth. The biggest of these industry differences is "Diversified Banks", which make up 22.8% of VYMI versus only 3.7% of VIGI. The next two are "Integrated Oil & Gas", at 6.6% of VYMI versus 2.2% of VIGI, and "Electric Utilities", which are 3.2% of VYMI and only 0.5% of VIGI.
VIGI's top industry exposure is to "Pharmaceuticals", which make up 18.1% of VIGI versus 6.6% of VYMI. This is followed by "Packaged Foods & Meats", at 6.6% of VIGI and 1% of VYMI, and "Application Software", which is 4.8% of VIGI and almost zero percent of VYMI.
VYMI Top Overweight Holdings
Two of VYMI's top three holdings are overlaps with VIGI, and those two names will be discussed later in the section on overlaps. A good feel on how VYMI differs from VIGI might be better seen by looking at VYMI's top holding in each of its three top overweighted industries:
- Diversified Banks: HSBC Holdings Plc ( HSBC )
- Integrated Oil & Gas: Shell Plc ( SHEL ), and
- Electric Utilities: Iberdrola SA ( OTCPK:IBDRY )
HSBC, as its original name "Hong Kong and Shanghai Banking Corporation" implies, has long been a play on Greater China , despite being technically British, and I was very critical of their dividend cut at the start of the COVID-19 pandemic in early 2020 . My reads of their 2022 Annual Report has been more positive , and I now find this a more attractive stock, especially for option trading. HSBC's post-COVID dividend history still seems a bit erratic, but I'm currently assuming an annual dividend of $1.50 per ADS, putting the yield on this one at just over 4%.
SHEL is a nice name for dividend investors because they explicitly target a 4% annual dividend growth rate on top of its current 4.1% dividend yield ($2.30 annual dividend / $56 current share price). Before changing its name from Royal Dutch Shell in 2021 , each ADS paid an annual dividend of $3.76 per year every year from 2014 through 2019 before cutting to $1.30 for year 2020 due to the COVID-induced oil crash that year. SHEL's dividend history back to 2006 is available on their website . In terms of overall risk to the oil sector, I review those risks in my earlier articles on BP vs Exxon , and later TotalEnergies .
Unlike HSBC and SHEL, IBDRY primarily reports its dividend in Euros rather than in dollars, but the one thing all three of these names have in common is a recent dividend cut. IBDRY's latest dividend cut was not in 2020 like the other two, but rather only last year in 2022, when the annual dividend totalled only €0.185, down from €0.449 in 2021, and breaking a streak of hiking their dividend every year since 2013.
Even though the yields on all three of these names seem relatively attractive at around 4%, I usually like to see a bit more upward "dividend momentum" after a dividend cut before jumping in. My reference for this my May 2020 article when I noticed how a simple screen of dividend achievers from 1996 beat the S&P 500 over the following 23 years.
VIGI Top Overweight Holdings
Two of VIGI's top five holdings are the overlaps with VYMI which will be covered in the next section. The other three of the top 5 holdings of VIGI each still nicely represent VIGI's top three industry overweights:
- Pharmaceuticals: Novo Nordisk A/S ( NVO )
- Packaged Foods & Meats: Nestle SA ( OTCPK:NSRGY ), and
- Application Software: SAP SE ( SAP )
Danish diabetes care giant NVO is now Europe's second most valuable company, and returns its massive profits to shareholders through a balance of dividend increases and share buybacks . It seems the main reason NVO is not also in VYMI is its relatively low dividend yield of only 1.5%, though if its healthy historic dividend growth rate continues, the total return on this name could still be good.
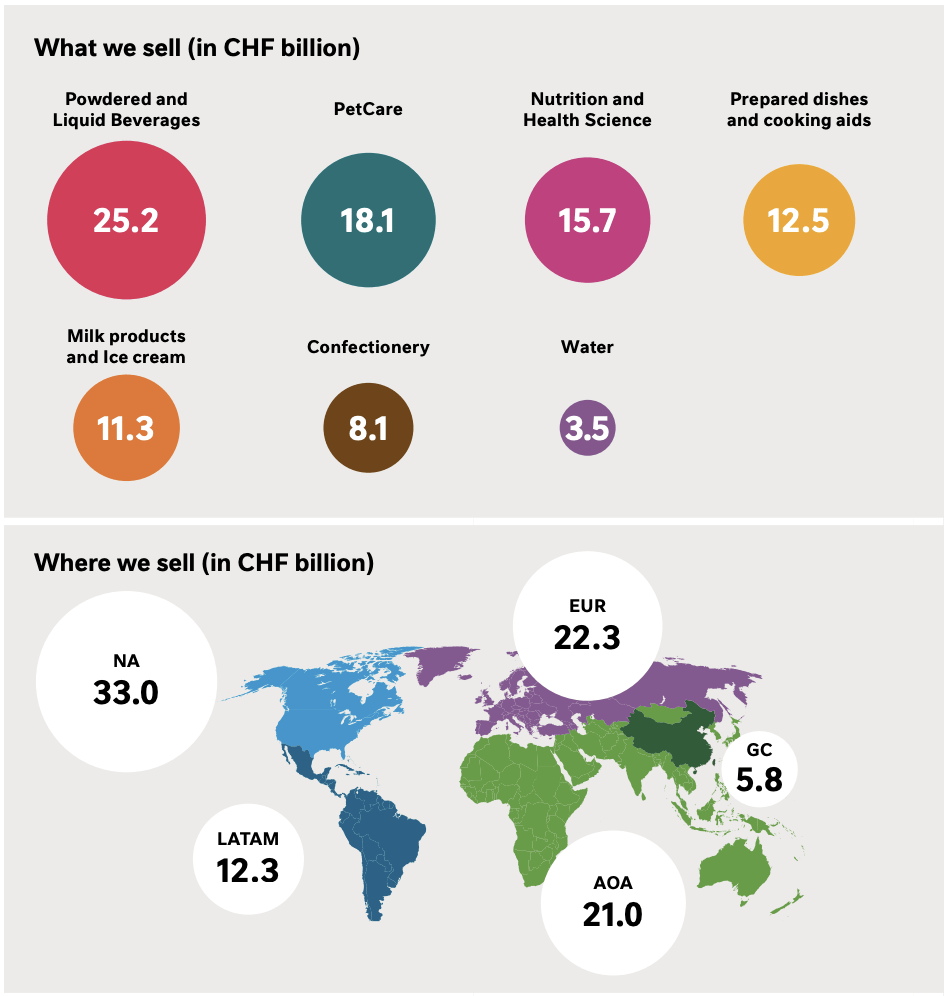
Second comes the Swiss food and packaged beverage behemoth Nestle. As the clip below from Nestle's 2022 Annual Report shows, North America is actually a much larger market for Nestle than Europe, making up over 1/3 of Nestle's 94.4 billion Swiss Francs in revenue that year. These similarities are why I compare the future of Nestle's dividend, to which the stock currently trades at a yield only around 2.5%, to my analysis of the future of Coca-Cola's dividend .
Nestle 2022 Annual Report
VIGI's third largest holding not in VYMI is German enterprise software leader SAP, which like NVO and Nestle, has an impressively strong history of hiking dividends , but a relatively low yield of only 1.6%.
What VIGI's top components all seem to have in common is that they all seem to be relatively strong, profitable, wide moat businesses with relatively little leverage and plenty of cash flow to fund their dividends and dividend growth, which is why they rarely trade at attractive yields. That is why the next section focuses on my favorite uses of these two funds: looking at the overlaps to find stocks that have both relatively strong dividends and decently high yields.
VYMI vs VIGI: Overlaps
The three largest overlaps between VYMI and VIGI all happen to be pharmaceutical stocks: Novartis ( NVS ), Roche ( OTCQX:RHHBY ), and Sanofi ( SNY ), which make up 1.0-1.9% each of VYMI and 3.0-4.6% each of VIGI. The dividend yields on these three stocks are 3.6%, 3.2%, and 3.7% respectively, so not as high as the average yield of VYMI, but still relatively attractive for stocks that have also passed VIGI's dividend growth screen. I should highlight here that this is why, of all of the stocks in my disclosure, my positions in these three names remain the largest.
The fourth largest overlap between VYMI and VIGI is Canadian bank TD Bank ( TD ), which remains my favourite Canadian bank and largest Canadian stock position 2.5 years after my 2020 review of Canadian banks . TD has a much juicier dividend yield of 4.8%, though of course that comes with the risk of being a leveraged bank that may be as exposed to dividend cuts like HSBC's in 2020 (see above) or JPMorgan's in 2009 .
Conclusion
At first look, VYMI looks like the far more attractive of these two ETFs with its much higher dividend yield of 4.6% with still some exposure to dividend growth and over 20% in emerging markets. The attractiveness of that dividend needs to be tempered with the risk of dividend cuts, like those already seen in VYMI's top three holdings. VIGI's holdings seem to instead be much higher quality companies without any recent dividend cuts, but this comes at the cost of buying these at a much higher price (=lower yield). Since each of these ETFs perform their own screens on the universe of non-US dividend paying stocks, with VYMI screening on high yield and VIGI screening for a history of dividend increases, my own preference is to simply buy the stocks that pass both of these screens and so are held by both funds. That said, for investors who prefer ETFs to owning stocks directly, I rate both of these ETFs a buy, since a 50-50 mix of the two will still have an average yield over 3% while still providing some growth and diversification away from US stocks.
For further details see:
VIGI Vs. VYMI: Which Dividend ETF Is The Better Buy?