VSH - Vishay Intertechnology: Resistance Looms On The Horizon
2023-05-19 10:23:07 ET
Summary
- Q1 results and Q2 guidance were much better than expected, resulting in a stock that broke out of a holding pattern to the upside.
- While the latest results got a thumbs up, Q1 may have been high and VSH could be destined for lower earnings for some time.
- The stock has room to go a little higher, but the charts suggest the stock is likely heading lower in the near term.
- There is more downside than upside for VSH at this point, which means long VSH is probably not the way to go.
As recently as May 9, Vishay Intertechnology (VSH), a leading supplier of discrete semiconductors, was under water with the stock trading in negative territory. However, all that changed on May 10 with the release of the Q1 report , which not only blew past estimates, but also came at an important junction in the charts. Still, there is reason to believe further advances may be harder to come by with resistance looming in the distance. Why will be covered next.
The Q1 FY2023 report blew past expectations
There was reason to be wary of the Q1 FY2023 report. The Q4 report that preceded it fell short of estimates and guidance was also below expectations due to a weakening market for semiconductors. The market expected VSH to report another sequential decline in the top and the bottom line with consensus estimates predicting non-GAAP EPS of $0.56 on revenue of $846M.
However, VSH earned $0.79 on revenue of $871M in Q1, both better than expected. On the other hand, VSH seems to have gotten a helping hand in achieving these numbers. Favorable foreign exchange rates, for instance, raised revenue by about $15M. Unit volume actually declined by 1.4% YoY, but higher prices more than made up for it.
Gross margin of 32% was much higher than the 27.5-28.5% guidance had called for as a result of higher prices, lower-than-expected material and freight costs and improved manufacturing efficiencies, partly offset by lower volumes and higher labor costs. The table below shows the numbers for Q1 FY2023.
EPS also got a boost from stock buybacks. VSH spent $22M to buy back 0.9M shares in Q1. The weighted average of shares outstanding was 141.25M in Q1 FY2023, down from 142.25M in Q4 FY2022 and 145.55M in Q1 FY2022. VSH was left with $1.03B in cash, cash equivalents and short-term investments on the balance sheet.
| (Unit: $1000, except for EPS) |
| (GAAP) |
| Q1 FY2023 |
| Q4 FY2022 |
| Q1 FY2022 |
| QoQ |
| YoY |
| Revenue |
| 871,046 |
| 855,298 |
| 853,793 |
| 1.84% |
| 2.02% |
| Gross margin |
| 32.0% |
| 29.1% |
| 30.3% |
| 290bps |
| 170bps |
| Operating margin |
| 18.2% |
| 15.8% |
| 17.1% |
| 240bps |
| 110bps |
| Operating income |
| 158,568 |
| 135,308 |
| 146,253 |
| 17.19% |
| 8.42% |
| Net income (attributable to VSH) |
| 111,781 |
| 72,788 |
| 103,573 |
| 53.57% |
| 7.92% |
| EPS |
| 0.79 |
| 0.51 |
| 0.71 |
| 54.90% |
| 11.27% |
| (Non-GAAP) |
| Adjusted EBITDA margin |
| 22.9% |
| 20.0% |
| 21.2% |
| 290bps |
| 170bps |
| Adjusted EBITDA |
| 199,254 |
| 171,006 |
| 180,591 |
| 16.52% |
| 10.33% |
| Net income (attributable to VSH) |
| 111,781 |
| 98,761 |
| 103,573 |
| 13.18% |
| 7.92% |
| EPS |
| 0.79 |
| 0.69 |
| 0.71 |
| 14.49% |
| 11.27% |
Source: VSH Form 8-K
Q1 could have been an exception
Still, book-to-bill was below one at 0.84 in Q1, which suggests demand remains soft. On the other hand, VSH is still sitting on 7.5 months of backlog, even if it represents a sequential decline of 0.5 month. This gives VSH a buffer to work with to keep sales afloat for a while. If not for this, the quarterly results would be much worse than they are right now.
| Q2 FY2023 (guidance) |
| Q2 FY2022 |
| YoY (midpoint) |
| Revenue |
| $860-900M |
| $863.5M |
| 1.91% |
| Gross margin |
| 28.5-29.5% |
| 30.3% |
| (130bps) |
Guidance therefore calls for Q2 FY2023 revenue of $860-900M, an increase of 1.03% QoQ and 1.91% YoY at the midpoint, and much higher than the consensus forecast of $832M. The forecast sees gross margin of 28.5-29.5% in Q2, which is less than in Q1. In fact, VSH sees lower margins for the rest of FY2023, in part due to the absence of some of the tailwinds that VSH benefited from in Q1. From the Q1 earnings call:
"we had less pricing pressure than expected during Q1. We had lower energy costs related to a government subsidy and there were things that will not be able to repeat next year - next quarter. So we now expect more favorable margins with a floor of about 29% for the year. But in the second half we expect to have lower gross margins than in the first half due to some increases in labor that are still coming and some additional inflationary costs."
A transcript of the Q1 FY2023 earnings call can be found here .
What this means is that earnings will go down from what looks to have been the high in Q1 FY2023. As a result, consensus estimates predict non-GAAP EPS of $0.63 on revenue of $880M in Q2 FY2023, which is $0.16 less than in the preceding quarter and $0.19 less than a year ago. Estimates expect non-GAAP EPS of $2.38-2.90 on revenue of $3.4-3.6B by the end of FY2023. In comparison, VSH earned $3.16 on revenue of $3.5B in FY2022.
VSH looks cheap in some ways, but for a reason
Earnings are expected to shrink and that could continue for some time. This partially explains why VSH trades at relatively low valuations. For instance, VSH trades at 9.1 times forward non-GAAP earnings with a trailing P/E of 7.5. In comparison, multiples in the sector tend to be much higher with the median at 19.8x and 17.7x respectively. They are also generally below where they have been on average in the last five years. The table below shows some of the multiples VSH trades at.
| VSH |
| 5-year average |
| Sector median |
| Market cap |
| $3.41B |
| - |
| - |
| Enterprise value |
| $3.08B |
| - |
| - |
| Revenue ("ttm") |
| $3,514.7M |
| - |
| - |
| EBITDA |
| $790.6M |
| - |
| - |
| Trailing non-GAAP P/E |
| 7.54 |
| 13.02 |
| 17.67 |
| Forward non-GAAP P/E |
| 9.08 |
| 12.34 |
| 19.79 |
| Trailing GAAP P/E |
| 9.96 |
| 35.37 |
| 22.77 |
| Forward GAAP P/E |
| 9.25 |
| 12.82 |
| 22.64 |
| PEG GAAP |
| 1.27 |
| - |
| - |
| P/S |
| 1.24 |
| 1.00 |
| 2.64 |
| P/B |
| 1.60 |
| 1.81 |
| 2.80 |
| EV/sales |
| 0.88 |
| 0.89 |
| 2.76 |
| Trailing EV/EBITDA |
| 3.90 |
| 5.05 |
| 14.33 |
| Forward EV/EBITDA |
| 4.64 |
| 4.78 |
| 13.40 |
Source: Seeking Alpha
The stock has broken out
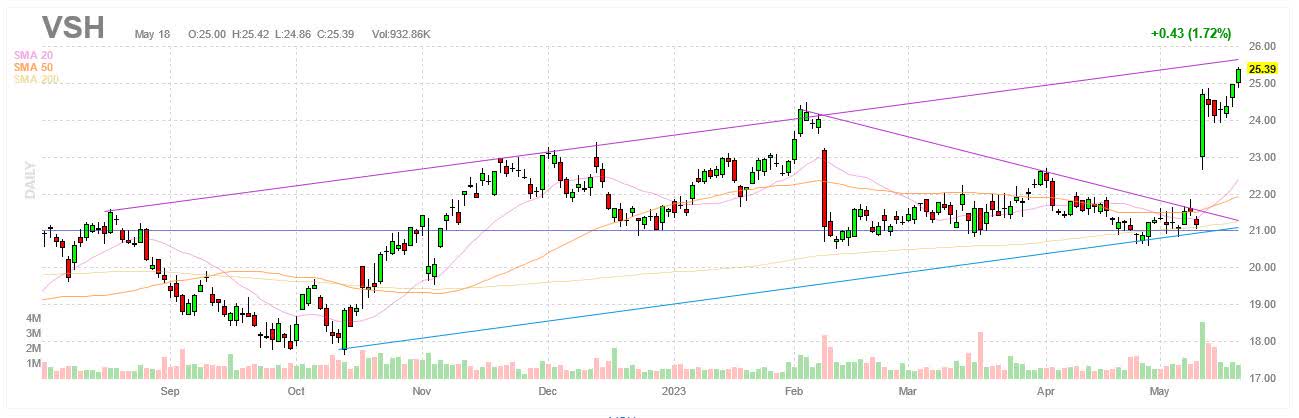
The market reacted very well to the latest report from VSH. The stock was down 2% for the year before the Q1 report was released on May 10, but the stock gained a quick 16.8% in one day after the latest results came in much better than expected. The stock is now up 17.7% YTD. The chart below shows how the stock jumped higher after the Q1 report.
There are several interesting things worth noting in the chart. One is that the Q1 report helped the stock break out of what looks like a descending triangle. Note how the highs and the lows from February to May can be connected by a descending and a horizontal trendline respectively, which are converging and thereby creating what looks like a triangle. The stock is kept within the triangle because of the trendlines.
In fact, the Q1 report came at the right time with the stock close to running out of room in the triangle with the trendlines close to converging. The fact that the stock broke to the upside in a reversal pattern is seen as bullish, which would help explain why the stock jumped as much as it did out of the triangle.
The stock appears to have resumed the uptrend that goes back to last year. Note how the general direction of the stock appears to be up with the lows and the highs trending higher in general, a bullish pattern that favors higher stock prices. However, before rushing in to get in on the action, there are a couple of other things worth mentioning.
The first is that the stock may be getting close to resistance, which could make further gains difficult. Notice how the stock is getting close to the upper trendline, which goes back to last year. Previous attempts to break through this trendline have not been successful. At the same time, the trendline is ascending, which means the stock can still go up, just not very quickly and certainly not at the pace seen in recent days.
It's also worth mentioning that in spite of all the recent gains, the stock has not actually gained that much in recent years. A current stock price of $25.39 puts VSH back to where it was in mid-2018. In other words, the stock has essentially traded sideways for years despite all the ups and down over the years. Rallies like the most recent one have been preceded by selloffs just as large and vice versa, in effect sending the stock back to square one.
There is one more important thing to note. Resistance may come from more than one corner. The stock is closing in on a multi-decade high. The stock hit a high of $26.50 in July 2018, which is the highest VSH has gotten in the last 2 decades. The last time the stock got any higher was around the turn of the century. The stock matched the July 2018 high of $26.50 in April 2021 with a high of again $26.50, something that is definitely worth noting. On both occasions, the stock peaked at the exact same price, down to the penny and, on both occasions, the stock proceeded to enter a long decline of at least one year.
The stock is currently roughly 4.3% away from the July 2018 high and April 2021 high of $26.50, but history tends to repeat, and if the charts patterns are anything to go by, odds are the stock won't get past resistance at $26.50 or so. If the stock cannot go higher as the way up is cut off, then the other option is to head south, which is what happened two times before.
Investor takeaways
The latest report from VSH was very encouraging. Both the Q1 results and the Q2 guidance far surpassed expectations. This helped the stock break out of the holding pattern it was stuck in for months. The stock broke to the upside and the trend seems to be in favor of the stock going higher. VSH also looks relatively cheap with multiples where they are. Some might see all this as justification for long VSH.
However, resistance may not be far away for several reasons. The stock is approaching the upper bound of the ascending channel it has stayed in going back all the way to last year. Previous attempts to break through the upper trendline of the channel have all been rejected. The stock is currently overbought with an RSI well into the seventies, conditions that favor a pullback in the stock.
Furthermore, the stock is closing in on the multi-decade high at $26.50. The stock hit $26.50 twice in the last 20+ years and both times the stock proceeded to enter an extended decline. All this suggests the stock is more likely to head lower than higher in the near term. It would also be consistent with how the stock has behaved in recent years. That is for the stock to move sideways with rallies followed by selloffs and vice versa.
True, the numbers were better than expected, but that does not change the fact that earnings are set to decline, something that VSH itself agrees with. Q1 might have been as good as it gets for some time. A shrinking backlog and a book-to-bill below one are not signs of healthy demand. On the contrary, they herald lower earnings over time as long as they persist.
I am therefore neutral on VSH as stated in a previous article . The stock may have some gas left in the tank, but odds are the stock will soon encounter resistance, which means the stock is most likely heading lower in the near term. This being the case, staying on the sidelines may yet turn out to have been the right move all along.
For further details see:
Vishay Intertechnology: Resistance Looms On The Horizon