VTV - VLUE: Why Deep-Value Tech Doesn't Work
Summary
- VLUE tracks the MSCI USA Enhanced Value Index, selecting 150 Large-Cap U.S. securities based on price-book, price-earnings, and enterprise value-operating cash flow ratios.
- Launched in April 2013, VLUE has amassed $7.6 billion in assets management and has a reasonable 0.15% expense ratio. However, its track record is poor.
- VLUE tends to offer little downside protection and doesn't participate much in market recoveries. A reliance on deep-value Technology stocks is one key reason why.
- VLUE is 27% Technology stocks, and despite them having low P/E ratios to start the year, they haven't offered any outperformance this year relative to an equal-weight Technology ETF.
- The bottom line is that buying deep-value stocks is unnecessarily risky. This article highlights VLUE's fundamentals alongside MGV and SCHV, two superior value ETFs.
Investment Thesis
The iShares MSCI USA Value Factor ETF ( VLUE ) had a disappointing 2022, lagging traditional value peers like the Vanguard Mega Cap Value ETF ( MGV ) and the Schwab U.S. Large Cap Value ETF ( SCHV ) by 12.70% and 6.39%. Excessive volatility caused by reliance on Technology stocks was the main culprit, and why value investors should reject the deep-value strategy that VLUE follows. This article highlights how VLUE tends to recover slowly after market drawdowns and compares its fundamentals against other large-cap value ETFs with better track records and prospects.
ETF Overview
Strategy and Key Exposures
VLUE has tracked the MSCI USA Enhanced Value Index since September 1, 2015, after previously tracking the MSCI USA Value Weighted Index. Large-cap stocks are selected based on three screens:
- Price-To-Book Value
- Price-To-Forward Earnings
- Enterprise Value-To-Cash Flow From Operations
A fixed number of securities are selected and weighted based on each security's final value score. Reconstitutions occur on the last business day of May and November, meaning there were some recent changes. I'll discuss them in more detail shortly, but the main takeaway is increased volatility. Current constituents have a weighted-average 1.08 five-year beta compared to 1.03 previously. With value stocks, that's generally indicative of a "deeper-value" portfolio.
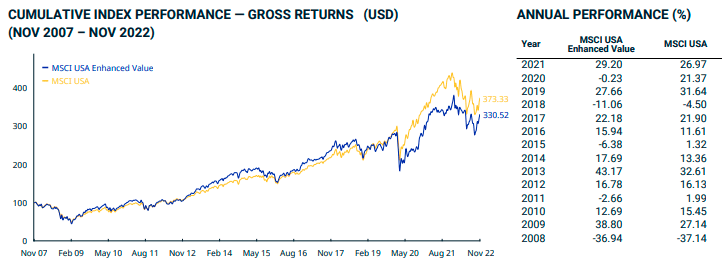
The Enhanced Index returns are below, but remember that results from 2008-2014 are backtested. In the seven years from 2015-2021, the Index unperformed the broader MSCI USA Index four times. In 2020, the Index barely broke even as growth stocks led markets to a 21.37% gain.
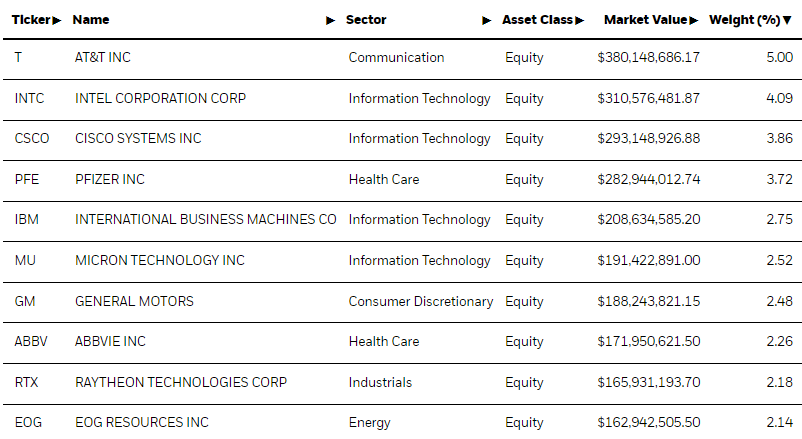
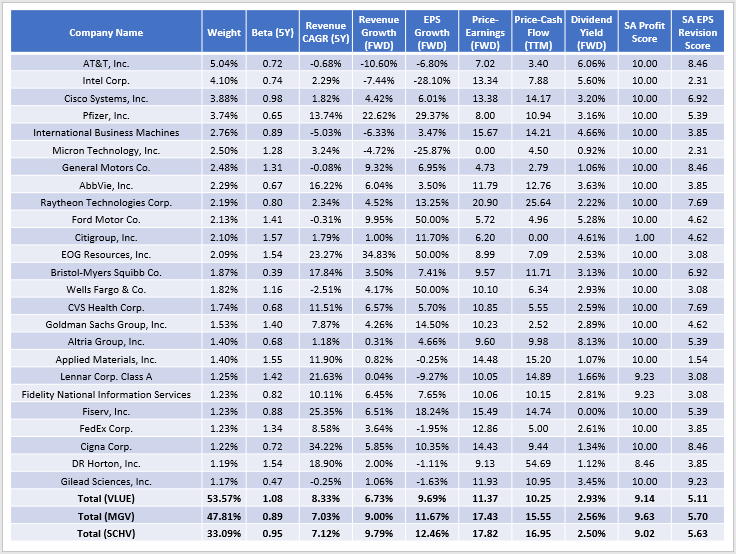
VLUE's top ten holdings are below, led by AT&T ( T ), Intel ( INTC ), and Cisco Systems ( CSCO ). These are primarily legacy companies with low growth expectations, possibly leading the ETF to underperform in a bull market. The idea is that these companies are undervalued, but there are usually good reasons for the relatively low prices.
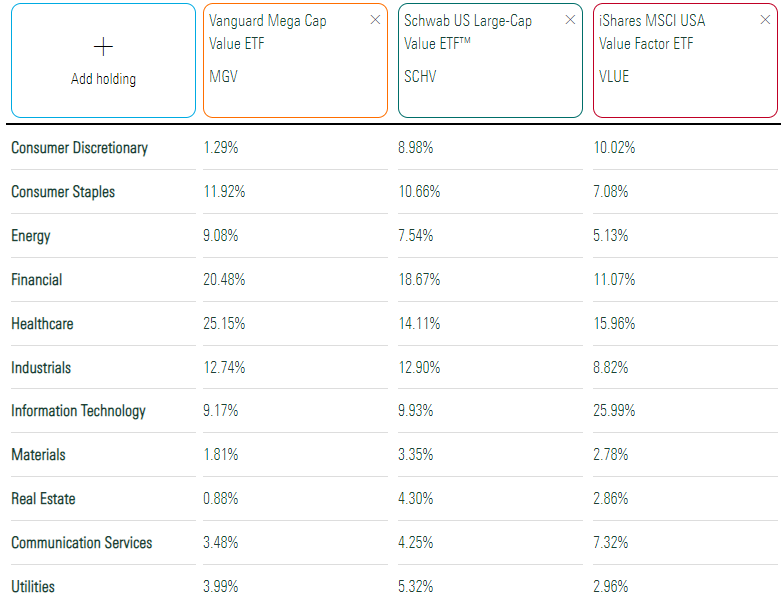
Readers may be surprised at VLUE's sector exposures, which is 26% Technology. International Business Machines ( IBM ), Micron Technology ( MU ), and Applied Materials ( AMAT ) round out the sector's top five. Compared with MGV and SCHV, VLUE underweights Financials, a favorite among value investors due to their low P/E ratios. In my view and from a diversification perspective, MGV and SCHV are more appropriate, while VLUE can be used to complement these ETFs.
Performance Analysis
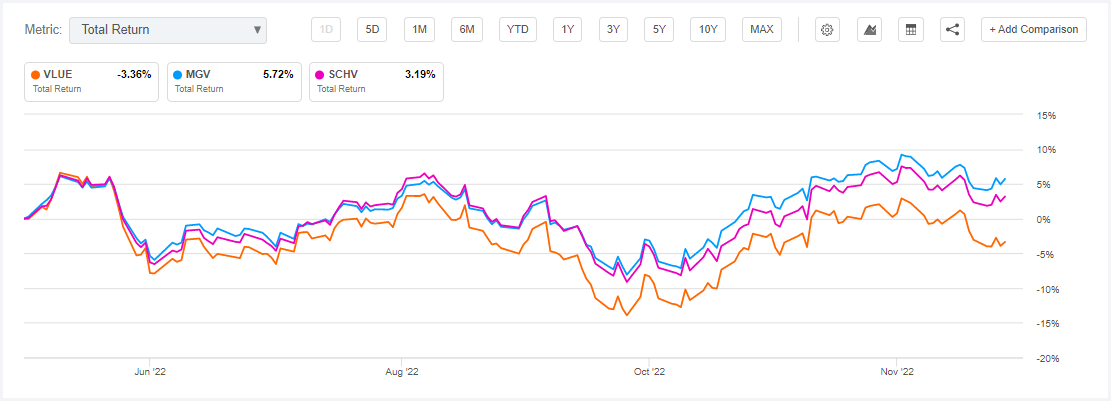
When I last reviewed VLUE , I compared it with MGV and predicted it would underperform. Since May 20, 2022, VLUE has lagged MGV and SCHV by 10.08% and 6.55%. Despite the market favoring low P/E stocks, VLUE's approach didn't succeed.
Since January 2015, VLUE gained an annualized 6.83% compared to 9.62% and 8.10% for MGV and SCHV. In addition, VLUE lagged the SPDR S&P 500 ETF ( SPY ) by 3.26% per year with higher volatility. Although VLUE underperformed these alternatives from the start, it's been slow to recover after the Q1 2020 crash.
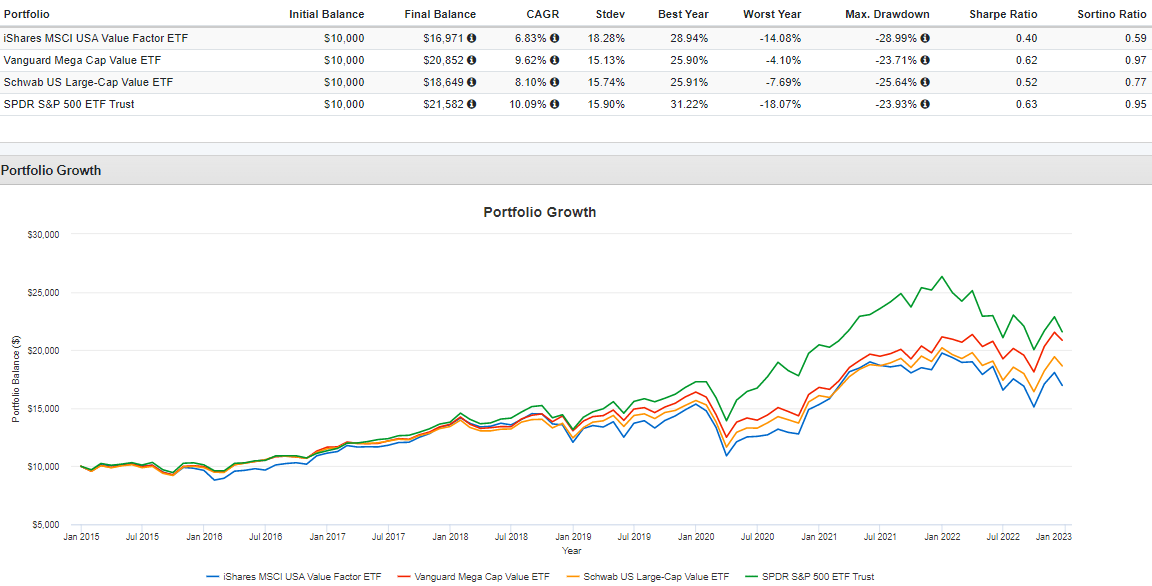
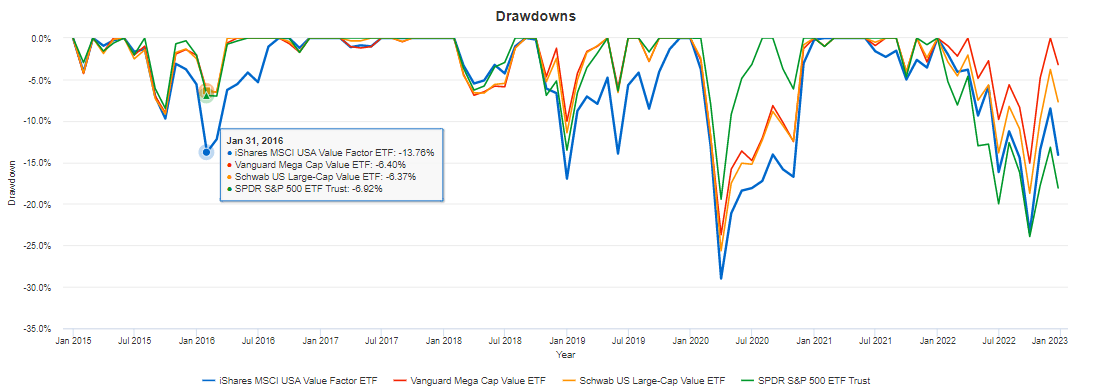
In addition to the slow recovery in 2020, VLUE also was slow to recover in 2016. The drawdown ending that January was more significant than MGV and SCHV and took seven months to recover fully. Therefore, investors should refrain from assuming VLUE represents a great buying opportunity. Instead, putting your money into value ETFs with better growth prospects is smarter.
ETF Analysis
Fundamental Snapshot By Company
Better growth is precisely what MGV and SCHV offer and they take some of the risks away by being more diversified at the company, industry, and sector levels. I've listed selected fundamentals for VLUE's top 25 holdings below, which account for 53.57% of the portfolio. The portfolio's 1.08 five-year beta indicates much higher volatility than MGV and SCHV, though it may not be apparent when looking at the first few holdings.
VLUE's constituents have grown sales by 8.33% over the last five years, better than 7.03% and 7.12% for MGV and SCHV. However, fortunes are estimated to reverse going forward. VLUE's constituents have a 6.73% and 9.69% projected sales and earnings growth rate, about 2-3% behind MGV and SCHV. Intel ( INTC ) trades at just 13.34x forward earnings but has a -28.10% estimated EPS growth rate. The earnings story is arguably direr with Micron Technology ( MU ), as analysts expect negative EPS next fiscal year. Overall, the 5.11/10 EPS Revision Score captures this negative sentiment. MGV and SCHV have much stronger scores and, thus, stronger short-term momentum.
Technology Stocks: Negative Almost Across The Board
VLUE holds 27/150 Technology companies whose average shares are down 27.22% YTD compared to 25.26% for the Invesco S&P 500 Equal Weight Tech ETF ( RYT ). Only three are positive on the year ( IBM , HPE , AZPN ), demonstrating the importance of investing in the right sectors. Low P/E ETFs had an excellent 2022, but even though these companies traded at just 16.01x forward earnings to begin the year, they didn't perform nearly as well as those in the Consumer Staples and Utilities sectors. I mention this because regardless of an ETF's fundamentals, having a healthy allocation to these defensive sectors is crucial.
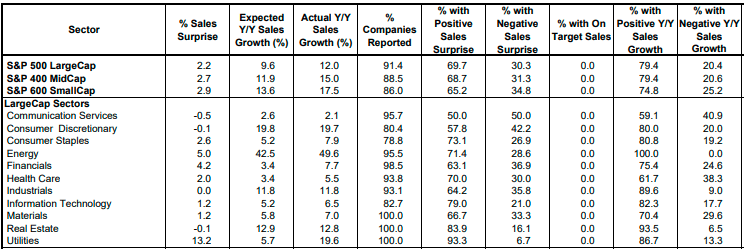
There are often good reasons for a company's share price decline. To illustrate, consider this table by Yardeni Research highlighting how the Technology sector experienced only 6.5% annual sales growth last quarter. For a supposedly high-growth sector, these results could be better. Regarding VLUE, 20/27 companies have less than double-digit year-over-year sales growth, so investors expecting a sharp turnaround may be disappointed.
Investment Recommendation
I'm not sold on VLUE's strategy and don't recommend investors buy it. An analysis of past performance reveals how VLUE recovers slower than other value ETFs like MGV and SCHV. Furthermore, the portfolio is overly reliant on low-growth Technology stocks that will almost certainly substantially underperform in the eventual recovery. Investors are better off diversifying by sector and aiming for a higher-growth value ETF, even if they pay more for it through higher valuations. For me, MGV and the Vanguard Value ETF ( VTV ) are suitable, and if you are wondering how other value ETFs compare to these choices, please feel free to leave a comment below.
For further details see:
VLUE: Why Deep-Value Tech Doesn't Work