VO - VO: A Bit Overvalued Compared To Other Peer Mid-Cap ETFs
2024-01-15 00:57:23 ET
Summary
- Vanguard Mid-Cap Index Fund ETF warrants a hold rating due to a mixed outlook including a high valuation and mediocre growth of its top holding.
- Mid-cap ETFs offer diversification and stability compared to small caps while providing greater potential growth compared to large caps.
- VO has a low expense ratio and relatively good dividend yield, but other mid-cap ETFs may have stronger prospects looking forward.
Investment Thesis
Vanguard Mid-Cap Index Fund ETF ( VO ) warrants a hold rating due to multiple mixed factors impacting the fund. While it has a very low expense ratio and relatively good dividend yield, its valuation is high compared to other mid-cap ETF peers. Additionally, VO's top holding demonstrates high valuation despite mediocre growth and profitability. However, the fund has several other redeeming holdings further down in its top 10 that have strong prospects looking forward.
Fund Overview and Compared ETFs
Mid-cap companies are those with a total market capitalization between $2B and $10B. The advantage of investing in mid-cap is that these companies, and the ETFs that contain them, can offer more "room to grow" than large or mega caps while typically being more stable than small cap companies. Investors in mid-cap ETFs may also gain greater diversification from traditional S&P 500 funds or other cap-weight funds that are currently heavy in big tech.
VO is an ETF that seeks to track the performance of the CRSP US Mid Cap Index. With an inception in 2004, the fund has 338 holdings and $155.46B in AUM. The fund has the largest weight (18.10%) in industrials, followed by 14.40% in information technology, and 13.20% in consumer discretionary. For comparison purposes with VO, other mid-cap ETFs examined are Schwab U.S. Mid-Cap ETF ( SCHM ), iShares Core MidCap ETF ( IJH ), and John Hancock Multifactor Mid Cap ETF ( JHMM ).
Because these other funds have different objectives, their holdings and performance differ from VO. SCHM seeks to track the total return of the Dow Jones U.S. Mid-Cap Total Stock Market Index. Schwab's fund is more heavily weighted in industrials (20.40%) and financials (14.24%) than VO. IJH in general seeks to track the performance of an index composed of mid-cap U.S. equities . IJH is also heavy in industrials (20.94%), followed by financials (16.20%), and consumer discretionary (15.64%). JHMM targets a wide range of mid-cap U.S. stocks to capture the performance of mid-cap as a whole.
Performance, Expense Ratio, and Dividend Yield
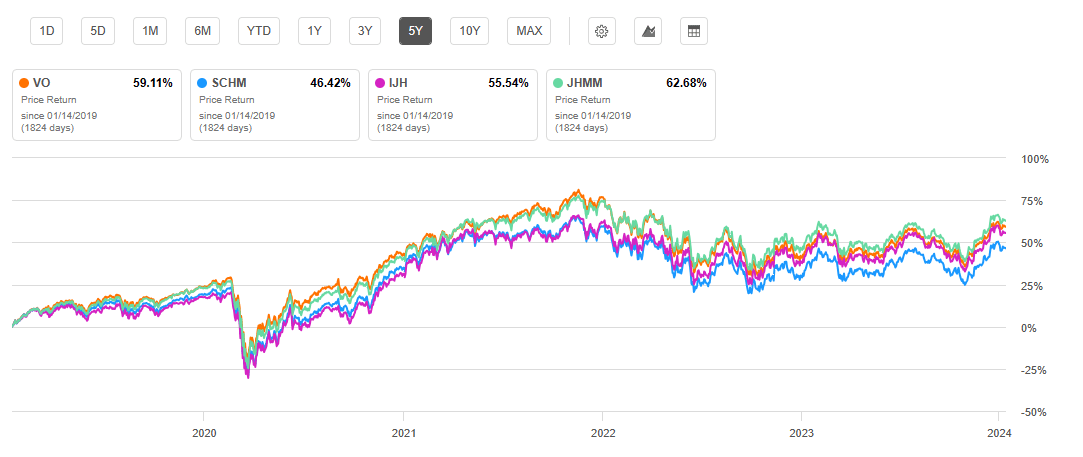
All mid-cap ETFs examined have seen lower performance than the S&P 500 index over the past five years. While the S&P 500 has seen a 5-year CAGR of 15.66%, VO has a 5-year CAGR of 12.73%. In comparison, IJH has a 5-year CAGR of 12.57%, SCHM's 5-year CAGR is 11.16%, and JHMM has a 5-year CAGR of 12.77%. A redeeming quality for VO is its very low expense ratio of 0.05%. The only mid-cap ETF examined with a lower expense ratio is Schwab's SCHM.
5-Year Total Price Return: VO and Mid-Cap Peer ETFs (Seeking Alpha)
VO and other mid-cap ETFs have modest dividend yields with VO having the highest of compared mid-cap ETFs at 1.54%. By comparison, the S&P 500 Index's dividend yield is roughly 1.45%. Additionally, VO's dividend yield has generally been increasing with a 5-year dividend CAGR of 7.00%.
Expense Ratio, AUM, and Dividend Yield Comparison
| VO |
| SCHM |
| IJH |
| JHMM |
| Expense Ratio |
| 0.05% |
| 0.04% |
| 0.05% |
| 0.42% |
| AUM |
| $155.46B |
| $10.55B |
| $75.20B |
| $3.55B |
| Dividend Yield TTM |
| 1.54% |
| 1.53% |
| 1.49% |
| 1.19% |
| Dividend Growth 5-Year CAGR |
| 7.00% |
| 8.56% |
| 7.20% |
| 8.34% |
Source: Seeking Alpha, 12 Jan 24
VO Holdings Compared to Peer ETFs
All mid-cap ETFs examined have a very different holdings mix. Additionally, because each ETF has over 300 holdings, the relative weight of each holding is less than 1.0%. SCHM's top holding, for example, is Pinterest, Inc. ( PINS ) at just 0.57% weight.
Top 10 Holdings for VO and others
| VO - 338 holdings |
| SCHM - 500 holdings |
| IJH - 405 holdings |
| JHMM - 680 holdings |
| APH - 0.85% |
| PINS - 0.57% |
| XTSLA - 0.83% |
| DHI - 0.72% |
| MSI - 0.84% |
| PTC - 0.52% |
| DECK - 0.73% |
| URI - 0.63% |
| AJG - 0.84% |
| DELL - 0.52% |
| RS - 0.65% |
| LEN - 0.51% |
| ANET - 0.79% |
| CBOE - 0.48% |
| SMCI - 0.64% |
| AMP - 0.49% |
| TDG - 0.79% |
| NTAP - 0.47% |
| CSL - 0.60% |
| PHM - 0.49% |
| WELL - 0.76% |
| DECK - 0.46% |
| GDDY - 0.59% |
| GWW - 0.48% |
| PCAR - 0.75% |
| BMRN - 0.46% |
| WPC - 0.59% |
| AME - 0.45% |
| CTAS - 0.75% |
| TYL - 0.46% |
| GGG - 0.57% |
| HIG - 0.43% |
| MCHP - 0.71% |
| FDS - 0.45% |
| LII - 0.57% |
| ROK - 0.40% |
| DXCM - 0.70% |
| AXON - 0.45% |
| WSO - 0.56% |
| BLDR - 0.40% |
Source: Multiple, compiled by author on 12 Jan 24
All ETF investors know that a fund's future performance is tied to the returns of its individual holdings. While all mid-cap ETFs compared are highly diversified with low weight on each one of its holdings, VO has both positive and negative holdings. Two examples of positive holdings are Arista Networks, Inc. ( ANET ) and Microchip Technology Incorporated ( MCHP ). A negative example, however, is Amphenol Corporation ( APH ). Further details for each of these companies are discussed below.
APH - High Valuation with Low Growth
The first notable difference for VO is its heaviest weight on APH. This electronic component company has seen low growth at just 0.45% YoY revenue growth, 92% below its sector median. Additionally, its gross profit margin is mediocre at 32.26%, 34% below its sector median. Despite these unimpressive factors, its forward P/E GAAP is 31.66, which is higher than its sector median and its own 5-year average. While APH represents only 0.85% of VO's weight, the fund has several other holdings that have slightly unfavorable valuations when looking at their P/E or P/B ratios. This contributes to a high P/E ratio for VO overall which I will cover later.
ANET - Strong Profitability and Growth
A positive difference for VO is ANET. Artista Networks develops cloud networking solutions and is in the IT sector. VO is the only compared ETF with ANET in its top 10 holdings. The company demonstrates several very strong profitability and growth indicators looking forward. For example, its YoY revenue growth is 42.37%, 576% higher than its sector median. Additionally, the company is currently very profitable with a 60.76% gross profit margin and 33.97% net income margin. Therefore, while VO contains several overvalued holdings, it does have redeemable holdings including ANET.
MCHP - Solid All-Around Holding
Another example of a positive holding for VO is MCHP. This company, which develops microcontrollers, demonstrates a good all-around mix of growth, profitability, and favorable valuation. With a 21.17% YoY EBITDA growth, the company has a 67.93% gross profit margin and 28% net income margin. Despite these positive factors, it is still favorably valued with a forward P/E GAAP 16% below its sector median and forward EV/EBITDA 13% below its sector median.
Valuation and Risks to Investors
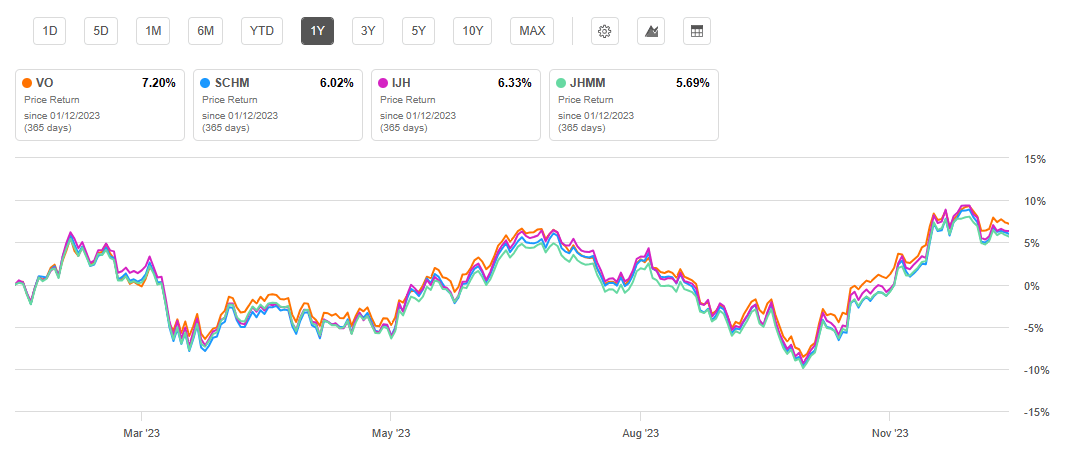
VO is currently trading at $229.43 at the time of writing this article. This is near the upper limit of its 52-week range of $194.80 to $234.05 but still notably below its all-time high of $258.95 seen back in November 2021. VO's performance over the past year has been better than peers with a one-year price return of 7.20%.
One-Year Price Return: VO and Peer Competitors (Seeking Alpha)
While VO has seen a solid one-year return, and decent historical performance, I see it as currently overvalued compared to peers. Looking at VO's price-to-earnings ratio, it is the highest at 19.3, compared to the average of the other three mid-cap ETFs examined (15.78). As discussed, this is a result of several top holdings of VO being overvalued in comparison to their profitability and growth. Looking at price-to-book ratio, VO is also highest at 2.8, compared to the average of peer ETFs (2.45).
Valuation Metrics for VO and Peer Competitors
| VO |
| SCHM |
| IJH |
| JHMM |
| P/E ratio |
| 19.3 |
| 16.05 |
| 14.66 |
| 16.63 |
| P/B ratio |
| 2.8 |
| 2.34 |
| 2.37 |
| 2.64 |
Source: Compiled by Author from Multiple Sources, 12 Jan 24
Because of its current high valuation in comparison to peers, I expect VO to perform sub-optimally compared to SCHM, IJH, or JHMM. JHMM, for example, has several very strong holdings in its top 10 including D.R. Horton, Inc. ( DHI ) and United Rentals, Inc. ( URI ). Therefore, I believe JHMM will be the contender for best performing mid-cap ETF among the four compared in this article.
While VO, and all mid-cap ETFs examined, have high diversification they are not without risk to investors. This can be seen in their volatility as measured by beta value. VO, for example, has a 60-month beta value of 1.10 indicating that it is more volatile than "the market" overall. Other peer mid-cap ETFs examined also have beta values greater than one. IJH, for example, has a 60-month beta higher than VO at 1.14. Therefore, while investors can expect a greater capacity for growth compared to large and mega cap stocks, a fair amount of volatility should be expected.
Concluding Summary
I am personally a fan of Vanguard's ETFs and own multiple. However, Vanguard's mid-cap ETF would not currently be my top choice. Despite a low expense ratio which is typical for Vanguard, as well as a relatively high dividend yield compared to peer mid-cap ETFs, VO has several holdings that have driven up its P/E and P/B ratios. While I expect the fund to perform roughly on par with its historical average looking forward, I believe other mid-cap funds, JHMM in particular, demonstrate the quantifiable metrics to outperform over the next year.
For further details see:
VO: A Bit Overvalued Compared To Other Peer Mid-Cap ETFs