VO - VO: Turning Bullish US Mid-Caps - Better Valuations Bullish Seasonals
2023-10-31 15:04:57 ET
Summary
- Stocks outside the US megacap Magnificent Seven have negative alpha this year.
- US mid-caps have historically provided the best long-term returns.
- The Vanguard Mid-Cap Index Fund ETF Shares is undervalued and has bullish seasonal trends, making it a good investment option.
- I outline key price levels to watch amid weak momentum on VO.
Nearly all stocks outside of the US megacap Magnificent Seven have produced negative alpha this year. Stretch out the performance scope to five years, and you'll also see heavy underperformance among value stocks, foreign equities, and domestic SMID caps.
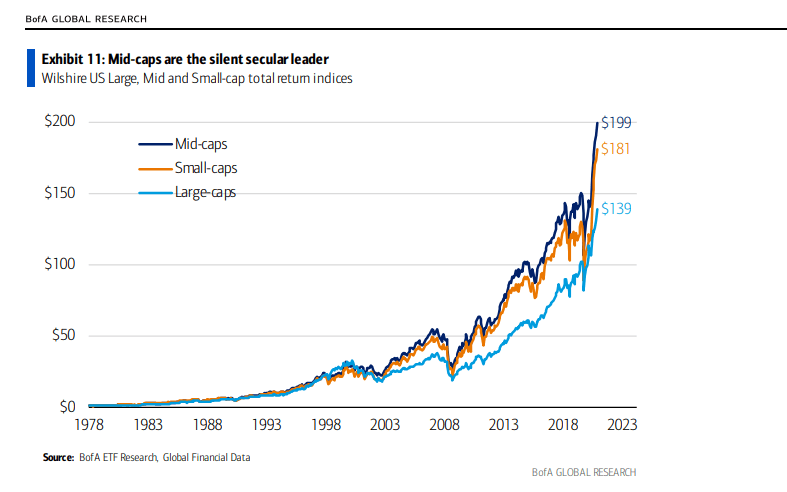
But did you know: It's not big glamour stocks, strength overseas, or US small-caps that produce the best long-term returns, at least according to historical data. US mid-caps have provided the best performance numbers dating back to the 1970s. BofA notes that $1 invested in 1978 would have produced $199 by 2019, easily outpacing large caps and small caps.
I have a buy rating (upgrade) on the Vanguard Mid-Cap Index Fund ETF Shares (VO). I assert that the valuation is cheap today and bullish seasonal trends should take hold over the next three months. While its technical situation is not stellar, long-term support is in play.
Mid-Caps: The Forgotten Group Of Long-Term Winners
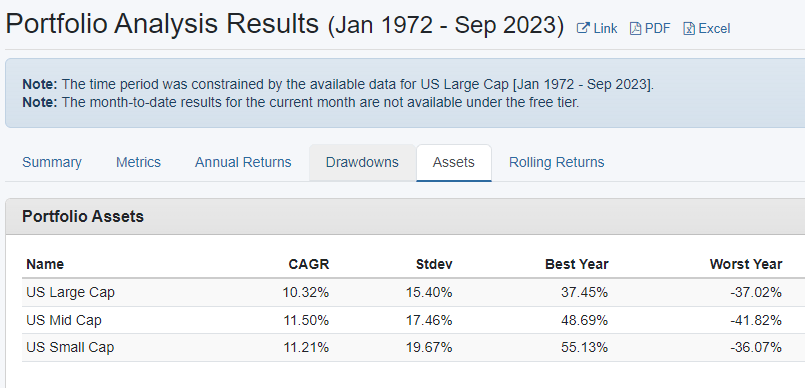
I also took a look at domestic mid-caps relative to other market-cap sizes since 1972. According to Portfolio Visualizer, mid-caps have returned 11.5% per annum over that more than 50-year period, topping both small and large caps (even with very strong returns among the very biggest US stocks in the last handful of years). So, keeping a low-cost mid-cap index fund as part of your core portfolio would seem to be a wise move.
Best US Stock Returns: Mid-Caps (Since 1972)
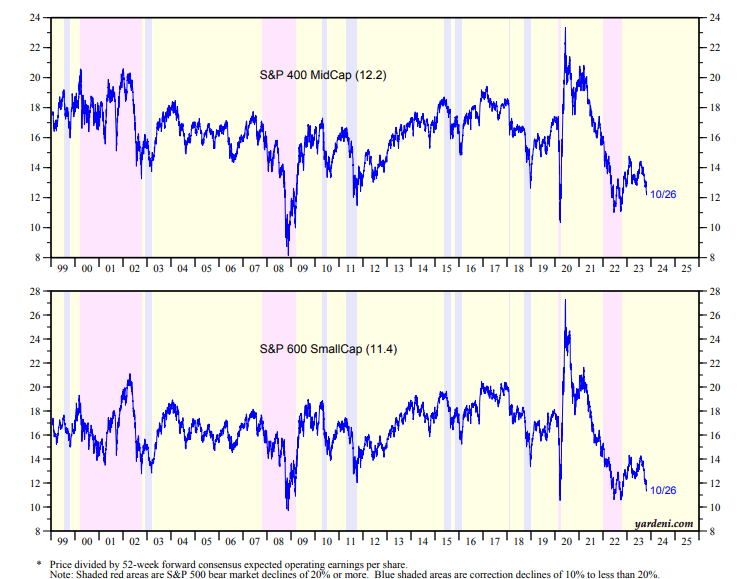
On valuation, mid-caps in general trade near 12 times earnings. While that's slightly more expensive compared with large and small caps, mid-caps tend to be less volatile than small caps while offering comparable (if not better) long-run returns.
US Mid-Caps: Just 12.2x Forward Earnings Estimates
For VO specifically, it is a large and liquid fund. The portfolio of 341 positions has total assets under management of about $49 billion, while its annual expense ratio is low at just four basis points. While share-price momentum is weak today, its trailing 12-month dividend yield of 1.77% is slightly above that of both the S&P 500 and the Russell 2000. VO also earns a strong B+ risk rating based on trading metrics while its median 30-day bid/ask spread is narrow, usually just three basis points.
According to Vanguard , VO seeks to track the performance of the CRSP US Mid Cap Index, which measures the investment return of mid-capitalization stocks. The ETF provides a convenient way to match the performance of a diversified group of mid-sized companies, and it follows a passively managed, full-replication approach.
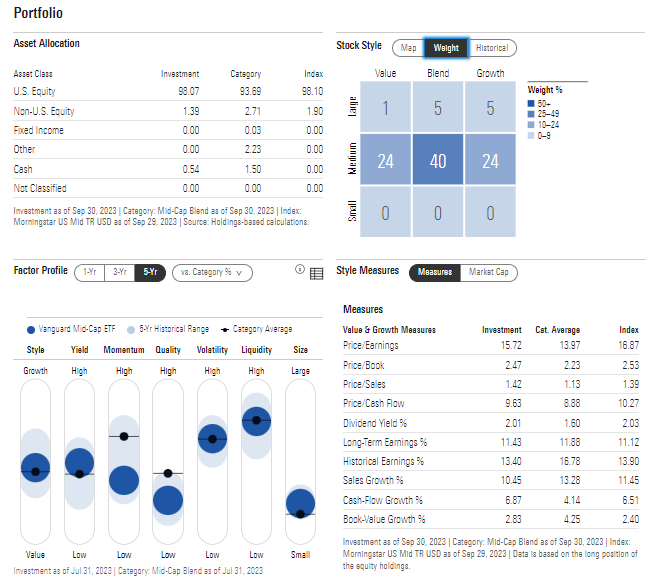
The ETF, 4-star and gold-rated by Morningstar, has diversification across the style box, with equal exposure to value and growth while long-term earnings growth is seen above 11%.
VO: Portfolio & Factor Profiles
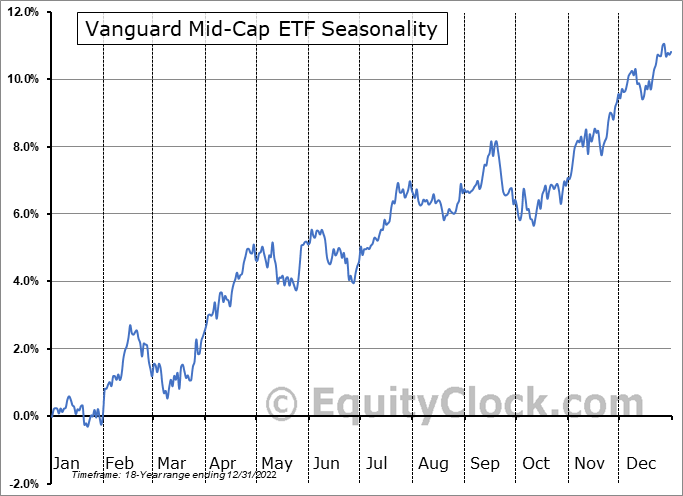
Seasonally, mid-caps tend to perform very well from mid-October through mid-February of the following year, according to data from Equity Clock . Furthermore, VO has historically outperformed the S&P 500 from late October through the middle of Q1 in the fund's 18-year history, so these trends suggest an overweight to mid-caps should be considered.
VO: Bullish Seasonal Trends Taking Hold
The Technical Take
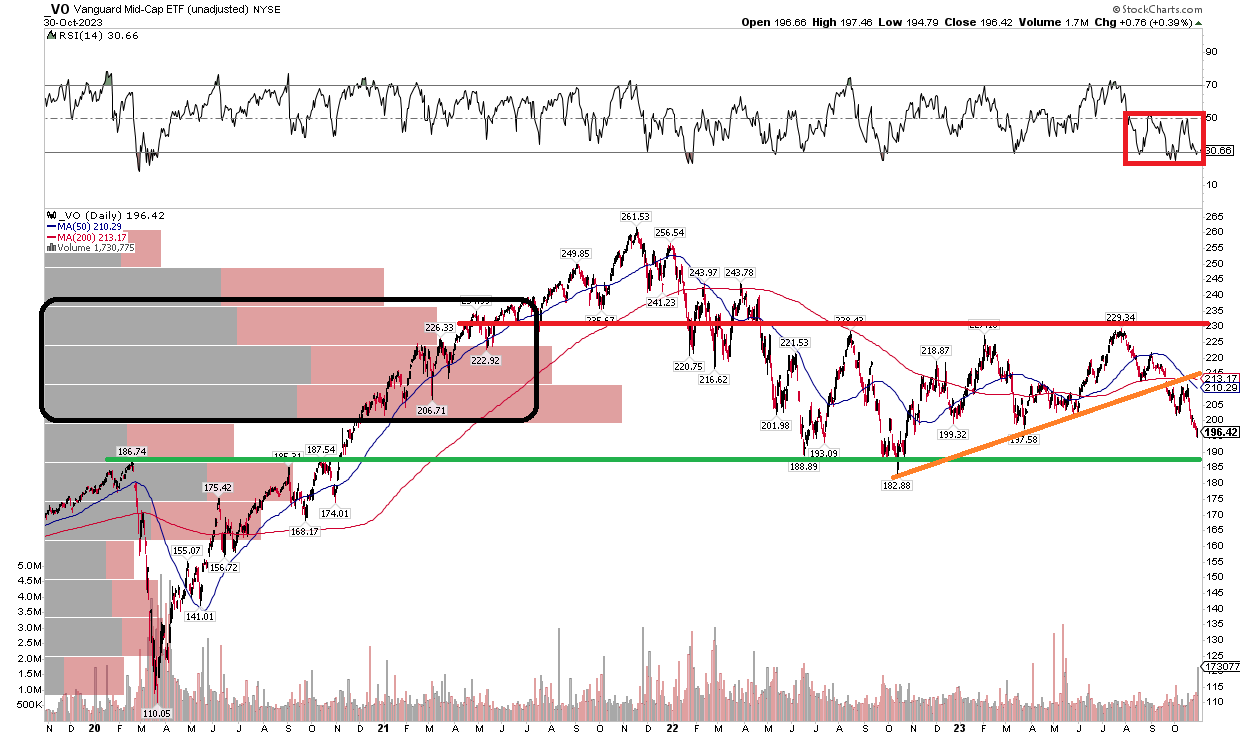
VO has been stuck in a frustrating trading range if you are a bull. Notice in the chart below that $183 to $229 has been the ongoing trading area since Q2 of last year. The fund briefly undercut its pre-Covid high of $187 at a low in October 2022, and with the ETF within 10% of that mark today, there is a real risk that it could re-test it. Supporting that narrative is a recent bearish death cross whereby the shorter-term 50-day moving average crossed below the long-term 200dma, while the 200dma has turned negatively sloped.
Also take a look at the RSI momentum indicator at the top of the chart - it's stuck in the notoriously bearish 20 to 60 zone - I would like to see that breakout to confirm a positive momentum reversal. Additionally, there is a high amount of volume by price in the $200 to $235 area - rallies to that range could be problematic as previous buyers may look to sell to get back to even.
Overall, it's not a bullish chart, and a breakdown under $182 could lead to a retreat into the next support spot near $168.
VO: Trading Range Persists, Eyeing Low $180s Support
The Bottom Line
I have been cautious on VO for the last several quarters, but I see the risk/reward skewing more to the positive side today despite the troubling technical take.
For further details see:
VO: Turning Bullish US Mid-Caps - Better Valuations, Bullish Seasonals