VONE - VONE Vs. BBUS: Comparing Expanded Large-Cap ETFs That Use Different Indices
2023-03-28 09:00:00 ET
Summary
- The Vanguard Russell 1000 ETF (VONE) invests based on the Russell 1000 index, and as the name suggests, holds roughly 1000 stocks.
- The JPMorgan BetaBuilders U.S. Equity ETF (BBUS) invests based on the Morningstar® US Target Market Exposure Index, which consists of about 600 stocks.
- Both ETFs are Large-Cap focused but have minor exposure to Mid-Cap stocks, thus my classification as Expanded Large-Cap ETFs.
- Both ETFs and their respective indices are reviewed. With their performance and risk numbers differing by little, which index or manager you prefer most likely will be the deciding factor between them.
(This article was co-produced with Hoya Capital Real Estate )
Introduction
A comment to my VTI Vs. SPTM For Total U.S. Equity Exposure article asked what I thought about the JPMorgan BetaBuilders U.S. Equity ETF ( BBUS ). I had not heard about it, took a look, I decided to provide a review since one had not been done since 2019. The second ETF reviewed, the Vanguard Russell 1000 ETF ( VONE ), uses the well known Russell 1000 Index, and is the lower cost option for that index.
The point of the aforementioned article was using either the Vanguard Total Stock Market ETF ( VTI ) or the SPDR Portfolio S&P 1500 Composite Stock Market ETF ( SPTM ) as a "Core" Total US Equity Market ETF. Both the VONE ETF and BBUS ETF could fill that role for an investor wanting to gain Small-Cap exposure elsewhere as neither of the ETFs reviewed here have much, if any, exposure in that market segment.
Vanguard Russell 1000 ETF review
Seeking Alpha describes this ETF as:
The investment seeks to track the performance of the Russell 1000 ® Index that measures the investment return of large-capitalization stocks in the United States. The fund advisor employs an indexing investment approach designed to track the performance of the Russell 1000® Index . VONE started in 2010.
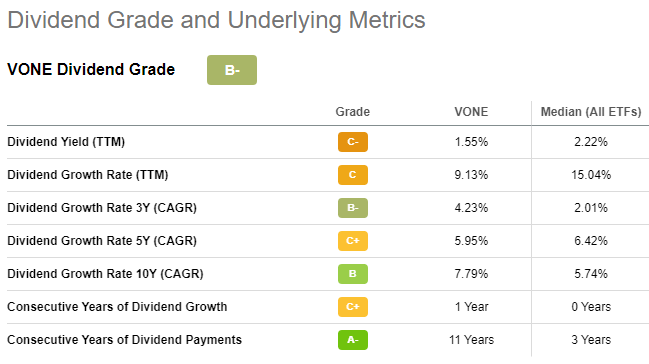
VONE has $3.4b in AUM and costs investors 8bps in fees. The TTM Yield is 1.55%.
Index review
Russell describes their index as:
The Russell 1000® Index measures the performance of the large-cap segment of the US equity universe. It is a subset of the Russell 3000® Index and includes approximately 1,000 of the largest securities based on a combination of their market cap and current index membership. The Russell 1000 represents approximately 93% of the Russell 3000® Index, as of the most recent reconstitution. The Russell 1000® Index is constructed to provide a comprehensive and unbiased barometer for the large-cap segment and is completely reconstituted annually to ensure new and growing equities are included.
Source: research.ftserussell.com R1000
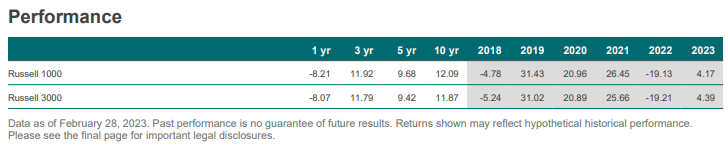
The next chart shows how the R1000 has done versus the R3000 Index, Russell's TM index. Until the last year, the R1000 was the better performing index.
research.ftserussell.com R1000
VONE holdings review
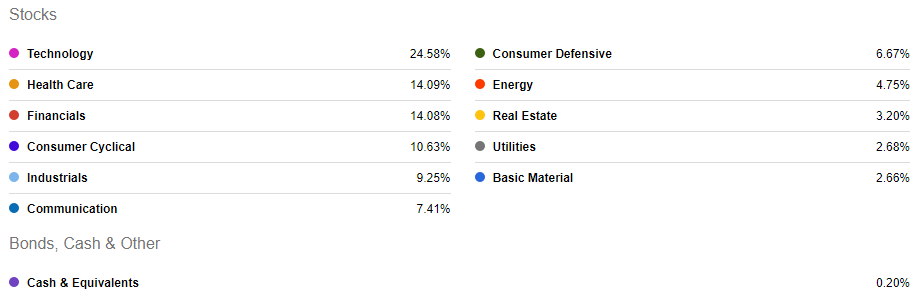
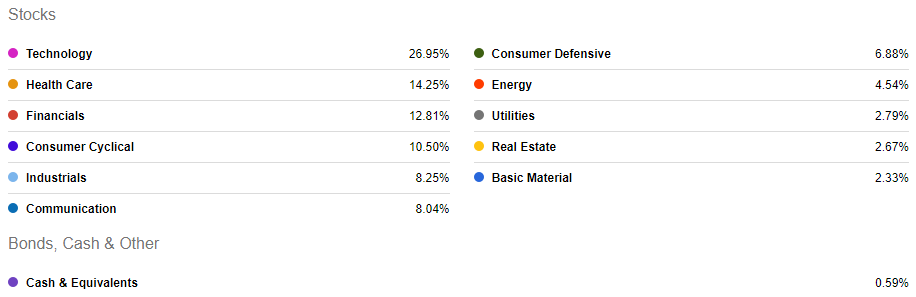
Adding 500 stocks outside the S&P 500 doesn't change the sector weights too much; Technology is down 2% for instance.
advisors.vanguard.com; compiled by Author
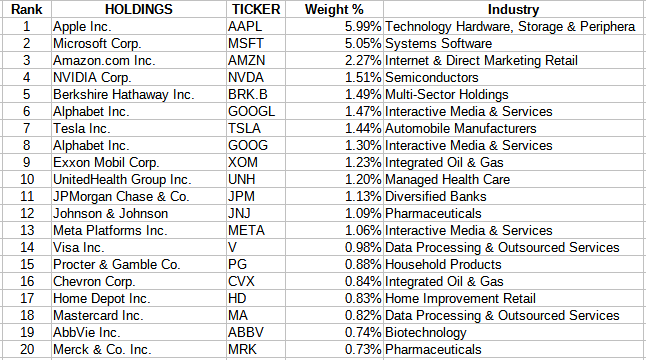
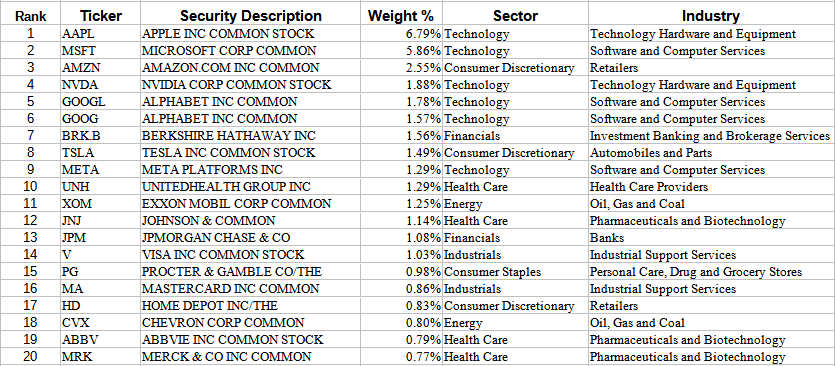
The Top 20 total 32% of the portfolio, even with 1000+ stocks held. Both Apple (AAPL) and Microsoft (MSFT) dominate, each with 5+% of the weight. One reason the sectors match up well with S&P 500 Indexed ETFs is the fact the smallest 500 stocks only come to 8% of the portfolio's weight.
VONE distribution review
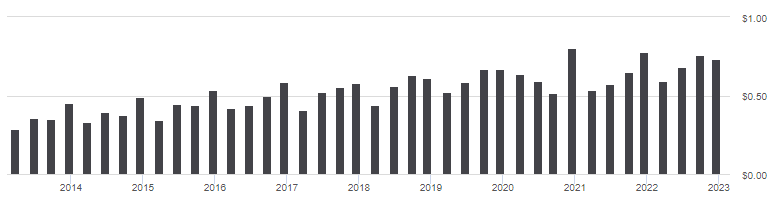
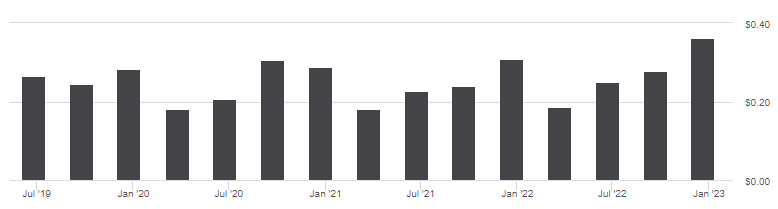
The payout pattern indicates the tendency for these stocks to pay an extra dividend at year-end. This has earned VONE a "B-" grade from Seeking Alpha.
seekingalpha.com VONE scorecard
JPMorgan BetaBuilders U.S. Equity ETF review
Seeking Alpha describes this ETF as:
The investment seeks investment results that closely correspond, before fees and expenses, to the performance of the Morningstar® US Target Market Exposure Index . The underlying index targets 85% of those stocks by market capitalization, and primarily includes large- and mid-cap companies. BBUS started in 2019.
BBUS has $1.3b in AUM and has a very low fee of only 2bps! The TTM Yield is 1.53%.
Index review
Morningstar describes their index as:
The Morningstar US Target Market Exposure Index targets large- and mid-cap U.S. stocks representing the top 85% of the market by float-adjusted market capitalization. This index does not incorporate Environmental, Social, or Governance ((ESG)) criteria.
Source: indexes.morningstar.com
The index rebalances quarterly and is reconstituted semi-annually.
BBUS holdings review
I will talk more about the sectors when comparing the ETFs.
am.jpmorgan.com; compiled by Author
Even though the stock count is only 600, versus a 1000 for VONE, the Top 20 are still below 36% of the portfolio. Here, the bottom half of the portfolio comprise 11% of the weight, more influence than the bottom half of VONE has.
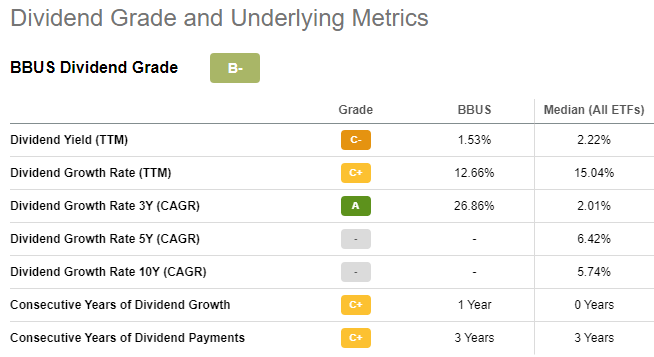
BBUS distribution review
This ETF shows a similar pattern as the other ETF, with higher payouts also occurring in December. BBUS also got a "B-" grade.
seekingalpha.com BBUS scorecard
Comparing ETFs
Before adding a third ETF, here is how the holdings of VONE and BBUS overlap.
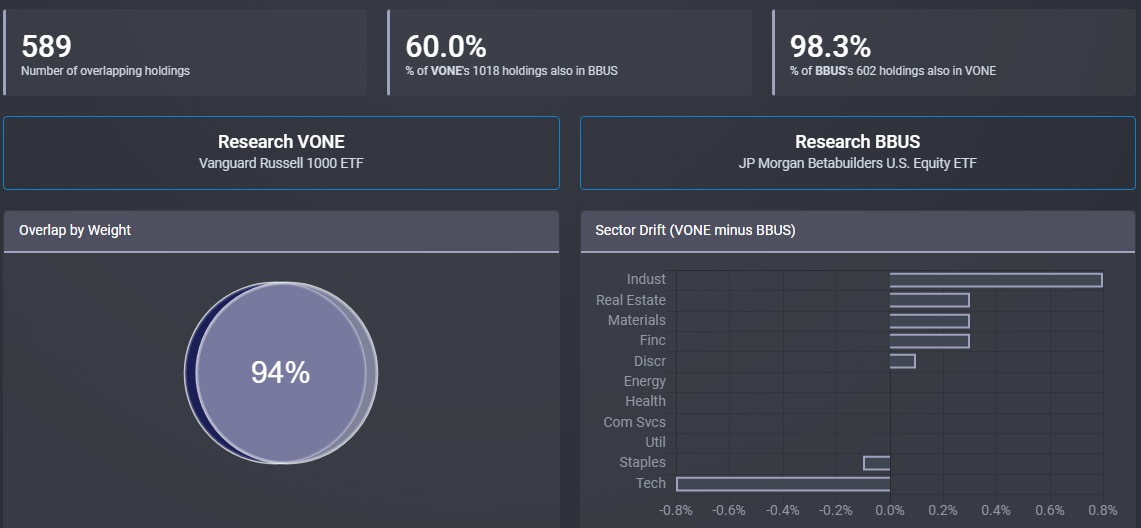
Being smaller, all but 13 stocks held BBUS are also in VONE, versus only 60% of VONE stocks being in BBUS. As I will show later, those extra stocks are doing little to improve the statistics for BBUS. As for sector weights, only two show a "big" difference and that is below 1% in weight.
Since I referred to these as expanded Large-cap ETFs, I include the Vanguard S&P 500 ETF ( VOO ) here since it invests based on the index most associated with Large-Cap stocks, though it holds smaller ones too. Since market-cap is the focus, I will start with that comparison.
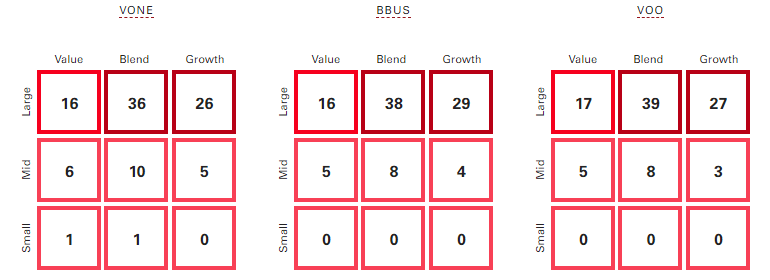
If the above allocations were the deciding factor, the VONE ETF provides greater market-cap diversity than the others, with BBUS and VOO almost the same.
Since the spring of 2019 when BBUS started, the results show over that almost that four year period, the index selection beyond the S&P 500 Index had a slight negative effect on returns and the risk ratios, but not enough to warrant changing ETFs. When comparing portfolios, the overlaps run between 90-94% across each comparison run.
seekingalpha.com VONE seekingalpha.com BBUS
The rank within the Sub Class clearly favors the VONE ETF, though VOO's 16th rank beats the other two by a large margin.
Portfolio strategy
The concept of using index-based ETFs as "Core" holdings was mentioned earlier, and an article link was provided. If one's portfolio is large enough, using a Buy/Hold Core strategy can make sense for the following reasons:
- Provides a set percent that should "match the market" regardless of the skill of the investor.
- Provides a platform from which the investor can pick theme-oriented ETFs, including actively managed ETFs in hopes of "beating the market" with that part of their portfolio.
- If treated as long-term investments, Core ETFs provide more time to actively manage the other parts of their portfolio or learn a new skill like option writing for added income.
Final thoughts
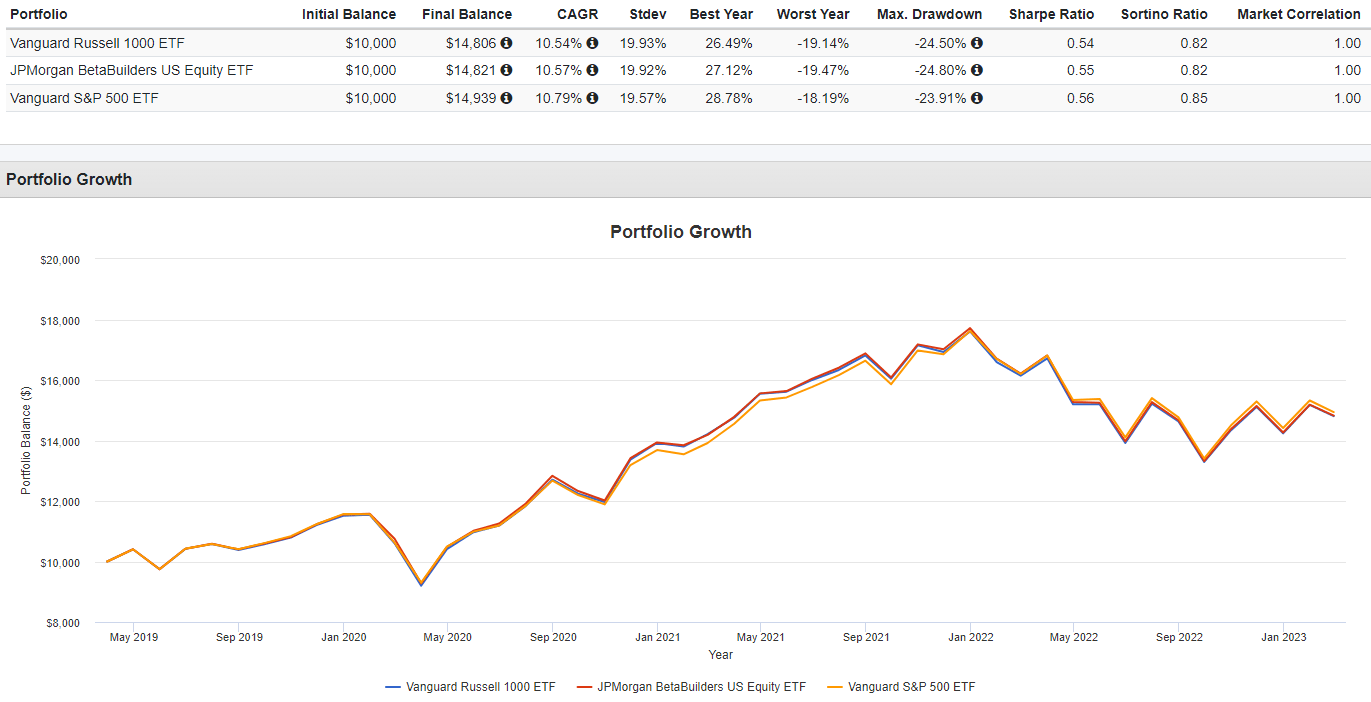
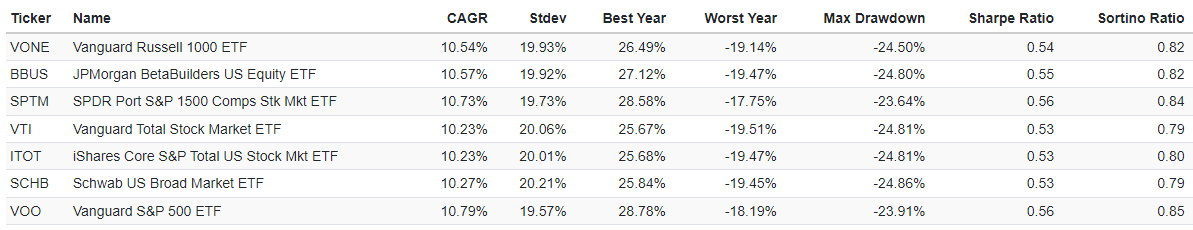
As I did in closing my IWV: For Total US Market Exposure, There Are Better Choices article, a related ETF to those covered here, remember “Do not let the number of possible ETFs cause you, especially long-term investors, to stay in cash unless that is your active decision”. As the next table shows, the difference in returns and risk even out over long periods. I included the VOO ETF to compare these LC-expanded and Total-Market ETFs against.
Since BBUS started almost four years ago, VOO has the highest CAGR and lowest StdDev. The Sharpe and Sortino ratios are all very close. Choosing between any of these ETFs seems to come down to fees and manager preference.
For further details see:
VONE Vs. BBUS: Comparing Expanded Large-Cap ETFs That Use Different Indices