SPYG - VONG: Vanguard's Russell 1000 Growth ETF Wins With Consistency
2023-05-05 15:26:44 ET
Summary
- VONG tracks the Russell 1000 Growth Index and incorporates forward-looking earnings estimates into its screens. Its expense ratio is 0.08% and VONG has $11 billion in AUM.
- VONG is rarely a top-performer. Instead, VONG consistently ranks in the second or third quartile compared with other growth ETFs. This consistency led to a category-leading 465% return since 2010.
- I like VONG's exposure to the growth factor and how it trades at a cheaper valuation compared to the Vanguard Mega Cap Growth ETF. It's a good long-term pick.
- VONG's constituents are also performing well this earnings season. While I require more than just one quarter of good news before issuing a buy rating, I'm cautiously optimistic.
- VONG is a hold today, and I look to revisit this rating next quarter.
Investment Thesis
The Vanguard Russell 1000 Growth ETF ( VONG ) has been a consistent performer in the large-cap growth category since its inception, delivering an impressive 465% total return through April 2023. VONG also has solid exposure to the growth factor, and its constituents are performing well this earnings season, indicating a potential turnaround in market sentiment. I'm cautiously optimistic about growth stocks, and this article aims to highlight why VONG should be on your shortlist if earnings momentum continues.
VONG Overview
Strategy Discussion
VONG tracks the Russell 1000 Growth Index , selecting large-cap stocks with higher price-book ratios, higher two-year consensus estimated earnings growth, and higher five-year trailing historical sales per share growth. The Index reconstitutes annually and is designed as an unbiased barometer for the segment. VONG's expense ratio is 0.08%, lower than the 0.18% for the iShares Russell 1000 Growth ETF ( IWF ), which tracks the same Index. IWF has $62 billion in AUM compared to VONG's $11 billion, but its higher expense ratio impacts performance. You might assume the difference is negligible, but it's turned into a 6.25% total return difference since October 2010.
Sector Exposures and Top Ten Holdings
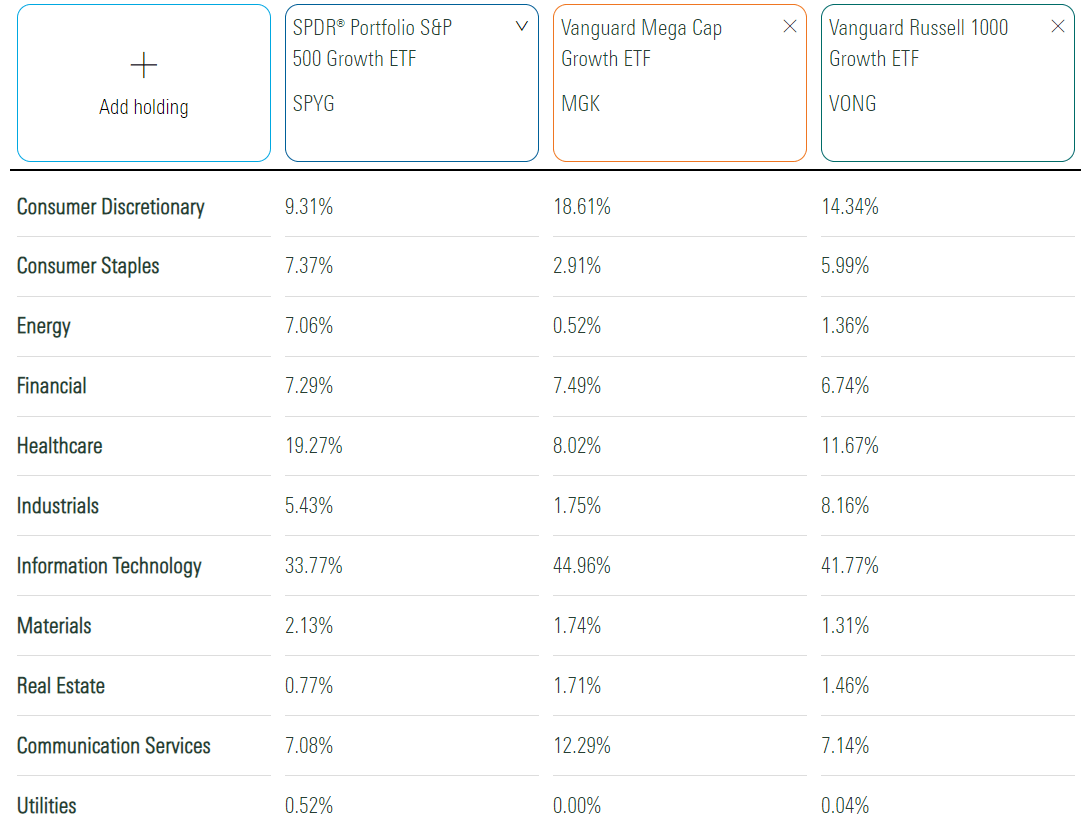
Eight large-cap growth ETFs have at least as much history as VONG. The SPDR S&P 500 Growth ETF ( SPYG ) and the Vanguard Mega Cap Growth ETF ( MGK ) are two, and I've listed their sector exposures below. Surprisingly, there are significant differences. Compared to SPYG, VONG underweights Energy and Health Care by 6% and 8% and overweights Consumer Discretionary and Technology by 5% and 8%.
VONG's composition is more traditional for a growth fund. Energy exposure in SPYG moved higher after S&P Style Indices reconstituted in December. In exchange, stocks like Microsoft ( MSFT ), Amazon ( AMZN ), and Meta Platforms ( META ) moved closer to the value side. Part of my analysis today includes a fundamental evaluation of all three ETFs so you can see which factors each scores well on.
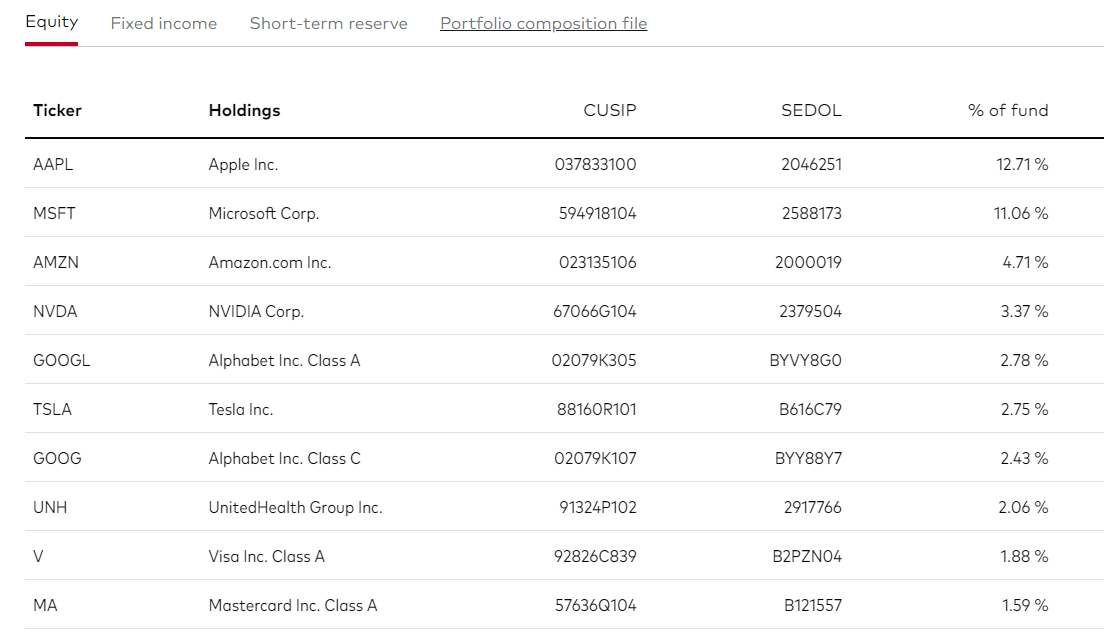
Finally, VONG's top ten holdings are listed below. Vanguard's holdings aren't updated until midway through the second month, or in this case, May 15, 2023. However, you can derive the latest weightings using the Portfolio composition file, underlined in the image below. I've done that for my analysis and will highlight the top 25 later.
Apple ( AAPL ) and Microsoft comprise nearly one-quarter of the portfolio. Alphabet's two share classes combine for 5.53%, making it the third-largest holding, followed by Amazon and NVIDIA ( NVDA ). It's a concentrated fund, but that's not necessarily a negative. Let's look at performance next.
Performance Analysis
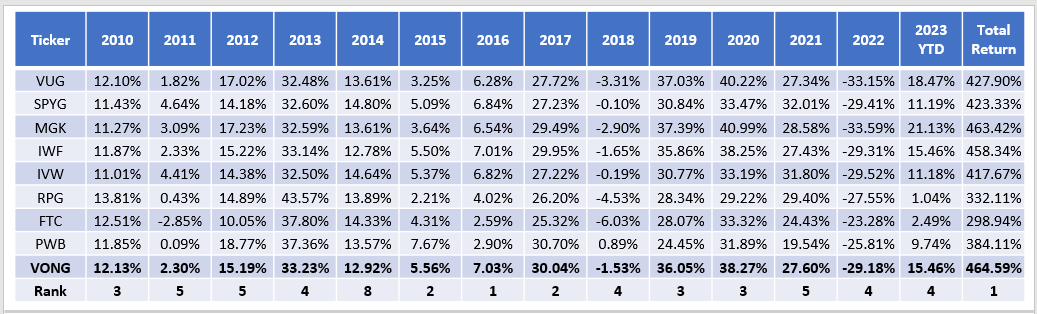
The following table summarizes historical annual returns for VONG and its seven peers since October 2010. I've also included VONG's rank (out of eight) in the last row. Notice how except for 2014 and 2016, VONG consistently ranked close to the middle. However, its 464.59% total return through April 2023 is the highest. In other words, consistency matters.
In contrast, look carefully at the Invesco Dynamic Large Cap Growth ETF ( PWB ). It was the top performer in 2012, 2015, 2017, and 2018. However, it was also the worst or second-worst in 2011, 2016, 2019, 2020, and 2021. The result is a relatively poor 384.11% return, good enough for just seventh place.
Portfolio Visualizer is my data source for the table above, and the following table provides some additional risk metrics for the three funds. It may seem small, but VONG delivered roughly the same return as MGK but with less volatility, leading to better risk-adjusted returns (Sharpe Ratio). In addition, VONG's downside risk-adjusted returns (Sortino Ratio) were superior partly because of a lower maximum drawdown.
VONG Analysis
Fundamental Snapshot By Company
The following table highlights selected fundamental metrics for VONG's top 25 holdings, totaling 61% of the portfolio. Summary metrics for VONG, SPYG, and MGK are in the final rows.
A few observations:
1. VONG's weighted average market capitalization is higher than SPYG, a surprising statistic because VONG has a broader selection universe. The primary reason is that VONG has 4% more exposure to Microsoft. MGK, as its name implies, is by far the largest. Apple, Microsoft, and Alphabet combine for 37.3% exposure compared to 30.1% in VONG.
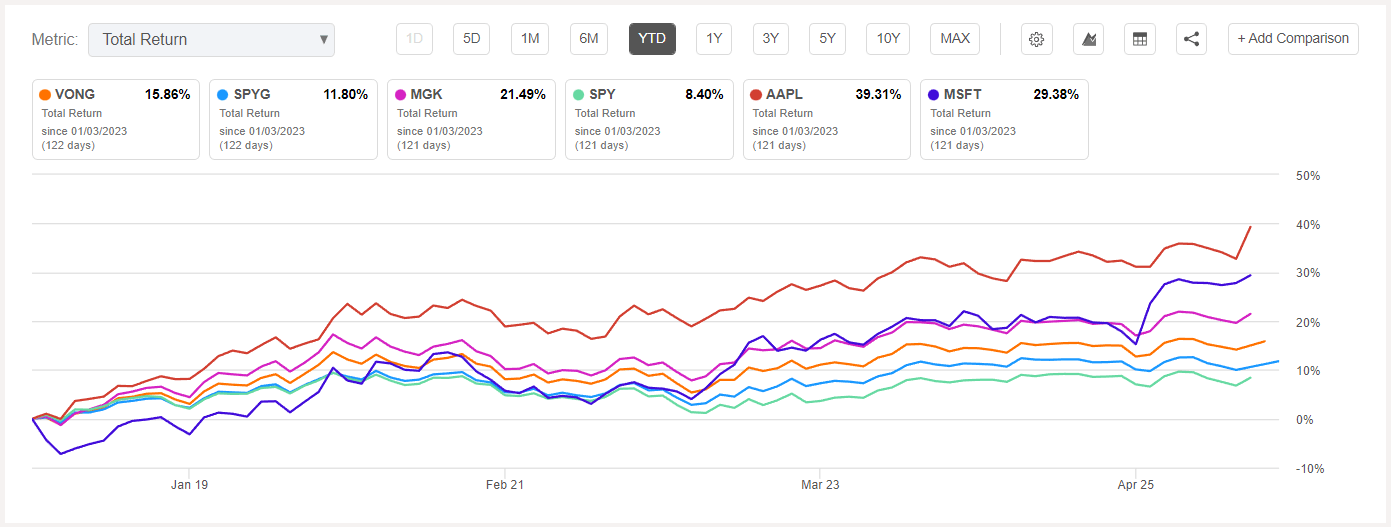
2. VONG's 1.10 five-year beta sits between SPYG and MGK. It's one statistic that I'm slightly uncomfortable with because I'm careful not to jump into a growth fund at the first sign of good news. All three ETFs lead the SPDR S&P 500 ETF ( SPY ) YTD. As shown below, Apple and Microsoft are key contributors.
3. VONG and MGK have better exposure to the growth factor. Analysts expect 10% sales, EBITDA, and EPS growth over the next twelve months compared to 8-10% for SPYG. These metrics are most important for the type of investor VONG seeks to attract. I also calculated a weighted average Growth Score of 4.25/10 and 4.54/10 for VONG and MGK using Seeking Alpha Factor Grades. In comparison, SPYG scored 3.70/10.
4. VONG trades at 29.87x forward earnings, about two points less than MGK. I think VONG offers a better deal for the growth, and that's related to the recent run-up of mega-cap growth stocks. While SPYG trades at a lower 26.13x forward earnings, it's a growth-light version of the SPDR S&P 500 ETF ( SPY ). Consider SPY's statistics below:
- Estimated Revenue Growth Rate: 7.76%
- Estimated EBITDA Growth Rate: 8.14%
- Estimated EPS Growth Rate: 7.99%
- SA Growth Score: 4.00/10
- Forward Price-Earnings Ratio: 24.47x
It's close, and SPY's growth score is actually superior. If you hold something similar already, I see little benefit in adding SPYG.
Earnings Season Results
The table above also lists the latest earnings surprises for VONG's top holdings. Yardeni Research compiles aggregate figures for S&P 500 stocks, and things are looking up so far. The aggregate earnings surprise through May 3, 2023, is 7.9%, slightly above the long-term 5-7% average.
One quarter is not a trend, but growth stocks underperformed when aggregate earnings surprises began trending downward in late 2021. A return of above-average earnings surprises could give growth stocks a jolt not seen in a year.
The weighted-average earnings surprise for VONG's constituents is even better at 10.55%. Apple surprised to the upside by 6% on "impressive" iPhone sales , and the stock is up nearly 5% at the time of writing. Microsoft, Alphabet, and NVIDIA also had about 10% earnings surprises.
Investment Recommendation
VONG is a consistent performer in the large-cap growth space, and that consistency has led to category-leading returns since October 2010. It has a low 0.08% expense ratio, good exposure to the growth factor, and strong earnings momentum led by mega-caps like Apple and Microsoft. I'm only cautiously optimistic because more than one month of above-average earnings surprise figures is required. However, I plan to review VONG again next quarter, and if the upward trend continues, I expect to issue a buy rating. Thank you for reading, and I look forward to your comments below.
For further details see:
VONG: Vanguard's Russell 1000 Growth ETF Wins With Consistency