FVAL - VONV: Attractive Valuation Average Performance
2023-07-07 08:00:00 ET
Summary
- Vanguard Russell 1000 Value Index Fund ETF Shares favors stocks with a low price-to-book, low sales growth and low projected earnings growth.
- It is better diversified across sectors and holdings than its parent index.
- In 23 years, the underlying index doesn’t show excess return over the Russell 1000.
- Performance is average among its peers.
- Most value funds have two shortcomings, this one is no exception.
This dividend ETF (exchange-traded fund) article series aims at evaluating products regarding the relative past performance of their strategies and quality of their current portfolios. As holdings and their weights change over time, reviews may be updated when necessary.
VONV strategy and portfolio
Vanguard Russell 1000 Value Index Fund ETF Shares ( VONV ) started investing operations on 09/20/2010 and tracks the Russell 1000 Value Index. It has a portfolio of 848 stocks, a 12-month distribution yield of 2.14% and a total expense ratio of 0.08%. Distributions are paid quarterly. Its closest competitor is iShares Russell 1000 Value ETF ( IWD ), which tracks the same underlying index. IWD is older, and it has larger assets and volume.
| VONV |
| IWD |
| AUM |
| $6.58B |
| $50.89B |
| Avg Daily Volume |
| $29.76M |
| $240.72M |
| Expense Ratio |
| 0.08% |
| 0.18% |
| Inception |
| 09/20/2010 |
| 5/22/2000 |
As described by FTSE Russell ,
The Russell 1000® Value Index measures the performance of the large cap value segment of the US equity universe. It includes those Russell 1000 companies with relatively lower price-to-book ratios, lower I/B/E/S forecast medium term growth* (2 years) and lower sales per share historical growth (5 years).
* projected earnings growth.
The underlying index represents about half of the total market value of the Russell 1000. It is reconstituted annually.
VONV invests almost exclusively in U.S. companies (about 98% of asset value), mostly in the large cap segment (about 66% of assets). As expected, VONV is cheaper regarding aggregate valuation ratios than its parent index, represented in the next table by iShares Russell 1000 ETF ( IWB ).
| VONV |
| IWB |
| Price / Earnings TTM |
| 15.55 |
| 20.72 |
| Price / Book |
| 2.11 |
| 3.61 |
| Price / Sales |
| 1.57 |
| 2.28 |
| Price / Cash Flow |
| 10.75 |
| 14.75 |
Source: Fidelity.
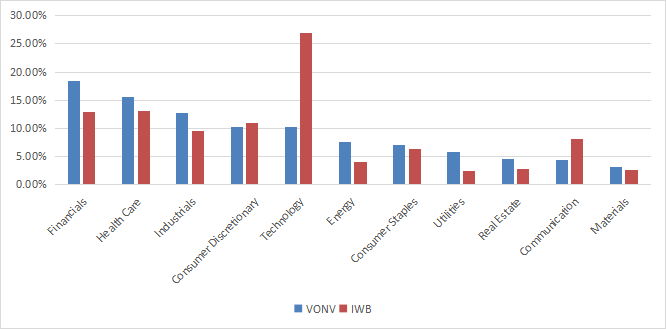
The top 3 sectors are financials (18.4%), healthcare (15.5%) and industrials (12.8%). Other sectors are below 11%. Compared to the Russell 1000, the fund massively underweights technology, and to a lesser extent communication services. This results in a better diversification across sectors.
Sector breakdown (chart: author; data: Vanguard, iShares)
VONV currently holds 848 stocks. The top 10 holdings, listed in the next table with some valuation ratios, represent 18.9% of asset value. Exposure to risks related to any individual company is moderate (3.2% maximum). The fund is better diversified than the Russell 1000, where the top 10 holdings have an aggregate weight of 27.7% and the top name, Apple Inc (AAPL), is at 6.9%.
| Ticker |
| Name |
| Weight |
| P/E TTM |
| P/E fwd |
| P/Sales TTM |
| P/Book |
| P/Net Free CashFlow |
| Yield% |
| Berkshire Hathaway, Inc. |
| 3.23% |
| 98.47 |
| 22.10 |
| 2.36 |
| 1.48 |
| 32.44 |
| 0 |
| Meta Platforms, Inc. |
| 2.59% |
| 36.51 |
| 24.64 |
| 6.51 |
| 6.12 |
| 43.51 |
| 0 |
| Exxon Mobil Corp. |
| 2.35% |
| 7.23 |
| 10.93 |
| 1.12 |
| 2.21 |
| 10.08 |
| 3.40 |
| Johnson & Johnson |
| 2.28% |
| 34.05 |
| 15.28 |
| 4.40 |
| 5.99 |
| 97.07 |
| 2.92 |
| JPMorgan Chase & Co. |
| 2.21% |
| 10.67 |
| 9.98 |
| 2.39 |
| 1.56 |
| 9.61 |
| 2.77 |
| Chevron Corp. |
| 1.63% |
| 8.45 |
| 11.58 |
| 1.28 |
| 1.86 |
| 11.48 |
| 3.86 |
| Pfizer Inc. |
| 1.20% |
| 7.19 |
| 10.93 |
| 2.25 |
| 2.07 |
| 13.80 |
| 4.50 |
| Walmart, Inc. |
| 1.17% |
| 38.10 |
| 25.34 |
| 0.69 |
| 5.90 |
| 31.96 |
| 1.44 |
| Cisco Systems, Inc. |
| 1.14% |
| 18.50 |
| 13.53 |
| 3.86 |
| 5.01 |
| 20.04 |
| 3.03 |
| Bank of America Corp. |
| 1.09% |
| 8.75 |
| 8.59 |
| 1.78 |
| 0.95 |
| 4.76 |
| 3.03 |
Ratios: Portfolio123.
VONV and IWD, which track the same index, have almost identical annualized returns since VONV inception (10.49% and 10.46%, respectively). Hereafter, IWD historical prices will be used to assess the index over a longer period. Since 6/1/2000, IWD is very close to the parent index Russell 1000 in performance and risk metrics.
| since 6/1/ 2000 |
| Total Return |
| Annual.Return |
| Drawdown |
| Sharpe ratio |
| Volatility |
| IWD |
| 362.70% |
| 6.86% |
| -60.10% |
| 0.42 |
| 15.44% |
| IWB |
| 376.36% |
| 6.99% |
| -55.38% |
| 0.41 |
| 15.67% |
Calculations with Portfolio123.
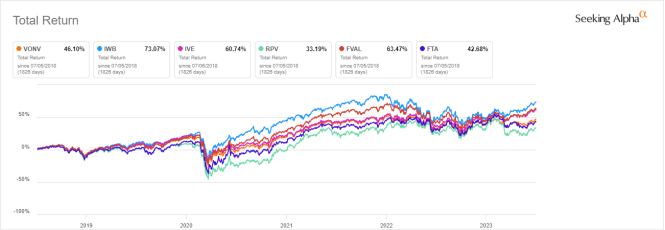
The next chart compares the 5-year total returns of VONV, IWD and a four passively managed large cap value funds tracking various indexes:
- iShares S&P 500 Value ETF ( IVE )
- Invesco S&P 500 Pure Value ETF ( RPV )
- Fidelity Value Factor ETF ( FVAL )
- First Trust Large Cap Value AlphaDEX Fund ( FTA ).
VONV vs benchmark and competitors, last 5 years (Seeking Alpha)
VONV is in the middle of the pack. All value funds in the list have lagged the Russell 1000 in this time frame.
Comparing VONV with my Dashboard List model
The Dashboard List is a list of 80 stocks in the S&P 1500 index, updated every month based on a simple quantitative methodology. All stocks in the Dashboard List are cheaper than their respective industry median in Price/Earnings, Price/Sales and Price/Free Cash Flow. After this filter, the 10 companies with the highest Return on Equity in every sector are kept in the list. Some sectors are grouped together: energy with materials, communication with technology. Real estate is excluded because these valuation metrics don't work well in this sector. I have been updating the Dashboard List every month on Seeking Alpha since December 2015, first in free-access articles, then in Quantitative Risk & Value.
The next table compares the Russell 1000 Value Index since 2000 with the Dashboard List model, with a tweak: the list is reconstituted annually instead of once a month to make it comparable to a passive index.
| since 6/1/ 2000 |
| Total Return |
| Annual.Return |
| Drawdown |
| Sharpe ratio |
| Volatility |
| Russell 1000 Value Index ( IWD ) |
| 362.70% |
| 6.86% |
| -60.10% |
| 0.42 |
| 15.44% |
| Dashboard List (annual) |
| 1016.64% |
| 11.01% |
| -56.78% |
| 0.6 |
| 17.41% |
Past performance is not a guarantee of future returns. Data: Portfolio123.
The Dashboard List outperforms the Russell 1000 Value Index by over 4 percentage points in annualized return. However, ETF performance is real and the list simulation is hypothetical.
A risky concept of value
Mixing various ratios to rank value stocks is a good idea. However, most value indexes doing so have two shortcomings, and the Russell 1000 Value Index is no exception. The first one is to classify all stocks using the same criteria. It means valuation ratios are considered comparable across sectors and industries. Obviously, they are not: my monthly dashboard here shows how valuation and quality metrics may vary across sectors. A few ETFs have a more sophisticated approach, like Fidelity Value Factor ETF ( FVAL ), reviewed here , and some actively managed value funds.
The second weakness comes from the price/book ratio (P/B), which adds some risk in the index. Historical data show that a large group of companies with low P/B has a higher volatility and deeper drawdowns than a same-size group with low price/earnings, price/sales or price/free cash flow. The next table shows the return and risk metrics of the cheapest quarter of the S&P 500 (i.e., 125 stocks) measured in price/book, price/earnings, price/sales and price/free cash flow. The sets are reconstituted annually between 1/1/2000 and 1/1/2023 with elements in equal weight.
| Annual.Return |
| Drawdown |
| Sharpe ratio |
| Volatility |
| Cheapest quarter in P/B |
| 8.54% |
| -81.55% |
| 0.35 |
| 37.06% |
| Cheapest quarter in P/E |
| 10.71% |
| -73.62% |
| 0.48 |
| 25.01% |
| Cheapest quarter in P/S |
| 12.82% |
| -76.16% |
| 0.47 |
| 34.83% |
| Cheapest quarter in P/FCF |
| 15.32% |
| -74.77% |
| 0.61 |
| 27.03% |
Data calculated with Portfolio123.
This explains why I use P/FCF and not P/B in the Dashboard List model.
Takeaway
Vanguard Russell 1000 Value ETF holds over 800 stocks picked and weighted to favor companies with a low price-to-book ratio, low sales growth and low projected earnings growth. The fund is better diversified across sectors and holdings than its parent index. Nonetheless, based on 23 years of data, the underlying index has not produced excess return over the Russell 1000.
Even if it doesn’t look attractive in the long term, Vanguard Russell 1000 Value Index Fund ETF Shares may be useful for swing trading, or in a tactical allocation strategy switching between value and growth styles. I see two reasons why the Russell 1000 Value Index doesn’t outperform the benchmark. First, it ranks stocks regardless of their industries. Second, it relies too much on the price/book ratio, which is a risky factor.
For further details see:
VONV: Attractive Valuation, Average Performance