VUG - VOOG: Decent Growth ETF But This Other Fund Is Still My Favorite
2023-12-29 08:15:06 ET
Summary
- Vanguard's S&P 500 Growth Index Fund ETF (VOOG) is a relatively low-cost option for capturing large-cap growth of the S&P 500 Index.
- VOOG has solid performance with a 10-year CAGR of 13.09%, but lags behind Schwab's U.S. Large-Cap Growth ETF (SCHG) and Vanguard's Growth ETF (VUG).
- Despite VOOG's strengths, SCHG is more favorable with higher returns, a lower expense ratio, and a stronger mix of holdings looking forward.
Investment Thesis
Vanguard’s S&P 500 Growth Index Fund ETF ( VOOG ) warrants a buy rating due to its low-cost ability to capture large-cap growth of the S&P 500 Index. The fund has also proven itself with solid performance at relatively low volatility. However, investors seeking the greatest returns at an even lower expense ratio may be able to achieve their objectives more effectively with Schwab’s U.S. Large-Cap Growth ETF ( SCHG ).
Fund Overview and Compared ETFs
VOOG is an ETF that seeks to track growth companies within the S&P 500 index. With its inception in 2010, the fund has 239 holdings and $8.36B in AUM. VOOG’s largest sectors by weight are information technology (37.40%), healthcare (16.60%), and consumer discretionary (10.40%).
For comparison purposes, other ETFs examined are Vanguard’s Growth ETF ( VUG ), Schwab’s U.S. Large-Cap Growth ETF, and Invesco’s S&P 500 Pure Growth ETF ( RPG ). These other funds have similar objectives to VOOG, with notable differences. VUG strives to track the performance of the CRSP U.S. Large Cap Growth Index . SCHG seeks to track large cap within the Dow Jones U.S. Large-Cap Growth Total Stock Market Index. Invesco’s fund seeks to capture both growth and value of the S&P 500 index.
Performance, Expense Ratio, and Dividend Yield
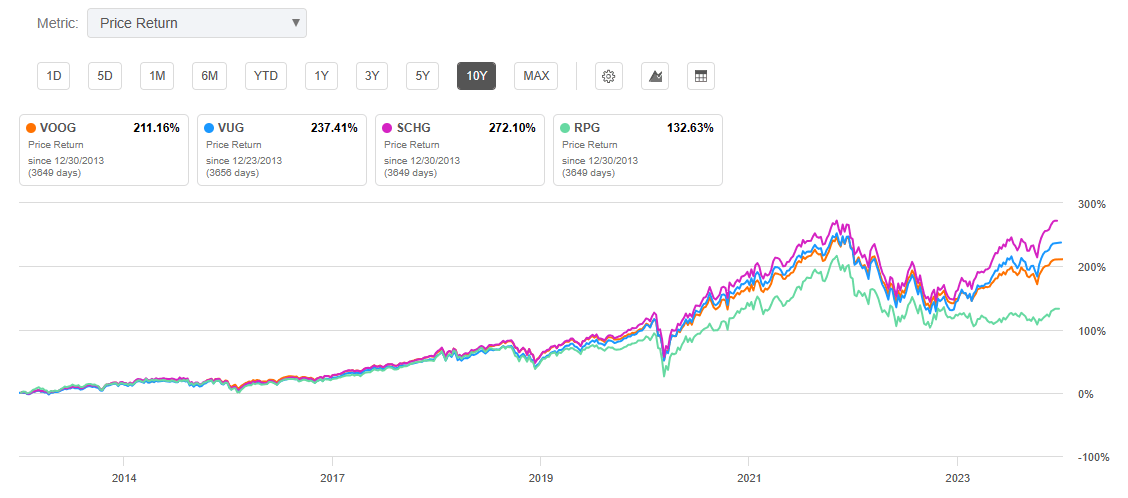
VOOG has seen a 10-year CAGR of 13.09%. As expected with a growth ETF, this performance has surpassed the S&P 500’s 10-year CAGR of approximately 11.7%. However, VOOG’s return has been lower than VUG's 10-year CAGR of 13.88%. VUG has predominantly been able to achieve greater returns with increased weight on the information technology sector (53.40%).
VOOG has also lagged SCHG's 10-year CAGR of 14.68%. This can be mostly attributed to SCHG’s sector mix of 43.89% on information technology and 13.36% on healthcare. Finally, RPG has the lowest performance of ETFs compared, with a 9.60% 10-year CAGR. RPG is also heavy on IT at 35.89% and consumer discretionary at 28.73%.
All funds examined have relatively low expense ratios. Investors considering VOOG should be pleased with a mere 0.10% expense ratio. However, this is still higher than both VUG (0.04%) and SCHG (0.04%). In addition to being a lower performer with regards to price return, RPG once again disappoints with a 0.35% expense ratio.
10 Year Total Price Return for VOOG and Compared ETFs (Seeking Alpha)
Any investor familiar with growth ETFs should not be surprised that all ETFs examined had dividend yields lower than the S&P 500 index. Companies included as holdings within growth ETFs typically reinvest their earnings back into the company’s growth, versus paying out a dividend. However, VOOG still provides a modest 1.12% dividend yield and has seen a 10.94% 5-year dividend CAGR.
Expense Ratio, AUM, and Dividend Yield Comparison
| VOOG |
| VUG |
| SCHG |
| RPG |
| Expense Ratio |
| 0.10% |
| 0.04% |
| 0.04% |
| 0.35% |
| AUM |
| $8.36B |
| $191.52B |
| $22.8B |
| $1.77B |
| Dividend Yield TTM |
| 1.12% |
| 0.58% |
| 0.43% |
| 1.43% |
| Dividend Growth 5 YR CAGR |
| 10.94% |
| 0.32% |
| 0.70% |
| 37.52% |
Source: Seeking Alpha, 28 Dec 23
VOOG Holdings and SCHG’s Competitive Advantage
Because of the nature of the different objectives for each fund, the mix of holdings has important differences. Both VUG and SCHG have a heavier weight on the information technology sector and therefore have more weight on the “magnificent seven” that have performed exceptionally well in 2023. Additionally, VOOG has greater weight on healthcare, as seen with its holdings of UnitedHealth Group Inc. ( UNH ) and Eli Lilly and Company ( LLY ).
Top 10 Holdings for VOOG and Compared Growth ETFs (Several Key Differences Bolded)
| VOOG – 239 holdings |
| VUG – 221 holdings |
| SCHG – 251 holdings |
| RPG – 60 holdings |
| AAPL – 13.34% |
| AAPL – 12.96% |
| AAPL – 12.54% |
| RCL – 2.91% |
| MSFT – 7.80% |
| MSFT – 12.93% |
| MSFT – 12.35% |
| BKNG – 2.66% |
| NVDA – 5.52% |
| AMZN – 6.23% |
| AMZN – 6.19% |
| MPWR – 2.63% |
| GOOGL – 3.76% |
| NVDA – 5.04% |
| NVDA – 5.42% |
| ANET – 2.61% |
| GOOG – 3.32% |
| GOOGL – 3.61% |
| GOOGL – 3.68% |
| UBER – 2.58% |
| TSLA – 3.17% |
| META – 3.34% |
| META – 3.54% |
| NVDA – 2.54% |
| AMZN – 2.91% |
| GOOG – 3.03% |
| TSLA – 3.22% |
| BLDR – 2.47% |
| UNH – 2.45% |
| TSLA – 2.97% |
| GOOG – 3.12% |
| CE – 2.40% |
| LLY – 2.25% |
| LLY – 2.32% |
| AVGO – 2.20% |
| PHM – 2.30% |
| XOM – 1.99% |
| V – 1.83% |
| UNH – 2.15% |
| AMD – 2.29% |
Source: Multiple, compiled by author on 28 Dec 23
The future performance of all ETFs examined, including VOOG, is ultimately tied to the individual returns of its holdings. A competitor ETF will likely outperform due to having greater weight on a superior holding or lower weight on an inferior holding. Therefore, I will dive into the key differences below including Microsoft ( MSFT ), Meta Platforms ( META ), and Broadcom ( AVGO ).
VOOG’s Lower Weight on Microsoft
The first key difference in examined ETFs is VOOG’s notably lower weight on Microsoft. Any investor betting against the long-term growth of Microsoft is likely to be disappointed. While VOOG includes MSFT as a top 10 holding, it is only at 7.8% weight versus 12.35% with SCHG. Despite MSFT’s massive 56% return YTD, the company is primed for additional growth in coming years. Microsoft will likely continue seeing strong revenue growth into 2024 thanks to multiple AI-powered projects. One example is the company’s 365 Co-pilot, which is estimated to generate $7.3 billion of incremental annual recurring revenue.
SCHG’s Heavier Weight on Meta Platforms
The second key difference is SCHG’s inclusion of META in its top 10 holdings. With 3.54% weight, SCHG is likely to benefit more than VOOG. The company has demonstrated very strong profitability metrics recently, including an 80% gross profit margin over the past year and a 23.4% net income margin. Meta’s monetization of the WhatsApp business application is also expected to provide substantial cash flow. With three billion monthly WhatsApp users, monetization of the platform is expected to be a considerable boost for the company.
SCHG’s Inclusion of AVGO in Top 10 Weight
The third difference is SCHG’s 2.20% weight on Broadcom. AVGO’s inclusion in the top 10 holdings will likely do well for Schwab’s growth ETF. Broadcom has seen strong fundamental growth and profitability metrics including a forward revenue growth of 18.2%, a 39% net income margin over the past 12 months, and a 60% return on common equity. Furthermore, Broadcom’s acquisition of VMWare is expected to fuel $12 billion in revenue in fiscal year 2024.
Valuation and Risks to Investors
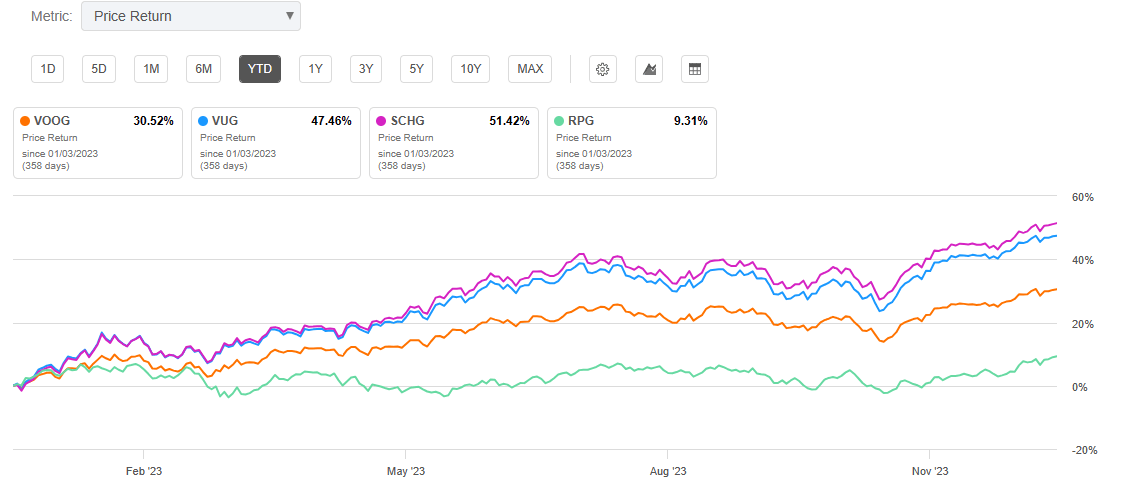
VOOG is currently trading at $272.24 at the time of writing this article. This price puts the ETF near the upper limit of its 52-week range ($272.74), but notably below its all-time high of $302.96 seen back in November 2021. Consistent with its 10-year CAGR, the fund has outperformed the S&P 500 index YTD at 30.5%. Compared to peers, this still underperforms VUG and SCHG. As seen historically, RPG lags all examined ETFs.
Year-to-Date Price Return for VOOG and Peer ETFs Examined (Seeking Alpha)
VOOG displays multiple valuation metrics more attractive than VUG or SCHG, including a P/E ratio of 26.8 and P/B ratio of 7.0. However, the fund’s valuation metrics are not enough for me to rank the ETF higher than SCHG. Despite a higher valuation, SCHG’s current holdings mix indicate that it will continue to perform at least consistent with its historic track record.
Valuation Metrics for VOOG and Peer Competitors
| VOOG |
| VUG |
| SCHG |
| RPG |
| P/E ratio |
| 26.8 |
| 35.4 |
| 32.57 |
| 14.44 |
| P/B ratio |
| 7.0 |
| 9.1 |
| 7.88 |
| 3.60 |
Source: Compiled by Author from Multiple Sources, 28 Dec 23
Despite VOOG’s diversification of over 200 holdings, the fund is not without risks. VOOG has a beta value of 1.09 compared to Dow Jones U.S. Total Stock Market Index. This indicates slightly lower volatility than both VUG and SCHG. VUG has a beta value of 1.18 compared to the Dow Jones U.S. Total Stock Market Index. SCHG has a 5-year beta of 1.10 compared to the S&P 500. While the market overall has seen impressive returns in 2023, a significant downturn will likely be difficult for VUG and SCHG investors. Therefore, the one upside to VOOG’s lower performance may be softer declines in the event of a downturn. However, I conclude that SCHG has only demonstrated slightly greater volatility in exchange for significantly higher returns than VOOG.
Concluding Summary
Vanguard’s VOOG is a solid choice in the category of growth ETFs and warrants a buy rating for long-term investors. The fund ultimately achieves its objectives and outperforms the S&P 500 index by focusing on large-cap growth. VOOG has an attractive expense ratio and valuation metrics, including P/E and P/B ratios, in comparison to peers. Despite these strengths, SCHG is still more favorable in my opinion for those seeking the best growth ETF. While the fund has a lower dividend yield, its performance has been significantly superior to VOOG. SCHG also has a lower expense ratio and stronger mix of holdings, posturing it for continued long-term performance.
For further details see:
VOOG: Decent Growth ETF, But This Other Fund Is Still My Favorite