VTV - VOOV: Big Tech Bubbles To The Top Of Vanguard's Value ETF
2023-12-07 18:59:24 ET
Summary
- As of today, the top three holdings in the Vanguard S&P500 Value ETF are arguably growth stocks: Microsoft, Facebook, and Amazon.
- That compares to year-ago top holdings that included Berkshire Hathaway, Exxon, and Johnson & Johnson.
- Which begs the question: has the VOOV S&P500 Value ETF lost its way?
- The answer is "no". There is a simple explanation for why the fund's top holdings are currently more "growth" oriented.
- Meantime, the VOOV ETF continues to perform well for a "value" oriented fund.
Given the strong performance of the S&P500 and Nasdaq-100 indexes this year (+15.4% and 45.6%, respectively), many investors may be approaching the New Year with caution and searching for "value". Arguably the same could be said about investment sentiment last November, when I wrote a previous Seeking Alpha article about the Vanguard S&P500 Value ETF ( VOOV ). Back then, VOOV's top holdings were Berkshire Hathaway ( BRK.A )( BRK.B ), Exxon ( XOM ), and Johnson & Johnson ( JNJ ). What a difference a year makes. Today, the top holdings in the VOOV ETF are Microsoft ( MSFT ), Meta ( META ), and Amazon ( AMZN ). Are these really "value" stocks, or has Vanguard lost its way? Today I'll take a closer look at the VOOV ETF to see if it may present a good opportunity in "value" for your portfolio.
Investment Thesis
As my followers know, I advise investors to construct a well-diversified portfolio - centered on a foundation of the S&P500 - and to hold it throughout the market's up-n-down cycles. This is a proven way to get exposure to the total returns the market is more than willing to give you and to avoid the mistakes that many ordinary investors make - like trying to time the market, over-emphasizing dividend income, and thinking that they somehow "know better" than the S&P500. That said, such a diversified portfolio certainly has room for a "value" oriented ETF that can potentially provide some buoyancy in times of downside market volatility. Today, I'll review the Vanguard S&P500 Value ETF and determine if it might be a good candidate for inclusion in your portfolio.
ETF Basics
Some of the common metrics of the VOOV ETF that most investors care about are shown below and were taken directly from the Vanguard VOOV ETF homepage , where you can find additional information about the fund:
- Fund Objective: To track the value companies of the S&P500 Index as identified by three factors: book/price ratio, earnings/price ratio, and sales/price ratio.
- Expense Fee: 0.10%
- YTD Returns: 15.6%
- Average Annual Return Since Inception (9/7/2010): 11.63%
- Number of Stocks: 400
- Total Net Assets: $3.6 billion
- 30-day SEC Yield: 1.81%
Top-10 Holdings
The top-10 holdings in the VOOV ETF (as of 10/31/2023) are shown below and equate to what I consider to be a moderately diversified 27.6% of the entire 400 company portfolio:
Vanguard
As mentioned earlier, many investors may be surprised to see that the #1 holding with a 6.6% weight is Microsoft ( MSFT ). Microsoft is probably not the first company that comes to mind when most investors think of a "value" stock. Indeed, MSFT trades with a TTM P/E=35.7x as compared with the S&P500 P/E=25.1x .
What is of "value" with Microsoft is its software licensing business, Azure cloud (revenue +29% yoy in Q1 FY24 ), its partnership with OpenAI and subsequent integration and monetization of ChatGPT into products like CoPilot, and the fact that Microsoft ended last quarter with $144 billion in cash (an estimated $19.30/share based on a fully-diluted outstanding share count of 7.462 billion). MSFT pays a $3.00/share annual dividend, yet due to its stock-price appreciation yields only 0.81%.
Facebook is the #2 holding 4.2% weight. Like Microsoft, Facebook is arguably another "growth" stock: META has a TTM P/E=28.0x - which is, once again, significantly higher than the overall S&P500 average.
The #3 holding is Amazon, with a 4.1% weight. In my opinion, Amazon is definitely a "growth" stock and sports a TTM P/E=75.7x . Like Facebook, AMZN pays no dividend.
Even on a price-to-sales basis (one of the core metrics the index the VOOV ETF tracks uses), these top three holdings are arguably squarely in the "growth" camp:
| MSFT |
| META |
| AMZN |
| S&P500 |
| TTM Revenue |
| $218.3 billion |
| $127.0 billion |
| $554.0 billion |
| Market-cap |
| $2.74 trillion |
| $815.8 billion |
| $1.49 trillion |
| Price-to-Sales |
| 12.6x |
| 6.4x |
| 2.7x |
| 2.5x |
Holdings #4 through #7 are much more of what most investors are likely to consider "value" stocks and would expect to be found in a "value" oriented ETF: Berkshire Hathaway, JPMorgan Chase ( JPM ), Walmart ( WMT ), and Cisco Systems ( CSCO ).
But then holdings #8 and #9 pivot back to what would be considered growth stocks: Salesforce ( CRM ) and Netflix ( NFLX ), neither of which pays a dividend and are trading at TTM P/E ratios of 94.4x and 44.6x, respectively.
Portfolio Composition
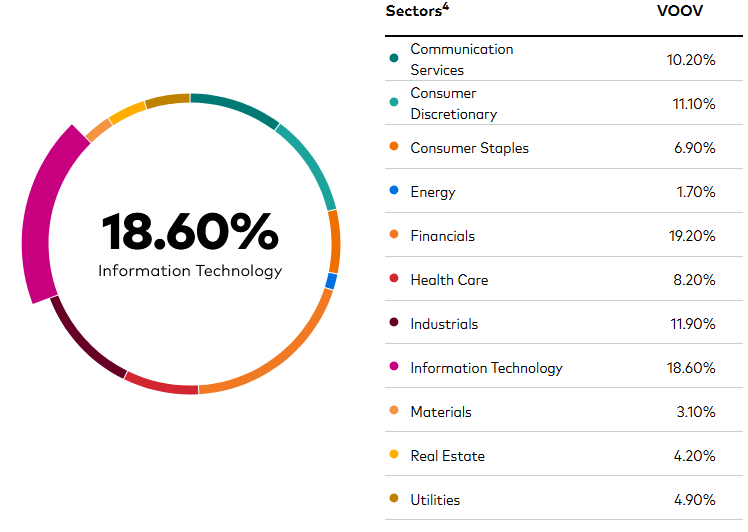
On an overall basis, and not surprising given the top-10 holdings, the VOOV ETF's 2nd largest sector exposure (after Financials) is the IT Sector, with an additional 10.2% allocated to the Communication Services Sector:
Vanguard
Once again, this is not what most investors would expect to see in a "value" oriented ETF.
What Is Going On?
Obviously, these top-3 holdings in the VOOV ETF have displayed excellent YTD performance and have significantly outperformed both the S&P500 and Nasdaq-100 indexes as represented by the ( VOO ) and ( QQQ ) ETFs, repsectively.
The strong out-performance of these stocks versus the broad S&P500 is the reason that, at least as of today, the VOOV ETF's top-10 holdings look much more like a "growth" oriented fund as compared to a "value" fund.
Indeed, ETF.com reports that the index that the VOOV ETF tracks is market cap-weighted and undergoes an annual re-balance on the third Friday of December. That being the case, these out-performing stocks have left the more "value" oriented peers in their dust, and have simply bubbled-up to the top during 2023.
Performance
The graphic below shows the long-term performance track record of the VOOV ETF, including an relatively impressive life-of-fund average annual return of 11.6%:
Vanguard
The chart below compares to 3-year total returns of the VOOV ETF as compared to some notable peers: its sister fund, the Vanguard Value ETF ( VTV ), the iShares S&P500 Value ETF ( IVE ), and the iShares Russell 1000 Value ETF ( IWD ):
As you can see from the graphic, the VOOV ETF has out-performed all of the funds in the chosen "value" group, with only the iShares S&P500 Value fund coming close in comparable returns.
Risks
While the VOOV ETF arguably currently has an over-weight exposure to growth companies, the overall portfolio is still a "value" as compared to the S&P500:
| P/E |
| Price/Book |
| Yield |
| VOOV |
| 17.8x |
| 2.4x |
| 1.81% |
| S&P500 |
| 25.1x |
| 4.3x |
| 1.52% |
As can be seen, the VOOV ETF trades at a significant P/E and P/B discount as compared to the S&P500 while the yield is more than 30 basis points higher. That being the case, and all things being equal (but acknowledging that they seldom are ...), the VOOV ETF should be less volatile to the downside should there be a severe market correction.
I should also comment that one could argue there isn't all that much differentiation in the VOOV ETF from the S&P500 considering it holds 400 of the 500 companies making up that index. And, I should add, it does so while charging a 7 basis point higher expense fee (0.10% versus 0.03% for VOO). Over a period of years, that actually matters (see the graphic at the end of this article).
Summary & Conclusions
In my own personal portfolio, I originally allocated some capital to the VOOV ETF because I wanted diversified exposure to "value" and, in particular at the time, to Berkshire Hathaway - which was the #1 holding. Today, I would argue that the composition of the VOOV ETF has significantly changed due to the out-performance of a hand-full of stocks that have bubbled up to become the top-weighted holdings in the portfolio. However, having exposure to these growth stocks worked out well for investors this year and while it's not quite a "Dogs-of-the-Dow" scenario, an end of year re-balance sets the fund up nicely for the upcoming year.
So while I generally like the VOOV ETF, I currently rate it a HOLD and advise investors to wait until after the fund re-balances (and I assume - reconstitutes its holdings) before initiating a position or adding to an existing position. This year, that will happen on December 15th. Investors should check in following that date as it will be interesting to view the top-10 holdings. That said, Vanguard's website usually has a significant delay (of a month or more) before it lists many of its ETFs current holdings.
I'll end with a 10-year total returns comparison of the VOOV ETF versus the broad market indexes, including the DJIA ETF ( DIA ):
Note that the VOOV ETF has under-performed the S&P500 (as represented by the VOO ETF) by 50%+ over the past decade. Once again, this points out the wisdom of building a portfolio on a foundation of the S&P500 (i.e. the largest allocation) while also having exposure to growth assets like the triple-Q's, which has clearly been the star of the show.
For further details see:
VOOV: Big Tech Bubbles To The Top Of Vanguard's Value ETF