CBRE - Vornado Vs. Kilroy Realty: I'm Upbeat On Both Of These High-Quality Office REITs - But Only Bought One
2023-08-04 15:50:24 ET
Summary
- While Office REITs have long been out of favor, it is only post-pandemic that the ones with top-notch quality and location are also attractively priced.
- Vornado and Kilroy Realty are owners of extremely high quality Class A office buildings, which have a future in coexistence with hybrid work schedules.
- At today’s valuation, investors are paying 6x FFO for VNO and 7x FFO for KRC—it pays to have a contrarian bet.
As interest rates mercilessly rose in 2022, investors began to sell off office REITs, whose stocks had made partial recoveries in 2021 after crashing at the onset of the pandemic. Even the commercial real estate (( CRE) ) brokers JLL ( JLL ) and CBRE ( CBRE ), who are seen as a “picks and shovels” bet, weren’t spared. Rising interest rates are a negative double whammy for REITs: not only do income-focused investors begin rotating out of REITs in favor of fixed-income, but it makes rolling and issuing debt expensive (REITs often tap into the debt markets to fund new developments because there is little cash left after paying out the obligatory 90% of net income out as dividends). Sprinkle on the fact that many corporations have been soft on their return-to-office campaigns and how employees are now accustomed to hybrid/flexible working, you can see why the stocks of office landlords are currently out of favor.
I believe market pundits have "thrown the baby out with the bathwater" when commenting on office REITs. They have missed the nuances about how quality and location matter: there is a clear distinction between Class A and non-Class A office buildings, and offices in central business districts (( CBD) ) of major cities clearly have a distinctly different value proposition than offices elsewhere. There is a clear pecking order: the pain from vacancies and delinquencies will be borne by owners of lower-quality buildings first.
As a result, I am only interested in the REITs whose portfolio is the creme de la creme, even though many office-focused REITs are trading cheaply, e.g., see SL Green ( SLG ), Boston Properties ( BXP ), Empire State Realty ( ESRT ), Cousins Properties ( CUZ ), Highwoods Properties ( HIW ), and Douglas Emmett (DEI), to name a few. Under this criteria, I have the most conviction in Vornado ( VNO ) (which is heavily concentrated in Manhattan) and Kilroy (KRC) (which is heavily concentrated on the US West Coast). Let me be clear: investing in office REITs at this moment carries an abnormal amount of risk and investors need to be comfortable stomaching volatility. It is a bumpy ride to go against the market’s prevailing negative sentiment but I believe the quality of Vornado and Kilroy’s portfolios, combined with their current undemanding valuations, fairly compensate investors who are willing to go against the fray.
In this article, I am not aiming to provide a primer on office REITs or an overview of Vornado and Kilroy’s business strategies. Instead, I will highlight several key metrics that analyze the health of the business (occupancy rates, dividend coverage, Debt to EBITDA) and their respective valuations (Price to FFO ratio, Cap rates). These metrics demonstrate that 1) the fundamentals of high-quality commercial real estate are sound, and 2) Kilroy’s lower debt makes it the more attractive choice between the two.
Reports of CRE’s death have been greatly exaggerated
The post-pandemic earnings for all office REITs have been disappointing, Vornado and Kilroy included. While rental income growth for the pair has grown low-single digits, those figures are negative in real terms because inflation has been in the high-single digits. In addition, net absorption rates continue to be negative in New York City (Q1 2023) and San Francisco (H1 2023). Lastly, skeptics point to how flexible working arrangements enabled by communication tools like Zoom, Teams, and Slack are able to digitally replicate (and, in some cases, enhance) the dynamics of in-person work. They say, as a result, will be will a significant reduction in the demand for office space because the future of work will be hybrid (e.g., 2-3 days in the office, other days WFH).
While these are all salient points, we need to make a distinction between the Class A office buildings in prime locations and their competition. Demand for office buildings in “Tier 1” cities like New York City, Los Angeles, and San Franciso remains unbroken so long as the flywheel of talent remains intact.
On one side of the coin, white collar workers (both with and without jobs lined up) are willing to relocate to Tier 1 cities; on the other side of the coin, companies put their headquarters in Tier 1 cities to remain competitive in the race for talent. The interconnectedness of Tier 1 cities is especially alluring for roles that are heavily relationship-based—like ones in consulting, finance, and media/entertainment. Company executives are highly aware that their employees’ time is worth hundreds of dollars per hour: they want them to be in as close proximity to customers and coworkers as possible.
I have high confidence when I say Class A office space will be a going concern in, let’s say, 50 years. By the same stroke, I can’t say the same for the fossil fuel segments of exploration & production companies or the legacy tobacco business of Altria ( MO ) or British American Tobacco (BTI).
The lasting appeal in quality office space bears itself out in the numbers: both Vornado and Kilroy report occupancy rates in their office portfolios of 90%, a decline from pre-pandemic, but surely higher than what detractors might’ve guessed.
Lastly, I would like to address the point that “desk hoteling” can reduce the amount of required office space (e.g., if workers come in only 2 or 3 days per week, then office space can be cut by 50% or so). My counterargument is that the distribution of in-person work days is uneven: many workers prefer to have Fridays and Mondays as their WFH days, and some teams want all of their employees in the office on a particular day. Like the phrase “your team is only as fast as your slowest member”, desk hoteling can reduce space to the extent the office can still accommodate peak work in-person days.
Digging into Vornado and Kilroy
Besides the fact that both of these companies own very high-quality properties in metropolises, it also happens these two businesses are quite comparable. Vornado’s market cap is $3.90 billion, Kilroy’s is $3.95 billion. Both companies’ portfolios are 3/4 office, and 1/4 other (Vornado’s 1/4 is retail, while Kilroy’s 1/4 is residential and life science). And, as we’ll see later, the implied cap rates on both companies’ portfolios are between 9-10%.
Another aspect of real estate in Tier 1 cities is there is a natural constraint on supply as a result of geography and regulation. In some jurisdictions (Manhattan and San Francisco, for example) the amount of land is fixed because of geography. Even in cities that can “expand,” though, zoning laws pose an obstacle to conversions or new development. (As an aside, this interactive map shows the amount that “Apartment buildings are illegal to build in 76% of San Francisco.” You can imagine limits on office and other commercial real estate are even more strict.)
Vornado and Kilroy have expertise navigating within these infuriating and non-standard zoning rules, and have established relationships with city officials to boot. And, of course, they also own many buildings that would violate current zoning provisions, but are grandfathered in because they were constructed decades ago. To be clear, both companies still compete in a commoditized industry. Because the vast majority of leases are brokered through JLL and CBRE, office REITs have little pricing power or influence over the lease terms. But as zoning regulations become tighter, pre-existing buildings become more valuable so long as the city remains healthy.
Lastly, both companies have been long led by respected management teams with long-term mentalities. At Vornado, 81-year-old Steven Roth is one of the best-known people in CRE and served as CEO from 1989 to 2009, and from 2013 to now. At Kilroy, John Kilroy has been CEO since 1991 (and served as the president of Kilroy Industries, Kilroy’s entity before it went public, from 1981 to 1991), though plans to retire at the end of 2023.
Vornado Realty
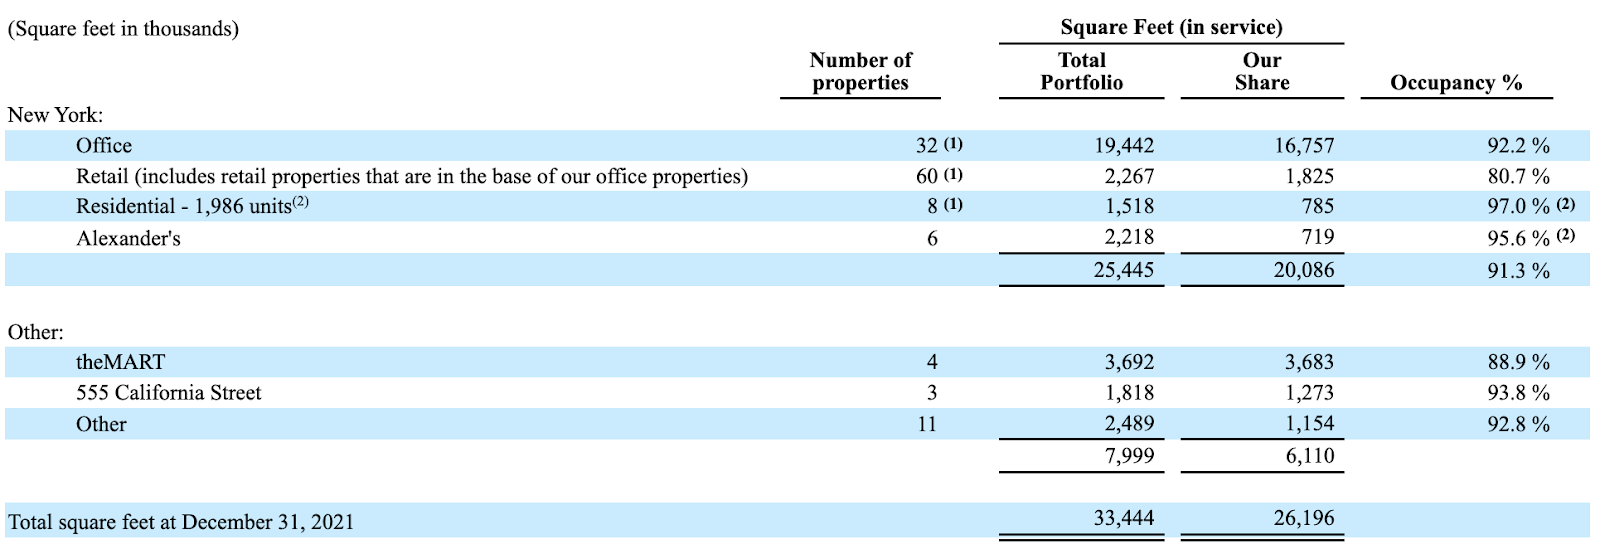
Vornado Realty owns and operates dozens of highly coveted buildings and land sites in primarily Manhattan (note, a handful of buildings/sites are joint ventures). These include Pennsylvania Station (the busiest transportation hub in North America), signage throughout Times Square and The PENN District, and the Merchandise Mart in Chicago. In addition, Vornado has a 32.4% interest in publicly traded Alexander’s, Inc. (NYSE: ALX), which in turn, owns six properties in the New York metropolitan area, including the Bloomberg L.P. headquarters building. By space, Vornado’s portfolio is 77% office and 86% located in New York. The quarter of Vornado’s non-office space consists mainly of high-end retail.
2022 Form 10-K (Annual Report) 2022 Company Report
Occupancy
Keep in mind that the New York office column has the heaviest significance. As of the end of FY2022, the occupancy of Vornado’s entire portfolio sat in the high 80%, though the overall trend has been a gradual decline after peaking in 2018. However, 90%+ occupancy in the New York office column is still better than its non-Class A peers in NYC.
As it stands, Vornado’s portfolio shows particular weakness in New York retail and the Merchandise Mart in Chicago.
Pre-pandemic, New York retail had occupancy in the mid-to-high 90%, but has tapered off to below 80% occupancy since. This is disappointing, given it is prime real estate in New York City (America’s largest city by population) but is a sign that management is not willing to sign long leases at what it deems to be unfavorable rates. Unoccupied space also provides renovations, so the opportunity cost is less than it appears to be on paper.
The Merchandise Mart (“The MART” in the table) is the largest privately-held commercial building in the United States at 3.7 million square feet, and even had its own ZIP code until 2008. The building was fully occupied around 2016, but vacancy rates have pushed upwards of 20% because of the pandemic, along with a $40 million redevelopment in 2018 and a $60 one started in 2022.
| VNO |
| [units in thousands, except ratios and per share metrics] |
| Year Ended December 31, |
| 2021 |
| 2022 |
| Weighted average shares/units |
| 192,148 |
| 193,570 |
| NOI |
| 1,034,686 |
| 1,151,068 |
| per share |
| $8.69 |
| $9.67 |
| Net Income Available to Common Stockholders |
| $101,086 |
| -$408,615 |
| per share |
| $0.53 |
| -$2.13 |
| Funds From Operations (FFO) |
| $571,074 |
| $638,928 |
| per share |
| $2.97 |
| $3.30 |
| Adjusted Funds from Operations (AFFO) |
| $549,900 |
| $608,900 |
| per share |
| $2.86 |
| $3.15 |
| Dividend per share |
| $2.12 |
| $2.12 |
| Dividend payout as % of FFO |
| 71% |
| 64% |
| Dividend payout as % of AFFO |
| 74% |
| 67% |
| Forward Looking Metrics: |
| Current Stock Price |
| $20 |
| Estimated FY 2023 Dividend |
| $1.50 |
| Estimated Dividend Yield |
| 7.4% |
| Market Cap |
| $3,897,095 |
| Total Debt |
| $10,468,000 |
| Cash, restricted cash, and U.S. Treasury bills |
| $1,598,000 |
| Enterprise Value |
| $12,767,095 |
| Price to 2022 FFO |
| 6.2 |
| Price to 2022 AFFO |
| 6.5 |
| Implied Cap Rate (NOI/EV) |
| 9.02% |
| 2022 EBITDA |
| $1,091,000 |
| Debt to EBITDA |
| 9.6 |
Valuation
Vornado is trading at a 6x multiple to 2022 FFO and 6.5x multiple to 2022 AFFO. Given FFO is expected to rise in FY2023, those metrics look even better on a forward basis. The implied capitalization rate of 9% paints a similar story. Note that neither the Price to FFO ratio nor the implied cap rate factor in projects currently in development. Both Vornado and Kilroy are active developers (which is surprisingly not the case with some other REITs) and Wall Street doesn’t credit in-progress buildings until they stabilize and begin contributing to NOI. Vornado, specifically, has 1.65 million square feet of space currently in development; upon completion, 1.65 million square feet would represent an additional 5%.
Dividends
I estimate Vornado’s forward dividend payments will be $1.50 per year (a 7.4% yield). For context, Vornado’s dividend used to be higher. When it reported sluggish 4Q22 results, it came with the news the quarterly dividend would be cut by 29% to $0.375 per share from $0.53 per share. Management also said there would be more dividend payments until the end of 2023, but it was unclear whether the Q4 dividend payment would include dividends missed in Q2 and Q3.
Before this most recent dividend cut, the company had a sporadic history of dividend increases and cuts, including an ill-timed special dividend in 2019. I believe the dividend was cut to exactly $0.375 on purpose, as the company intends to pay out an annual dividend of $1.50 ($0.375*4), which is a sustainable level as it represents around 65% of 2022 FFO.
Debt
The largest risk for investors in Vornado is its heavy debt load of $10.5 billion (which puts Vornado at a Debt to EBITDA of 9.6). Vornado’s debt has a couple of silver linings, though. Vornado’s debt maturities are well distributed and the overall interest rates paid on it are relatively low. From the 2022 annual report :
-
fixed-rate debt accounted for 73% of debt with a weighted average interest rate of 3.6% and a weighted average term of 4.4 years
-
floating-rate debt accounted for 27% of debt with a weighted average interest rate of 5.9% and a weighted average term of 2.8 years.
Also, 70% of its debt is on the project-level and non-recourse. In other words, in the event of a default, a lender may only pursue the stated collateral (typically the underlying building whose loan is in question) and nothing more. Defaulting on non-recourse debt is often a nothing-burger, as was the case when Vornado defaulted on a $450 million loan tied to the Fifth Avenue retail properties joint venture. Speaking about the JV’s default, President and Chief Financial Officer Michael Franco said “that’s the benefit of non-recourse debt—if you can’t reach an agreement, you can walk away.”
Recent Deals
Before I close, I would like to point out two recent deals that signal a strong vote of confidence for Manhattan real estate. There was the news that SL Green Realty ( SLG ) sold a 49.9% percent stake in 245 Park Avenue to Japanese firm Mori Trust that prices the building at $2 billion, a valuation in-line with pre-pandemic valuations. Even though 245 Park Avenue is a SLG property (frankly, one of their highest quality ones), the news sent the stock of Vornado soaring as well, since Vornado’s properties are close comparisons to 245 Park Avenue.
There was also an announced JV between Vornado and Rudin Management to master-lease 350 Park Avenue to Ken Griffin’s Citadel . (Citadel will effectively become the new landlord as a result of the master-lease, because in-place tenants will begin paying rent directly to Citadel.) Under the terms of the deal (which doesn’t have a free rent period unlike other recent CRE deals), Citadel will pay initial annual net rent of $36 million and has the option to either purchase the building outright or invest in the Vornado/Rudin JV starting in 2024.
Kilroy Realty
Kilroy Realty develops and manages office, life science, and mixed-use properties in primarily West Coast cities. Between the San Francisco Bay Area, Greater Los Angeles, Greater San Diego, Pacific Northwest (namely Seattle), and Austin, Kilroy owns approximately 16.2 million square feet of office space . By space, 75% of Kilroy’s portfolio is office (just like Vornado) and the remaining 25% is split between residential and life sciences.
Since the GFC in 2008, the company has diversified away from being just an office owner in San Diego and Los Angeles. In the past 15 years, Kilroy branched off to San Francisco, Seattle, and Austin. It also ventured into the business of owning/operating life science buildings, which now makes up 22% of the company’s NOI and accounts for 55% of the current development pipeline.
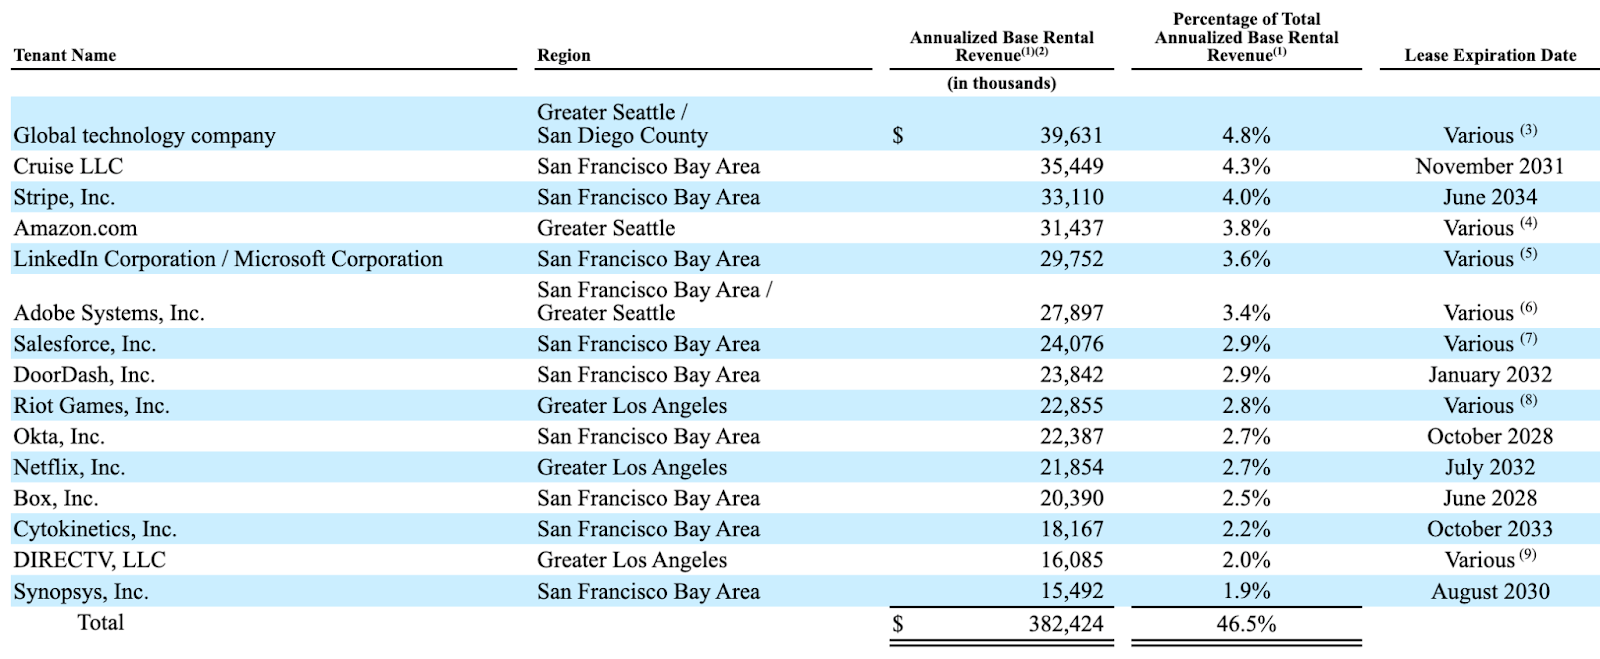
While Kilroy is more geographically diversified than Vornado, its tenant base is more concentrated. Its top 15 tenants make up nearly 50% of rental revenues and have a heavy skew towards “new age” tech, fintech, and biotech companies.
?
2022 Form 10-K (Annual Report) Investor Relations Presentation
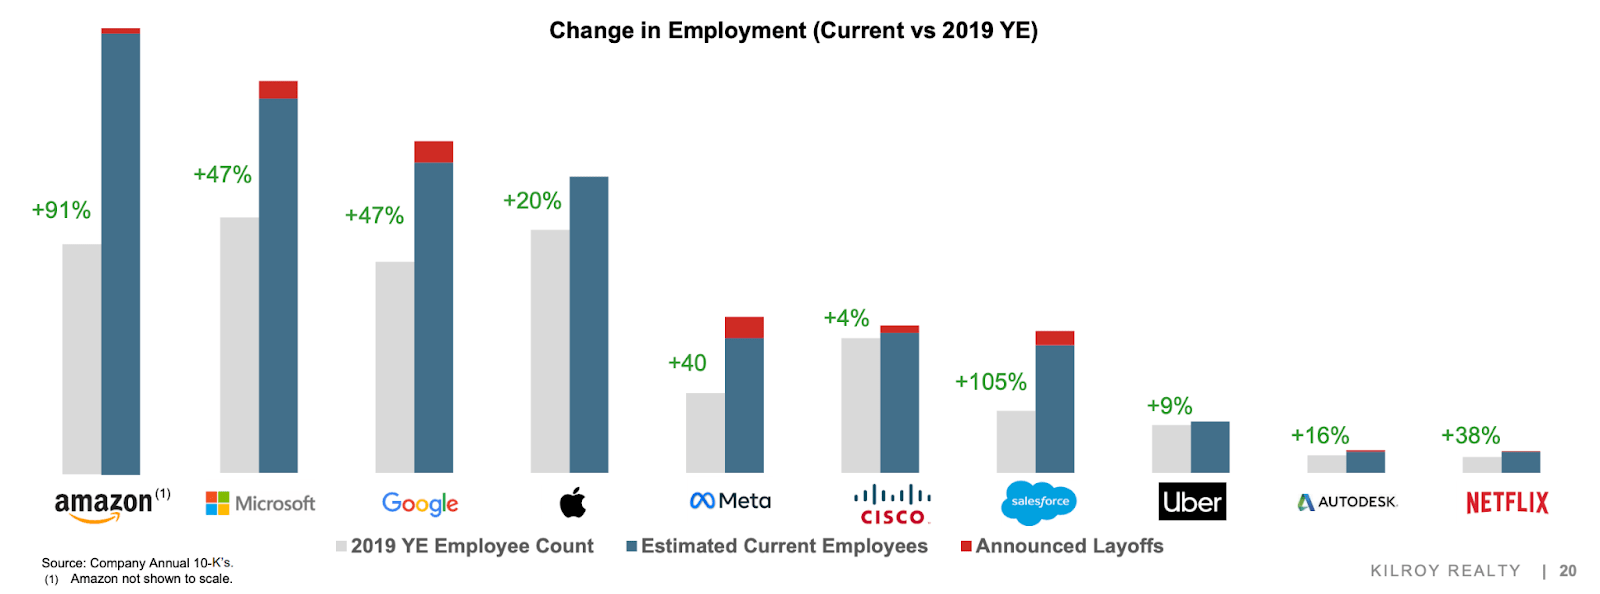
These growthy tenants were able to massively expand their reach in the era of cheap money, but rising interest rates and general economic angst have caused many to reassess the size of their workforce. While tech layoff headlines cite reductions in the thousands, the reality is headcount at these companies is higher than they were pre-pandemic. With a couple of exceptions, these companies overhired based on rosy assumptions and layoffs are an unfortunate byproduct of rightsizing the workforce.
??
2022 Form 10-K (Annual Report)
?
Occupancy
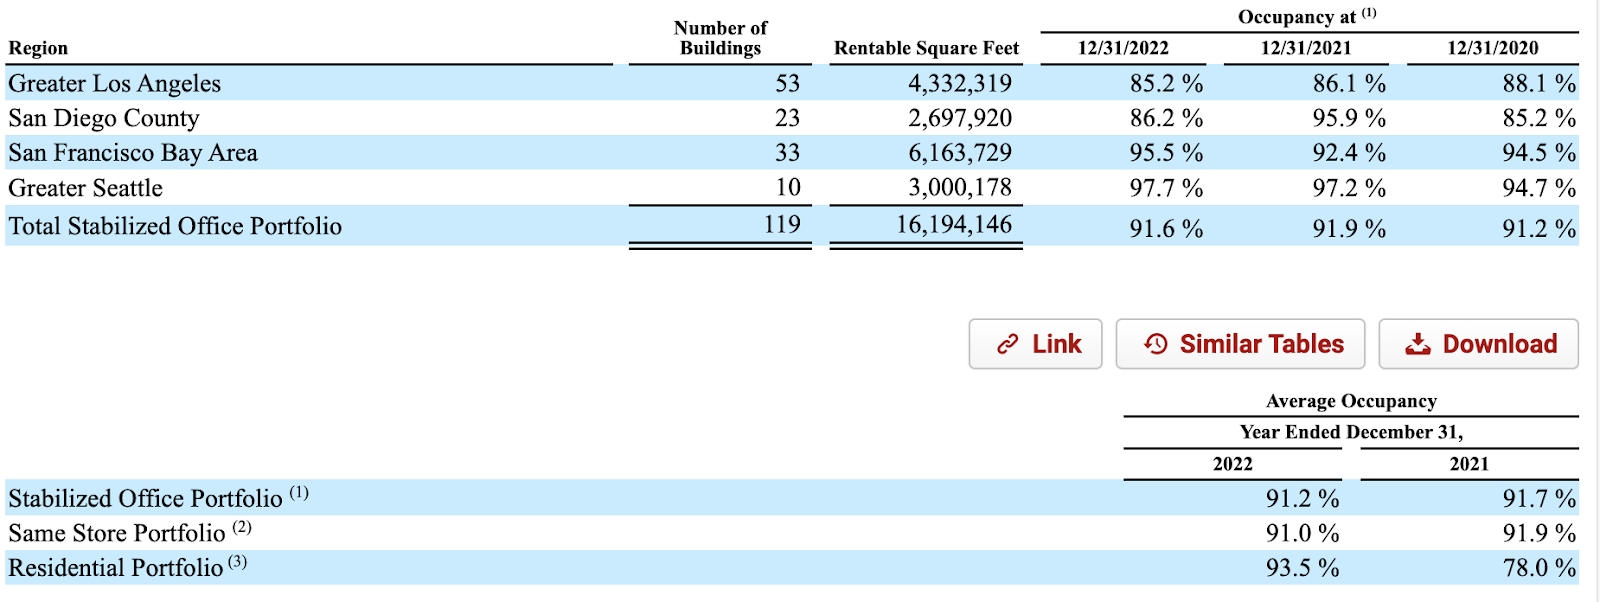
Kilroy’s overall office portfolio sits at 91% occupancy, with all four of its major regions above 85% in the previous 3 years. At the close of 2022, Los Angeles and San Diego were the two weakest regions, offset by strength in San Francisco and Seattle. Kilroy’s residential portfolio, which consists of approximately 1,000 residential units in Hollywood and San Diego, ended 2022 with 93.3% occupancy.
?
| KRC |
| [units in thousands, except ratios and per share metrics] |
| Year Ended December 31, |
| 2021 |
| 2022 |
| Weighted average shares/units |
| 118,868 |
| 118,999 |
| NOI |
| 688,708 |
| 780,809 |
| per share |
| $5.79 |
| $6.56 |
| Net Income Available to Common Stockholders |
| $628,144 |
| $232,615 |
| per share |
| $5.28 |
| $1.95 |
| Funds From Operations (FFO) |
| $462,314 |
| $556,631 |
| per share |
| $3.89 |
| $4.68 |
| Adjusted Funds from Operations (AFFO) |
| $357,209 |
| $444,797 |
| per share |
| $3.00 |
| $3.74 |
| Dividend per share |
| $2.04 |
| $2.12 |
| Dividend payout as % of FFO |
| 53% |
| 45% |
| Dividend payout as % of AFFO |
| 68% |
| 57% |
| Forward Looking Metrics: |
| Current Stock Price |
| $34 |
| Estimated FY 2023 Dividend |
| $2.20 |
| Estimated Dividend Yield |
| 6.5% |
| Market Cap |
| $3,952,830 |
| Debt |
| $4,262,996 |
| Cash and equivalents |
| $347,379 |
| Enterprise Value |
| $7,868,447 |
| Price to 2022 FFO |
| 7.2 |
| Price to 2022 AFFO |
| 9.0 |
| Implied Cap Rate (NOI/EV) |
| 9.92% |
| 2022 EBITDA |
| $640,800 |
| Debt to EBITDA |
| 6.7 |
Valuation
Kilroy’s valuation is similarly attractive. The stock is trading at a 7x to 2022 FFO, a 9x multiple to 2022 AFFO, and an implied cap rate of 10%. Considering that Kilroy has an additional 10% of space in development (1.05 million square feet in construction, and a further 700k square feet in renovation), investors are paying a bargain price for Kilroy’s assets.
Dividends
I estimate Kilroy will pay a dividend of $2.20 in FY2023, giving a forward yield of 6.5%. Historically speaking, Kilroy has increased its dividend by $0.02 or $0.03 every year (even through the pandemic). There was a $0.02 increase midway through both 2021 and 2022, so I am estimating FY2023 dividends will be comprised of $0.56 dividends in Q3 and Q4, along with the $0.54 already paid in Q1 and Q2. While Kilroy’s forward yield of 6.5% is lower than Vornado’s yield of 7.4%, Kilroy’s dividend is also safer due to it being a lower percentage of FFO and AFFO.
Debt
Like Vornado, Kilroy similarly has relatively low-cost debt and maturities that are spread evenly. The company has no debt maturing in 2023, and, except for 2026, has $500 million or less until 2032. Using FY2022 figures, Kilroy has a Debt to EBITDA ratio of 6.7x; using Q1 2023 EBITDA, the Debt to EBITDA ratio decreases to 6x. More than 90% of Kilroy’s debt is fixed rate, even better than Vornado’s.
Two unequally attractive opportunities
First, to put into context how cheaply Vornado and Kilroy are priced, both of these stocks traded for Price to FFO ratios in the mid-teen through the 2010s. Now Vornado is trading at 6x FFO and Kilroy is at 7x FFO—this implies if the business maintains (not even grows) its current levels of performance, the company will have generated the same amount of FFO as the initial investment within 6 or 7 years, respectively. Believe me, mid/high-single digit Price to FFO for REITs with desirable, high-quality assets is undoubtedly attractive. The current valuation more than compensates for the nonsensical negative sentiment surrounding the sector that Vornado and Kilroy operate in.
But if I had to choose between the two, I would side with Kilroy for one reason: debt.
Most REIT investors consider a Debt to EBITDA ratio between 3x and 6x as “safe.” Kilroy’s at the higher end of the range and Vornado’s 9.6x Debt to EBITDA is indeed elevated. However, as mentioned previously, both companies have an above-average number of projects in development, whose cost is reflected in the debt part of the ratio but not yet in the EBITDA part. Both companies’ management teams (especially their tenured CEOs) have been through multiple economic, credit, and business cycles—and I have confidence neither will imminently find itself in a destitute situation.
Considering that Vornado and Kilroy are equally inexpensive (Vornado has a lower Price to FFO, but Kilroy has a higher implied cap rate), Kilroy’s lighter debt load simply makes it more compelling. A stronger balance sheet should allay concerns from future creditors, allowing Kilroy to borrow at more attractive rates. And, if Kilroy wanted to, it has the ability to take on more leverage (though I personally think it would be irresponsible to borrow at these rates). As a result, I believe Kilroy is meaningfully less risky than Vornado.
With that being said, I am cautiously optimistic about the future of real estate in both Manhattan and the West Coast. Investors who have first-hand living or working experience in these localities may have strong feelings for/against one or the other.
In sum, investors who have a particular conviction about Manhattan and are willing to endure above-market beta may find Vornado more enticing. Investors who want a more conservatively financed company and who are also optimistic about software and biotech continuing to grow on the West Coast/Austin may prefer Kilroy.
But at the end of the day, I believe there is overseen upside in both Vornado and Kilroy. Indeed, investors willing to venture into stocks the buy side currently despises will be handsomely rewarded.
For further details see:
Vornado Vs. Kilroy Realty: I'm Upbeat On Both Of These High-Quality Office REITs - But Only Bought One