ASO - Voss Capital Q1 2023 Letter To Partners
2023-05-22 03:00:00 ET
Summary
- Voss Capital is a long-short hedge fund focused on value oriented special situations.
- Earnings have been resilient and are easily surpassing consensus expectations by a wide margin.
- We feel we are closing in on alpha once again and are poised to outperform as we move into the second half of the year and factor headwinds abate.
Dear Partners,
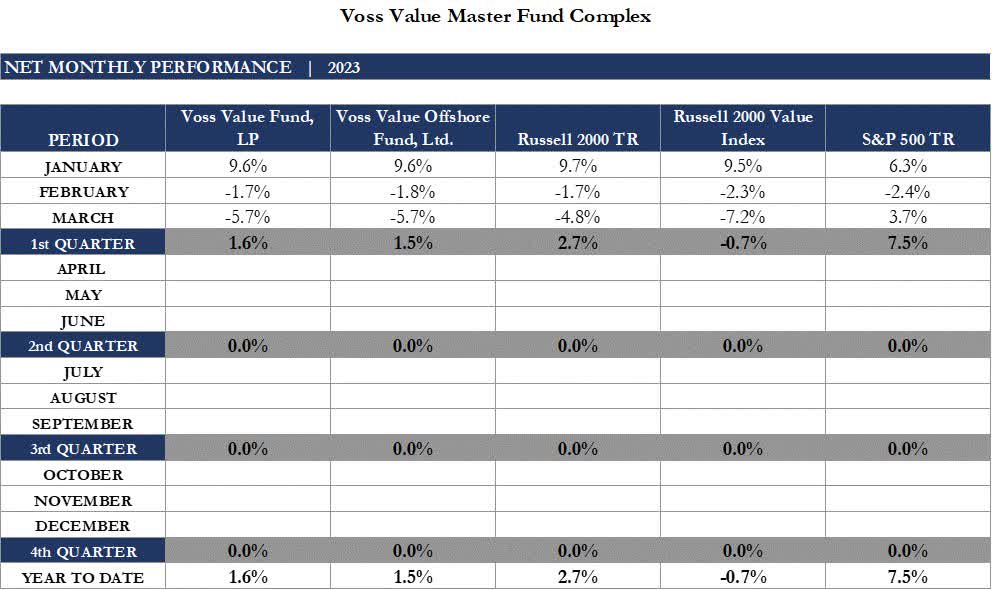
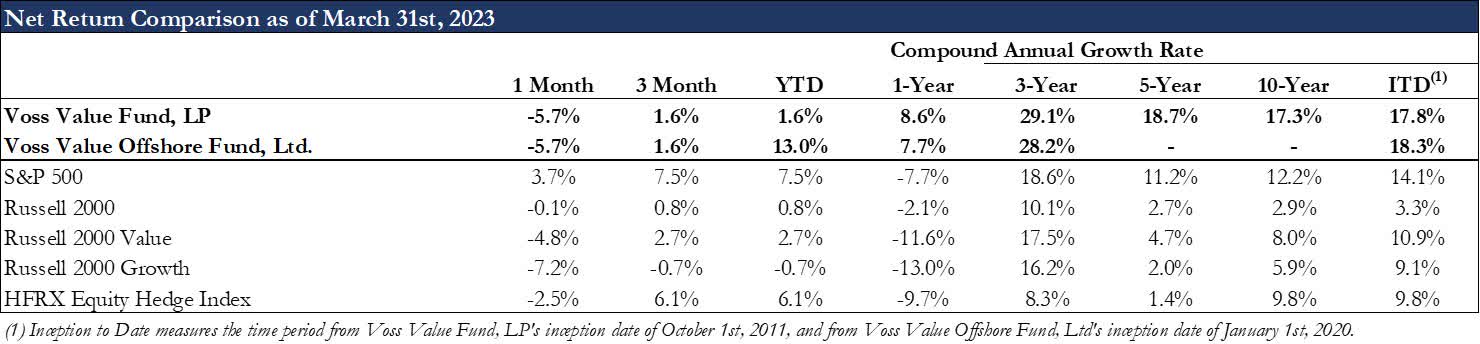
In Q1 2023, the Voss Value Fund, LP and the Voss Value Offshore Fund, Ltd., returned +1.6% and +1.5% to investors net of fees and expenses, respectively, compared to +2.7% total return for the Russell 2000, -0.7% total return for the Russell 2000 Value, and +7.5% total return for the S&P 500.
As of March 31st, 2023, the Voss Value Master Fund's total gross exposure stood at 155.6% and the net long exposure was 83.9%. The top 10 longs had a weight of 79.1%, and our top 10 shorts had a weight of 30.1%.
Voss Value Master Fund assets under management stood at approximately $238.6 million and Firm assets stood at approximately $751.5 million as of March 31st, 2023.
The table below shows the Voss Value feeder fund returns compared to some of the relevant indices:
We've played tag with Alpha so far this year and right now we're "it." In Q1 2023, we got off to a hot start but have given back a lot of alpha YTD, as the portfolio faced the headwinds of a major style factor shift coupled with extreme sectoral dispersion - namely the 29.1% spread between the Nasdaq 100 and Russell 2000 Value YTD through midday May 16th. This spread is amongst the largest spreads in history over such a short timeframe. 1 Since the Silicon Valley Bank failure, there has been a significant shift away from small-cap cyclical stocks (particularly those with any leverage) and companies reliant on credit. Instead, investors have been gravitating towards safe havens and "secular growth," such as mega-cap technology companies. This trend has been fueled by the intensified anticipation of a recession and tightening of credit, leading to a more dovish approach by the Federal Reserve.
Our team is closely monitoring Senior Loan Officer Opinion Survey (SLOOS) data and bank lending - the lifeblood of the economy. Time will tell how much regional bank lending slows from its blistering double-digit % pace early in 2023 and flattish pace post-SIVB failure. We will also have to wait to see how much of that slowdown is already priced into small-cap cyclicals/big-ticket consumer discretionary stocks that are at least somewhat dependent on lending (e.g., boat OEMs/dealerships). Another key factor often overlooked by the market is the size of the non-bank lending ecosystem and the amount of private credit fund dry powder on the sidelines that is anxious to step into any potential regional bank lending void (albeit at higher rates to the borrowers). As of April, the percentage of bankers reporting tightening credit standards for commercial and industrial (C&I) loans is consistent with levels that have historically preceded a y/y decline in bank loans within 12 months. At 46% as of the latest SLOOS report, this implies a 7.2% decline in C&I bank loans in Q1 2024, which would be on par with a normal recession. 2
Earnings have been resilient and are easily surpassing consensus expectations by a wide margin. Positive sales surprises have been particularly outsized within Consumer Discretionary stocks with the highest earnings beat rate in all of modern history and record low number of misses 3 . US consumer spending has been underestimated for the Nth time in a row and the number of jobs created has also surprised to the upside for a record number of months in a row. 4 Although M&A has been historically depressed so far YTD, we believe there is pent-up demand for deals as credit markets thaw. Voss is expecting a big rebound in the 2H that could benefit the portfolio given our outsized weighting to more idiosyncratic bottom-up ideas that could be attractive takeover targets.
JPM Securities Research, Financial Services, April 9, 2023
New Core Long: PLYA - Playa Hotels & Resorts
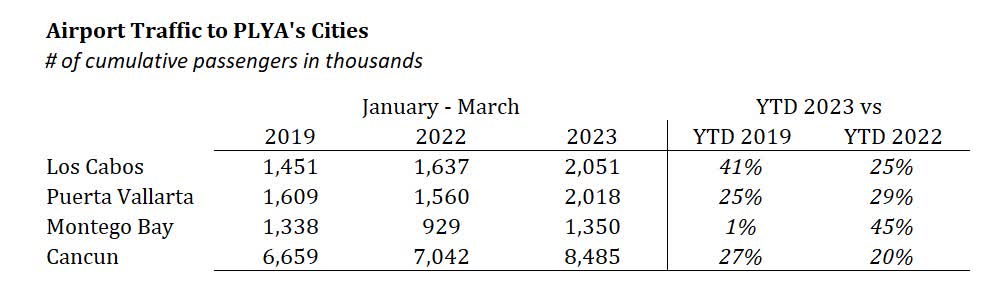
[[PLYA]] is the only publicly traded, all-inclusive resort owner-operator and has a portfolio of 25 all-inclusive resorts across Mexico, Jamaica, and the Dominican Republic. PLYA built its collection of resorts by acquiring properties from local family owner-operators. These acquisitions were then accompanied by strategic re-branding collaborations with renowned international chains such as Hyatt (H), Wyndham (WH), and Hilton (HLT). Hotels brought under the umbrella of a large global brand benefit from increased consumer awareness, access to the brand's loyalty member network, and increased negotiating power with the online travel agencies (OTAs), driving higher margins. In 2018, the company presented what appeared to be a credible path to $300 million in EBITDA by 2021, which included multiple high ROI projects that were set to be delivered at the end of 2019 and start generating significant cash flow in 2020. However, the COVID restrictions beginning in March 2020 forced the shutdown of all PLYA's resorts, reducing occupancy to 0% and delaying their path to $300 million. Earlier this year, we bought PLYA at the same enterprise value that it had in 2018 (~$2 billion). This was a bargain price considering the investments made back in 2018 and 2019 have begun to bear fruit and the additional tailwind of a boom in consumer travel to start 2023, which has particularly skewed toward Mexico and PLYA's budget-friendly, all-inclusive resorts. Airport traffic numbers for some of PLYA's most important locations (Los Cabos, Puerta Vallarta, Montego Bay, and Cancun - together accounting for 68% of total rooms) show strong passenger traffic growth compared to the same period in 2019 and 2022 5 .
Management is being proactive in creating value for shareholders by exploring sale opportunities for the lower to mid-tier assets (presumably at valuations above the stock's current valuation in the public market) with the goal of buying back stock. We also love that they added scales to all the bathrooms to cut down on food costs. Our base case assumes an 11x 2023 EBITDA multiple on $288 million EBITDA (adjusted for the $13 million drag from two resorts being sold) for a $3.1 billion EV. With $783 million in net debt, our price target is $15.20/share, a 70% upside from the current price of ~$8.90 per share as of the date of this letter.
Update on Long: ASO - Academy Sports and Outdoors
[[ASO]] is a sports and outdoor retailer based in Houston, TX, with 268 locations across 18 states. ASO is concentrated in the south and southeast, which contain many of the fastest-growing markets in the country in terms of both population and labor force. Of ASO's current footprint, 40% of stores are in Texas with another 40% spread across Florida, Georgia, Alabama, North Carolina, South Carolina, Arkansas, Oklahoma, and Tennessee - all states in the top 20 for net migration since 2020. ASO recently hosted an investor day where they presented their plan to reach $10 billion in revenue, 13.5% operating margins, and 10% net margins by 2027, with a 30% ROIC. This plan includes 120 - 140 new store openings and 3% average same-store sales for existing stores. The company emphasized that these targets were calculated with the assumption that there may be a recession in 2023 or 2024. While there are typically a lot of risks associated with a retailer or restaurant expanding into new markets that aren't familiar with the brand, we believe ASO has a good track record of doing this successfully and profitably. 7 All ASO's stores are profitable 6 , including stores that are the only Academy location in the state such as in West Virginia, Virginia, or Illinois. In fact, ASO's stores are so profitable that even its worst quartile of stores generates the same amount of operating income ($2 million EBIT per location) as its largest competitor's average store 7 .
Two of ASO's three distribution centers are currently operating at only 50% of capacity, giving them plenty of space to grow into with lower incremental capital needs. If the company executes on its guidance, it will generate $3.5 billion in free cash flow cumulatively from 2023 - 2027. Given this FCF build (assuming no buybacks or dividends), ASO's enterprise value in 2027 (at the current stock price) would be $1.8 billion or 1.1x 2027 EBIT. The 75th percentile of ASO's retail peer group trades at 14.5x FY2 EBIT. Achieving these targets over the next four years would cement ASO among the best-in-class public retailers, coming in above the 90th percentile in value-driving metrics including revenue growth, margins, and ROIC. However, even if ASO is valued at just the current median EV/EBIT multiple of the peer group (8.5x) in 2026, it would result in an enterprise value of $11.5 billion. If one adds on the estimated $3.2 billion in net cash in 2027, this will equate to an equity value of $14.7 billion or $184/share, 207% upside from today's price of ~$60/share or a 45% 3-year CAGR. This assumes the management team can more or less hit the targets they laid out at their 2023 investor day in April - but should they whiff, there could be a downside buffer (or further upside) if there is any value-additive capital allocation along the way.
Significantly Upsized Core Long: ECN Capital (ECN CN)
ECN ( ECNCF ) is a financial services company that primarily originates loans on behalf of its customers. ECN's customers include banks, credit unions, insurance companies, and other institutional investors. ECN generates revenue from loan origination fees as well as recurring loan servicing fees on most loans originated, with the underlying credit performance being non-recourse to ECN.
ECN operates through two segments. The first, Triad, originates and services loans in the manufactured housing (MH) industry. Triad is the second largest manufactured home loan originator in the US and will likely generate over $1.5B of manufactured home loans in 2023 per their estimates 8 (Berkshire Hathaway's ( BRK.A ) ( BRK.B ) 21st Mortgage is #1 in terms of market share). Although there may be some uncertainty on manufactured housing volumes in 2023, we believe Triad is positioned to maintain strong long-term growth. Manufactured housing provides the most affordable housing option for many people amidst a broad and growing housing affordability crisis across the country. By way of comparison, the average rent for a 2-bedroom apartment is $1,332/month versus Triad's average customer's mortgage payment of $829/month 9 . We feel MH's strong value proposition will increase demand for manufactured homes in the years to come. In addition to benefiting from industry tailwinds, Triad has been successful in broadening the menu of loans they are able to originate. Triad's historical core loan product has been super prime (high FICO score) chattel or property-only loans. Over the last few years, Triad has been able to grow related loan originations for Land+Home loans, manufactured home rental loans, and lower FICO score loans (their "Bronze" and "Silver" programs). Triad was able to originate about 27% of its total loans from these related products in 2022, up from only 4% in 2019. We believe the potent mix of industry shipment tailwinds, Triad's ability to take market share in core chattel loans, and their growth through a broadening of loan products offered to lending partners will continue to drive a high revenue growth rate while enjoying strong operating margins in the high 30s range.
The second business unit operates under the IFG & Source One banners and originates and services loans in the RV & Marine industry. The businesses in this unit were acquired by ECN in 2021 and 2022 when management saw an opportunity to develop and scale another niche origination platform in the RV & Marine industry, using the expertise they gained from Triad and previously owned Service Finance (home improvement loans) operations. We expect the RV & Marine business to originate about $1.3B in loans for its customers in 2023. IFG & Source One were each regional lenders that are currently in the process of rolling out operations nationally under ECN's ownership. For instance, three years ago Source One was not operating any meaningful business in California, Florida, or New York, despite these three states accounting for about 22% of the total RV & Boat sales in the US. Source One has since worked to secure licenses to expand their operations across the country which we believe will lead to an exceptional CAGR over the coming years as the business continues to expand geographically.
ECN has recently developed a related product for its funding partners in the form of inventory financing loans ("IF"). These loans help manufactured home dealers, boat dealers, and RV dealers fund the inventory they keep on-site as part of their ongoing operations. ECN's "IF" loans have historically had extremely low losses and currently generate a very attractive earnings yield compared to their risk profile. As such, we believe these are attractive loans for ECN's lending partners to own. ECN is projected to start to meaningfully originate and "flow" these loans to their lending partners in the coming quarters and years. In conjunction with this new product, ECN has kept a fair amount of these loans on their balance sheet, given the attractive economics. ECN borrows against the inventory loans it owns and thus earns a spread between the interest received and the interest paid (both assets and liabilities have variable interest rates). This practice has caused some consternation amongst the investment community (especially given the recent focus on credit amidst rising interest rates and ongoing panic over recession). Our view is that these inventory financing loans will continue to be low-risk loans as they have been for many years (<5 bps of cumulative net charge-offs over the last three years) - the fact that ECN holds some amount on their balance sheet does not pose an existential risk to the business.
We may have buried the lede here, but the kicker is that the Company has received unsolicited inbound interests and therefore hired Goldman Sachs and initiated a formal Strategic Review process. While our team is unsure what exactly will come of this review as many similar processes are failing to land buyers lately, we do believe that ECN would be a phenomenal business to own for an institutional investor with long-duration liabilities that could retain the loans that ECN originates on their own balance sheet. ECN's broad and long-standing relationships with manufactured home, RV, and marine dealers across the country is an asset that would be difficult and costly to replicate. ECN's management has been involved in many specialty finance transactions over the years and we believe they understand the significant strategic value of the underwriting platform. If there is a deal to be done, we are confident they will ensure an appropriate value is received.
If there is a full buyout of ECN, we think it could be around CAD$4.50/share. The components of this value are CAD$4.30/share for Triad at 14.0x 2023 operating income and CAD$1.60/share for Marine and RV at 12.0x 2023 operating income. These values are netted against capitalized corporate expense and net debt & preferred stock of CAD$1.40/share. If there is no buyout, we think ECN will enjoy strong earnings growth in the years ahead, and at current prices, we don't believe the market appreciates this potential growth. Voss has acquired ~13% of the company and it is currently a ~9% position in the Voss Value Master Fund as of today.
Conclusion
We feel we are closing in on alpha once again and are poised to outperform as we move into the second half of the year and factor headwinds abate. Our bottom-up derived conviction in the portfolio remains strong given our long portfolio's weighted average FCF yield of ~15%, combined with good growth, low leverage, and average buyback authorizations in place of >7% of shares outstanding. 10
In our view, the extent of negative sentiment amongst market participants remains a historical anomaly as the greatest proportion ever of market participants are expecting a recession and declining equity markets. However, this fear is counterbalanced by normal valuations across almost all equity cohorts outside of small-cap value. The way we see it, the base case market outlook would be that the global economy continues to surprise to the upside, and crowded positioning into tech and safe havens will unwind somewhat as rates and growth remain firmer than is widely anticipated. However, keeping an eye on bank lending ~6 months from now will be key.
Whenever market conditions become confusing, it is human nature to seek order and understanding amongst the bedlam of echoing opinions. Any data or anecdotes, however, can be carefully clipped, extrapolated, or combined in novel ways to support any number of contradictory viewpoints and Mr. Market changes his mask in cunning new ways, often appearing to take on the guise that we attribute to him. He is perfectly evolved to make fools of us all time and again by simultaneously seeming to agree with us, then dodging us despite our carefully underwritten assumptions. As always, we proceed cautiously as we can't help but keep this absorbing duplicity front of mind.
Sincerely,
Voss Team
Appendix:
- Bloomberg
- Federal Reserve SLOOS Data a nd Voss internal estimate
- Goldman Sachs Research
- U.S. Bureau of Labor Statistics via FRED, CNBC
- Grupo Aeroportuario del Pacifico, Grupo Aeroportuario del Surest
- PLYA Q4 2022 Earnings Call Commentary, February 24, 2023
- ASO Financial Filing and Voss internal analysis, the largest competitor is Dick's ( DKS ) and a comparison can be found on ASO Investor Day Presentation , slide 36
- ECN Q4 2022 Presentation , slide 20
- ECN Q3 2022 Financial Results , slide 13 and Apartment List rent estimates 10 Voss internal estimates
Common Terms:
| CAGR - Compound Annual Growth Rate |
| IRR - Internal Rate of Return |
| CAPEX - Capital Expenditures |
| LTM - Last Twelve Months |
| COGS - Cost of Goods Sold |
| M&A - Mergers and Acquisitions |
| DCF - Discounted Cash Flow |
| NTM - Next Twelve Months |
| EBIT - Earnings Before Interest and Taxes |
| OPEX - Operating Expenses |
| EBITDA - Earnings Before Interest, Taxes, Depreciation & Amortization |
| P/E - Price to Earnings |
| EPS - Earnings per Share |
| P&L - Profit and Loss Statement |
| EV - Enterprise Value |
| P&S - Purchase and Sale Statement |
| FCF - Free Cash Flow |
| SG&A - Selling, General, and Administrative Expenses |
| GDP - Gross Domestic Product |
| YTD - Year to Date |
Disclosures and Notices:
Beginning January 1, 2020, all investment activity is conducted by the Voss Value Master Fund, LP (the "Master Fund"), which has two feeder funds, and therefore performance figures from January 1, 2020, onward are calculated based on the Master Fund. All limited partners invest in the Fund through one or more of the following feeder funds: Voss Value Offshore Fund, Ltd. (the "Offshore Fund") and Voss Value Fund, LP (the "Predecessor Fund"), each a "Feeder Fund". Performance figures for the Predecessor Fund are contributable to Travis Cocke as sole portfolio manager. Mr. Cocke maintains the same the position with the Fund and the Fund will employ a similar strategy as the Predecessor Fund. Actual returns are specific to each investor investing through a Feeder Fund. Each Feeder Fund was established at different times and has varying subsets of investors who may have had different fee structures than those currently being offered. As a result of differing fee structures, differing tax impact on onshore and offshore investors, the timing of subscriptions and redemptions, and other factors, the actual performance experienced by an investor may differ materially from the performance reported above. Portfolio statistics shown are inclusive of the Predecessor Fund and the Offshore Fund.
This letter is provided by Voss Capital, LLC ("Voss", "the Firm", "the Voss Team", and "our team") for informational purposes only and does not constitute an offer or a solicitation to buy, hold, or sell an interest in the Voss Value Fund, LP (the "Fund") or any other security. An investment in the Fund is speculative and involves substantial risks. Additional information regarding the Fund, including fees, expenses, and risks of investment, is contained in the offering memorandum and related documents and should be carefully reviewed. An offer or solicitation of an investment in the Fund will only be made pursuant to an offering memorandum. This communication is confidential and may not be reproduced or distributed without prior written permission from Voss. This confidential report is only intended for the recipient and may not be redistributed without the prior written consent of Voss. The information contained herein reflects the opinions and projections of Voss as of the date of publication, which are subject to change without notice at any time subsequent to the date of issue. All information provided is for informational purposes only and should not be deemed as investment advice or a recommendation to purchase or sell any specific security. Data included in this letter comes from company filings and presentations, analyst reports, and Voss' estimates. While the information presented herein is believed to be reliable, no representation or warranty is made concerning the accuracy of any data presented. Certain information contained in this letter constitutes "forward-looking statements" which can be identified by the use of forward-looking terminology such as "may," will," "should," "expect," "attempt," "anticipate," "project," "estimate, or "seek" or the negatives thereof or other variations thereon or comparable terminology. Due to various risks and uncertainties, actual events or results in the actual performance of the Fund may differ materially from those reflected or contemplated in such forward-looking statements. There can be no guarantee that the Fund will achieve its investment objectives and Voss does not represent that any opinion or projection will be realized. The securities contained within the benchmark indices highlighted herein do not necessarily correspond to investments and exposures that will be held by the Fund and are therefore of limited use in predicting future performance of the fund. Indexes are unmanaged and have no fees or expenses. An investment cannot be made directly in an index. The Fund consists of securities that vary significantly from those in the benchmark indexes listed below. Accordingly, comparing results shown to those of such indexes may be of limited use. The S&P 500 Total Return Index is a market cap-weighted index of 500 widely held stocks often used as a proxy for the overall U.S. equity market. The Russell 2000 index is an index measuring the performance of approximately 2,000 small-cap companies in the Russell 3000 Index. The Russell 2000 serves as a benchmark for small-cap stocks in the United States. The Russell 2000 Growth Index measures the performance of those Russell 2000 companies with higher price/book ratios and higher predicted and historical growth rates. The Russell 2000 Value Index measures the performance of the small-cap value segment of the U.S. equity universe. It includes those Russell 2000 companies with lower price-to-book ratios and lower expected and historical growth values. HRX Equity Hedge Index consists of Equity Hedge strategies that maintain positions both long and short in primarily equity and equity derivative securities. A wide variety of investment processes can be employed to arrive at an investment decision, including both quantitative and fundamental techniques; strategies can be broadly diversified or narrowly focused on specific sectors and can range broadly in terms of levels of net exposure, leverage employed, holding period, concentrations of market capitalizations and valuation ranges of typical portfolios. The strategy utilized by Voss has a high tolerance for uncertainty. Different types of investments involve varying degrees of risk. Therefore, it should not be assumed that the future performance of any specific investment or investment strategy will be profitable. Asset allocation may be used in an effort to manage risk and enhance returns. It does not, however, guarantee a profit or protect against loss. Past performance does not guarantee future results.
Editor's Note: The summary bullets for this article were chosen by Seeking Alpha editors.
For further details see:
Voss Capital Q1 2023 Letter To Partners